
Lung Function Classification of Smartphone Recordings
Comparison of Signal Processing and Machine Learning Combination Sets
Jo
˜
ao Teixeira
1
, Lu
´
ıs Teixeira
2
, Jo
˜
ao Fonseca
3
and Tiago Jacinto
3
1
Department of Electrical and Computer Engineering, University of Porto, Porto, Portugal
2
Department of Informatics Engineering, University of Porto, Porto, Portugal
3
Department of Health Information and Decision Sciences, University of Porto, Porto, Portugal
Keywords:
Asthma, Breath, COPD, Machine Learning, Signal Processing, Smartphone, Spirometry.
Abstract:
Worldwide, over 250 million people are affected by chronic lung conditions such as Asthma and COPD.
These can cause breathlessness, a harsh decrease in quality of life and, if not detected and duly managed, even
death. In this paper, we aim to find the best and most efficient combination of signal processing and machine
learning approaches to produce a smartphone application that could accurately classify lung function, using
microphone recordings as the only input. A total of 61 patients performed the forced expiration maneuver
providing a dataset of 101 recordings. The signal processing comparison experiments were conducted in
a backward selection approach, reducing from 54 to 12 final envelopes, per recording. The classification
experiments focused first on differentiating Normal from Abnormal lung function, and second in multiple
lung function patterns. The results from this project encourage further development of the system.
1 INTRODUCTION
Chronic respiratory diseases such as Asthma and
Chronic Obstructive Pulmonary Disease (COPD) are
incurable, yet treatable and their early detection is
crucial to provide a better quality of life. Major risk
factors include air pollution, tobacco smoking and oc-
cupational environments containing dust and chem-
icals. The World Health Organization (WHO) esti-
mates that over 250 million people suffer from asthma
and COPD (World Health Organization, 2013a) and
more than 3 million people died of COPD in 2005
(World Health Organization, 2013b).
Spirometry is the measurement of breath, i.e., is
the most popular noninvasive set of timed tests that
enables to measure the mechanical properties of the
lungs, also named pulmonary function (Pierce, 2005).
The keystone test is the Forced Expiratory Maneuver
(FEM) where the patient fully inspires and then force-
fully exhales all the air available, as fast as possible.
The increasing use of smartphones has enabled the
emergence of several health related systems. Their
computational power is ever increasing and, equipped
with multiple sensors, it is possible to develop disease
prevention, diagnosis and monitoring applications.
The aim of this paper is to compare several groups
of methods and clinical parameters in order to find the
most relevant, most efficient and faster combination
to produce a smartphone app for measuring and clas-
sifying lung function. The system’s input is restricted
to the smartphone’s built-in microphone, in order to
avoid external components.
2 BACKGROUND AND RELATED
WORK
Traditional spirometers accurately measure a wide
range of lung function parameters but have the disad-
vantage of being very expensive and being of sizable
dimensions.
Portable spirometers were developed to meet the
needs of home spirometry and thus, they disregard
many unused functions and measurements. Addition-
ally, their cost and dimensions are smaller.
The most recent spirometers use laptops as com-
putational platforms and airflow sensors that use USB
connections. This enabled to reuse the computing
platform and easily transport the system.
The next logical step concerning portability and
affordability involves lung function estimation with
smartphones’ microphones. Some studies have al-
ready been conducted in order to accurately mea-
123
Teixeira J., Teixeira L., Fonseca J. and Jacinto T..
Lung Function Classification of Smartphone Recordings - Comparison of Signal Processing and Machine Learning Combination Sets.
DOI: 10.5220/0005222001230130
In Proceedings of the International Conference on Health Informatics (HEALTHINF-2015), pages 123-130
ISBN: 978-989-758-068-0
Copyright
c
2015 SCITEPRESS (Science and Technology Publications, Lda.)
sure the clinical parameters (Larson et al., 2012), (Xu
et al., 2013), and also considering robustness to am-
bient noise (van Stein, 2013).
3 DATA COLLECTION
PROCEDURE
The dataset is composed by 101 recordings from 61
caucasian adult patients performing the forced expi-
ration maneuver, without any mouthpiece, at an arm’s
length. Some recordings were gathered on a con-
trolled environment with low background noise, how-
ever more than 80% of the recordings experienced
background noise such as physicians giving verbal in-
centive, talking voices and small machine noises at
a short distance. The recordings were made using a
Samsung GT-I9000.
Each recording is accompanied by the patient’s
anthropometric parameters (age, height, weight and
gender), clinical parameters, and classification of
the patients lung function provided by the record-
ing physician. The clinical parameters were obtained
by performing the FEM to one of the spirometers
available (MIR SpiroDoc, Carefusion Jaeger IOS).
The classification types are normal and abnormal (ob-
struction, restriction or mixed).
The included patients were part of the clinical
study Control and Burden of Asthma and Rhinitis
(ICAR), patients attending the allergology clinic from
CUF Porto Institute (ICP) or from CUF Porto Hospi-
tal (HCP). Data collection occurred between April 3rd
and June 5th 2014.
4 ALGORITHMS AND SYSTEM
ARCHITECTURE
4.1 Signal Processing
The system’s input consists of microphone recordings
which are AC coupled, uncalibrated signals that rep-
resent air pressure. The signal processing pipeline can
be divided in four portions: automatic signal segmen-
tation, signal pre-processing, envelope generation and
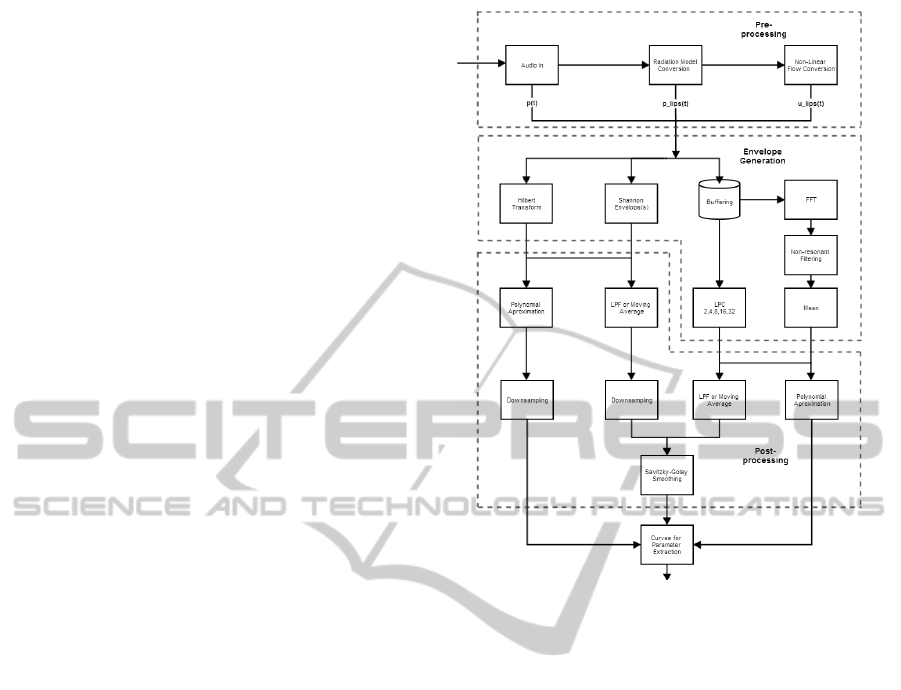
envelope processing. Figure 1 shows the initial archi-
tecture for the signal processing part without the sig-
nal segmentation.
4.1.1 Automatic Signal Segmentation
The audio input was initially segmented in order to
remove non expiration sounds, such as the inspiration
Figure 1: Initial Signal Processing System.
portion of the maneuver and ambient noise. The def-
inition and cropping the beginning of the sound was
accomplished using a modified version of the Back-
Extrapolation algorithm (Miller et al., 2005).
First, an LPC envelope of the signal is obtained,
as it will be described further on the paper, then the
minimum value between inspiration and expiration
peaks is found and the initial part is removed. After-
wards, the zero-time back-extrapolation is performed
by finding the instant corresponding to the envelope’s
peak (PEF time), calculating the Time-Volume curve,
drawing the tangent at the PEF time and finding where
the tangent crosses the abscissas, which is the initial
instant.
The ending at noise level was detected using a
sliding window algorithm (5% of signal’s length, 25%
overlap) based on the magnitude ratio threshold of the
maximum value (2%).
4.1.2 Signal Pre-processing
The recordings are limited in excursion and patients
need to perform the expiratory maneuver at an arms
length to avoid microphone saturation. Therefore, it
seems relevant to compensate the pressure lost be-
tween the lips (p
lips
) and smartphone (p), using an In-
verse Radiation Model. Furthermore, this model also
HEALTHINF2015-InternationalConferenceonHealthInformatics
124

atones the reverberation effect from sound reflections
around a person’s body. Afterwards, p
lips
was con-
verted to airflow at the lips (u
lips
), using a Pressure
to Flow Conversion Model. Both models were devel-
oped in similar fashion to (Larson et al., 2012).
4.1.3 Envelope Generation
The third stage employed several methods to calcu-
late the signal envelopes, approaching different sound
characteristics to obtain a comprehensively robust
feature extraction. The algorithms’ input consisted of
both the segmented audio and the two resulting sig-
nals from the pre-processing stage, as all of them can
be considering roughly proportional to air flow.
Generic Envelope Extraction. To obtain an enve-
lope based on a time domain approach two methods
were used: the Hilbert Transform and Shannon curves
(Liang et al., 1997). The first approach consists of
calculating the signal’s harmonic conjugate with the
Hilbert Transform and to add it back to the signal,
resulting on an envelope. The second approach in-
volves calculating the Shannon Entropy and Energy
envelopes of the signal. They act as non-linear trans-
formations focusing either on the higher (Energy) and
lower (Entropy) intensities of the signal. Both ap-
proaches output highly noisy curves that need subse-
quent smoothing.
Linear Predictive Coding. The audio input is seg-
mented in windows of 31.25ms, with 50% overlap.
The white noise variance, or power, is obtained from
the LPC model outputs. While the LPC filters can
approximate the vocal tract (Wakita, 1973), the suc-
cession of power values should be proportional to the
exhalation power at the respective time and constitute
a sampled envelope of the signal. The implementation
included models of degrees 2, 4, 8, 16 and 32, which
represents increasing vocal complexity.
Mean of Resonances. Similarly to LPC, the signal
was buffered into 31.25ms frames, with 50% over-
lap. Each frame underwent a 256-point FFT opera-
tion using a hamming window, producing a spectro-
gram. All spectrogram values lower then 20% the
respective frames’ maximum were considered noise
and were consequently discarded. Resonances over
250ms, within the respective frequencies’ 2 bin neigh-
borhood were kept, preserving only relatively large
and long frequencies, and taking into account the nat-
ural occurring frequency shift. The envelope was ob-
tained by averaging the frames’ saved resonances.
4.1.4 Envelope Post-processing
The several envelopes obtained were processed using
different settings in order to find the best combination
for the application. The envelopes were smoothed by
either a regular low pass filter (LPF) or a moving aver-
age (MA) and, in parallel, were also approximated by
a 4th order polynomial. To obtain the same sampling
rate as the buffered methods, the Hilbert Transform
and Shannon envelopes’ results were downsampled
accordingly. The non-approximated envelopes were
further processed using a Savitzky-Golay filter (SG)
with order 3 and size 11 (Savitzky and Golay, 1964),
as depicted on Figure 1.
4.2 Parameter Extraction
For each recording, the spirometry parameters were
calculated from each of the final envelopes. The
measurements extracted were PEF, FVC, FEV
1
,
FEV
1
/FVC, FEF
25%−75%
, FEF
25%
, FEF
50%
, FEF
75%
and a custom parameter proposed in (van Stein,
2013). The envelopes are viewed as Flow-Time
curves, typical of spirometer reports.
PEF is defined as the Peak Expiratory Flow or
the global maximum of the audio envelope. By
integrating the envelope with respect to time the
Volume-Time curve can be obtained. FVC is de-
fined as the total volume expired of a FEM. FEV
1
is the total volume expired during the first second.
FEF
25%−75%
corresponds to
1
/2FVC / (t
75%
−t
25%
), in
which t
x%
is the time at which the volume corresponds
to x% of the FVC. FEF
x%
is the instantaneous flow
value at x% of the total volume. Due to the highly
noisy nature of the recordings, these last measure-
ments were calculated as the average flow during an
interval of 5% the total sound’s duration, around the
corresponding time instant.
4.3 Machine Learning
The system’s machine learning pipeline can be di-
vided into two stages: the parameter regression and
the classification. The first uses the parameters ex-
tracted from the curves to obtain an estimation of
the respective clinical values as given by spirometers.
The second devises models that can discern between
the possible illness states, initially addressing the dis-
tinction of normal from abnormal lung function and
then, normal from 3 types of pathologies.
4.3.1 Regression Stage
Every recording produces several envelopes and each
one is used to extract clinical measurements. This in-
LungFunctionClassificationofSmartphoneRecordings-ComparisonofSignalProcessingandMachineLearning
CombinationSets
125
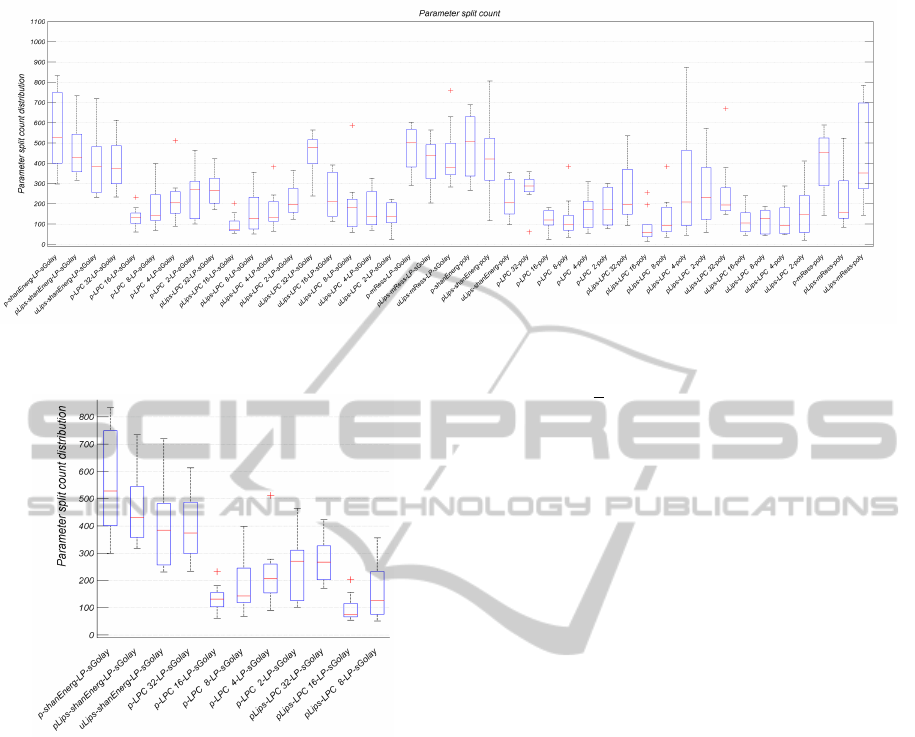
Figure 2: Split count distribution across the 9 parameters. Represents and enables to compare the gross importance of each
envelope generating process.
Figure 3: Enlargement of the left portion of the split count
distribution graphic (refer to Figure 2).
formation is used to produce a relatively robust esti-
mation of the respective spirometer measurement. For
instance, each set of PEF measurements computed
from any recording is used as a batch input for the
trained regression model to obtain an estimated PEF
value and the process is repeated for the other types
of clinical measurements. The corresponding spirom-
eter measurements acted as ground truth or regres-
sion targets. For this task Regression Tree Bagging
(Breiman, 1996) and Random Forests (RF) (Breiman,
2001) were used in 180 tree ensembles. Also, RF em-
ployed a selection size for the random feature subset
of n/3 out of the total n feature set.
4.3.2 Classification Stage
On this stage, the regressed parameters were the input
of the learning models. Several different classification
models were tested, namely: Decision Trees (Bun-
tine, 1992), either as one tree, Tree Bagging, Ran-
dom Forest (
√
n subset) and AdaBoost (Freund and
Schapire, 1996), Support Vector Machines (SVM)
(Vapnik, 1999) and Na
¨
ıve Bayes (Russel and Norvig,
2002). Although the tree ensemble methods used 70
trees, only 10 trees were grown for AdaBoost to avoid
overfitting. With the exception of SVM which was
implemented using linear kernel models of LIBSVM,
all the machine learning methods used were the de-
fault implementations available in Matlab.
5 EXPERIMENTAL APPROACH
5.1 Regression Experiments
The algorithms used on the experiments were based
on a backward selection approach. Initially, all the
signal processing methods were used and the clini-
cal parameters’ sets were obtained by successively re-
moving some methods out of the initial set. For each
pipeline tested, a 5-fold cross validation data set was
made to verify the models’ expected accuracy and to
obtain the average regression error and standard devi-
ation.
The following method comparison experiments
were conducted:
1. Influence of p
lips
,
2. Filtering (LPF vs. Moving Average),
3. Hilbert Transform vs. Shannon envelopes,
4. Shannon Entropy vs. Energy,
5. LPC options,
6. LPF vs. SG,
7. Influence of Polynomial fitting.
HEALTHINF2015-InternationalConferenceonHealthInformatics
126

Table 1: Comparison of regression error average and standard deviation for every parameter, and for the first (using all
methods) and final signal processing pipeline.
Data
type
Exp. Models
Regressed Parameters
PEF FVC FEV
1
Tiff MMEF Cust FEF25 FEF50 FEF75
Avg.
%
First/
All
Bag 19.95 30.58 22.20 10.61 43.19 24.01 64.21 42.07 33.92
RF 19.80 30.12 22.73 9.92 45.41 25.04 65.79 40.01 34.21
Final
Bag 20.22 30.08 24.58 10.06 42.74 23.87 75.56 42.64 34.09
RF 20.80 30.38 23.92 9.56 43.04 24.66 67.67 41.30 33.06
Std.
%
First/
All
Bag 20.64 27.09 19.85 8.87 54.65 27.03 91.28 48.19 40.65
RF 19.96 28.27 20.04 9.11 58.81 28.42 87.87 43.69 46.78
Final
Bag 19.33 28.50 21.14 8.37 56.42 25.86 112.39 50.48 45.75
RF 21.15 29.18 21.23 8.88 54.00 27.17 90.48 49.37 41.16
Two types of measurements were used to assess
the method sets, the simple comparison of the regres-
sion average error, the process’ tree split count and
respective distribution across the parameters. Figures
2 and 3 show the split count distribution of regres-
sion Exp.5, using 5-fold bagging ensembles of 180
trees per parameter. Each box includes the 9 clini-
cal parameters’ split count for each envelope process.
For instance, the first box, which corresponds to the
envelope process p → Shannon Energy → LPF →
SG, presents a higher split count across all parameters
than the tenth box, which corresponds to the envelope
process p → p
lips
→ LPC 16 → LPF → SG. This
suggests that the second option is the less relevant of
the two, concerning the regression models’ learning
process.
5.2 Classification Experiments
The classification process was first devised as a Nor-
mal against Abnormal classification problem, re-
ferred to as two label experiments (TLE). Then,
multiple label experiments (MLE) were conducted,
where the models tried to distinguish between Normal
lung function and Obstruction, Restriction and Mixed
pathologies. For both problems, the experiments var-
ied on the feature space used. The experiments used:
1. Set A
1
and Set B
2
,
2. Set A,
3. Set A, Set B and height,
4. Set A, Set B, height and age,
5. Set A, height and age.
1
Set A: PEF, FEV
1
, FVC, FEV
1
/FVC
2
Set B: FEF
25%−75%
, Custom, FEF
25%
, FEF
50%
and
FEF
75%
6 RESULTS AND DISCUSSION
6.1 Regression Experiments
Concerning the regression results, Exp. 1 did not at-
tribute significant importance to the Inverse Radiation
Model and respective gain on the Pressure to Flow
Conversion Model, since p
lips
did not influence the
results. However, the split count results revealed that
both pre-processing models’ and unprocessed audio
signals contributed in similar amount to the regression
trees’ growth. Therefore, all pre-processing models
were kept.
On Exp. 2, both methods presented the same re-
sults and Moving Average was discarded since it em-
ployed a similar concept to SG. On Exp. 3, the Hilbert
Transform presented the approximate same impor-
tance as the Shannon envelopes and Hilbert Trans-
form was removed for its computational complexity.
On Exp. 4, Shannon Entropy and Energy, had simi-
lar results, and Shannon Entropy was removed since
it was the one with the lowest and less stable tree bag-
ging split count.
On Exp. 5, the same split count pointed that the
middle complexity LPC envelopes were less relevant
and they were removed since the regression results
did not change upon removal. Exp. 6 enabled to re-
move SG altogether due to its lower influence on the
tree split count. On Exp 7 the choice of maintaining
LPF over Polynomial approximation was made due to
the LPF’s lower computational complexity and more
visual information.
Throughout the experiments, regressing the pa-
rameters using Bagging and Random Forest always
presented very similar results. Therefore, the re-
gressed parameters used on the classification exper-
iments were obtained using Random Forest in order
to reduce overfitting and shorten the regression time
of the final system. Table 1 presents the regression
results for the first and final experiments. Bag refers
LungFunctionClassificationofSmartphoneRecordings-ComparisonofSignalProcessingandMachineLearning
CombinationSets
127
to Tree Bagging and RF to Random Forest models.
Tiff is the modified Tiffeneau index, FEV
1
/FVC, and
MMEF is also known as FEF
25%−75%
. FEFx refers to
FEF
x%
.
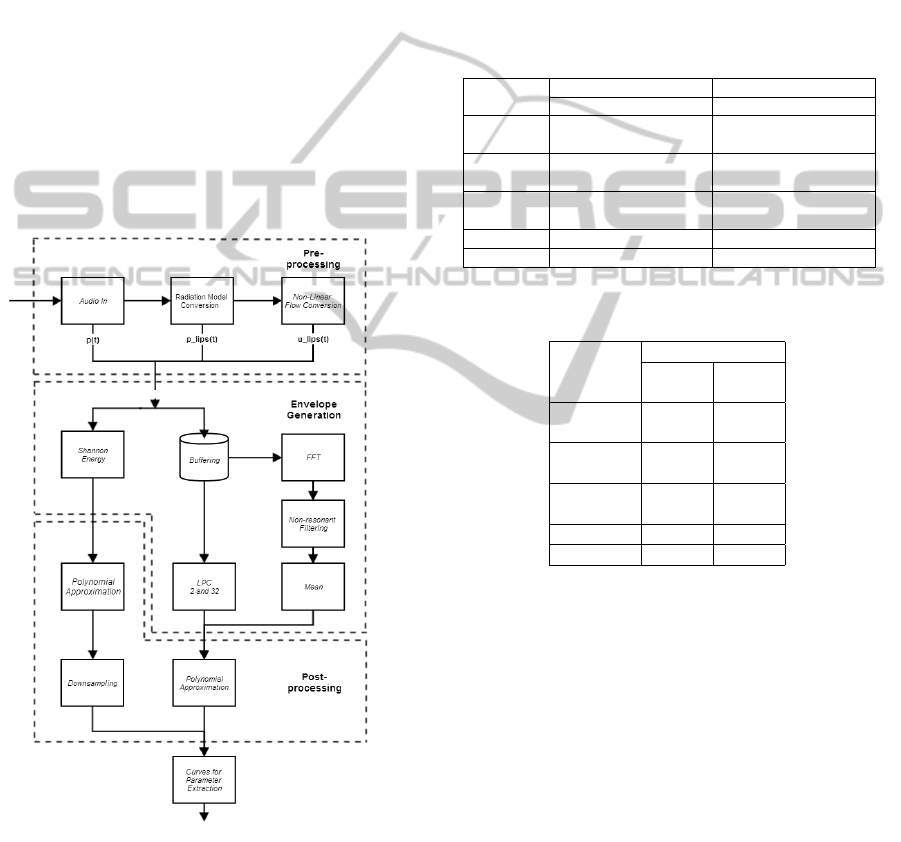
6.2 Classification Experiments
On the classification experiments both LPF and Poly-
nomial Approximation parameter sets were tested on
the classifiers from Exp. 1 of TLE and Exp. 5 of
MLE. On the first case, the polynomial fitting pre-
sented clearly superior results than LPF, with, at least,
5% less misclassification error rate. On the second
case, the results are closer between the options, dif-
fering around 2%, with higher variability. All other
classification experiments were conducted using the
final signal processing architecture, shown on Figure
4, which disregarded LPF for Polynomial Approxi-
mation.
Figure 4: Final Signal Processing Architecture.
Generally and in Exp. 5 of TLE and MLE, the
tree ensemble methods and Linear SVM presented
the best results. For simplicity of implementation and
speed of training and testing, Random Forest was cho-
sen for the final prototype. Tables 2 and 3 present the
classification results for both problems, using the final
prototype. Err. refers to error rate, Prec. to Precision
and Rec. to Recall. The single decision tree classifier
was included for reference.
For both problems, Exp. 2 through 5 gradually im-
proved the results across the learning methods. This
indicates that the anthropometric parameters are of
the utmost value when dealing with spirometric pa-
rameters. Lung volumes and flows are only relevant
when considering the patient’s physical characteris-
tics.
Table 2: Two label classification problem (TLP) results (%)
for the best performing models and single tree classifier.
Method
TLP - Exp. 1 TLP - Exp. 5
Err. Prec. Rec. Err. Prec. Rec.
Single
Tree
29.7 78.1 80.2 18.8 86.1 87.3
Tree
Bagging
24.7 81.1 84.5 15.8 86.6 91.5
Random
Forest
29.7 79.7 77.4 7.9 90.9 98.5
Adaboost 32.6 79.6 71.8 9.9 92.9 92.9
SVM 29.7 78.1 80.2 8.9 90.7 97.1
Table 3: Multiple label classification problem (MLP) results
for the best performing models and single tree classifier.
Method
Error Rate %
MLP
Exp. 1
MLP
Exp. 5
Single
Tree
44.5 27.7
Tree
Bagging
27.7 19.8
Random
Forest
27.7 17.8
Adaboost 27.7 19.8
SVM 33.6 14.8
6.3 Analysis of the Regression Results
using the Final Architecture
Once the signal processing architecture is defined it
is important to evaluate whether the lung function pa-
rameters are under-estimated or over-estimated. Fig-
ure 5 shows Bland-Altman plots (Bland and Altman,
1986) of the 4 most popular clinical parameters, dis-
tinguishing between the spirometer target and the re-
gressed values versus the mean between the target and
regressed values. Also, the average error (dashdot)
and the ±2σ (dash) indicative lines are shown.
The error average lines are close to zero, which
speaks to the validity of the regression models. How-
ever, the relatively high standard deviation (±1.6L/s,
1L, 10%), indicates that they are still not very accu-
rate. Generally, these plots show that the regression
models tend to over-estimate the spirometers mea-
HEALTHINF2015-InternationalConferenceonHealthInformatics
128
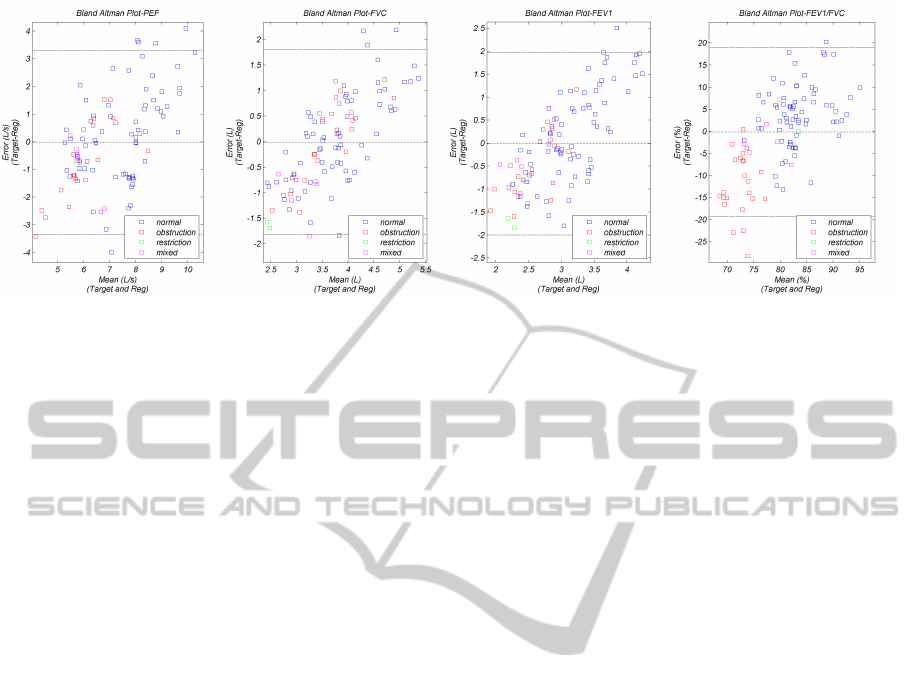
Figure 5: Bland Altman plots of the errors between the spirometer target and the regressed values versus the mean between
the target and regressed values. The mean (dashdot) and ±2σ (dash) are also shown.
surements of the lower volume or flow samples.
There are a few outliers which present around or
over 100% error, particularly on the PEF results. This
could be explained considering that the PEF measure-
ment is, essentially, the global maximum of an enve-
lope, which is highly dependent of both audio and en-
velope filtering methods. On the other hand, the PEF
is a cooperation dependent measurement and may in-
duce error on the learning models. Concerning the
volume dependent measurements, FEV
1
and FVC,
the outliers comprise the lung restriction class sam-
ples, that are characterized by lower target volumes,
which are clearly over-estimated.
7 LIMITATIONS AND FUTURE
WORK
7.1 Limitations
This project presented some issues concerning data
collection that, once overcome, should enhance the
learning models’ performance and, consequently, the
results.
A great portion of the recordings was gathered on
a relatively fast paced clinical study where patients
had to perform several respiration maneuvers before
recording to the smartphone. This could have reduced
the patient’s cooperation level due to fatigue. On the
other hand, the forced expiration maneuver itself is
difficult to perform, specially when concerning these
recordings where no mouthpiece was used. These
factors also contributed to the reduced yield of prop-
erly executed recordings. The small dataset with little
intra-patient samples is most likely the cause of the
regression errors of over 20%.
Additionally, since the spirometer and smartphone
maneuvers were made separately there is no com-
pletely reliable ground truth.
7.2 Future Work
Further study of this technology is needed and some
key features and experiments are proposed. First,
some relevant combinations of methods were left
untested and, provided additional data is gathered,
would be interesting to evaluate. Second, it would be
relevant to devise an algorithm to automatically detect
poorly executed FEMs. Finally, an application based
on the proposed architecture should be implemented.
8 CONCLUSION
The regression experiments enabled to reduce the 54
to 12 final envelopes, per recording, without a signif-
icant change on the results. The regression mean er-
ror for the less error prone parameters was 21%, 30%,
24% and 9.6%, for PEF, FEV
1
, FVC, and FEV
1
/FVC,
respectively. The classification models obtained an
error rate of 8% and 18%, for the TLE and MLE, re-
spectively. Also, the TLE model presented a precision
of 90.91% and recall of 98.59%. In conclusion, our
work demonstrated that smartphone spirometry and
automatic lung function triage is possible and the re-
sults encourage further development of the systems.
REFERENCES
Bland, J. M. and Altman, D. G. (1986). Statistical meth-
ods for assessing agreement between two methods of
clinical measurement. Lancet, 1(8476):307–10.
Breiman, L. (1996). Bagging predictors. Machine Learn-
ing, 24(2):123–140.
LungFunctionClassificationofSmartphoneRecordings-ComparisonofSignalProcessingandMachineLearning
CombinationSets
129

Breiman, L. (2001). Random forests. Machine learning,
45(1):5—-32.
Buntine, W. (1992). Learning classification trees. Statistics
and Computing, 2(2):63–73.
Freund, Y. and Schapire, R. E. (1996). Experiments with a
new boosting algorithm. In Saitta, L., editor, ICML,
pages 148–156, Bari, Italy. Morgan Kaufmann.
Larson, E. C., Goel, M., Boriello, G., Heltshe, S., Rosen-
feld, M., and Patel, S. N. (2012). SpiroSmart: Using
a Microphone to Measure Lung Function on a Mo-
bile Phone. In 14th ACM International Conference on
Ubiquitous Computing, page 10, Pittsburgh, Pennsyl-
vania, USA.
Liang, H., Lukkarinen, S., and Hartimo, I. (1997). Heart
sound segmentation algorithm based on heart sound
envelogram. In Computers in Cardiology 1997, vol-
ume 24, pages 105–108. IEEE.
Miller, M. R., Hankinson, J., Brusasco, V., Burgos, F.,
Casaburi, R., Coates, A., Crapo, R., Enright, P.,
van der Grinten, C. P. M., Gustafsson, P., Jensen, R.,
Johnson, D. C., MacIntyre, N., McKay, R., Navajas,
D., Pedersen, O. F., Pellegrino, R., Viegi, G., and
Wanger, J. (2005). Standardisation of spirometry. The
European respiratory journal, 26(2):319–38.
Pierce, R. (2005). Spirometry: an essential clinical mea-
surement. Australian family physician, 34(7):535–9.
Russel, S. and Norvig, P. (2002). Artificial Intelligence: A
Modern Approach. Prentice Hall, 2nd edition.
Savitzky, A. and Golay, M. J. E. (1964). Smoothing and
Differentiation of Data by Simplified Least Squares
Procedures. Analytical Chemistry, 36(8):1627–1639.
van Stein, B. (2013). A Mobile Smart Care platform
Home spirometry by using the smartphone micro-
phone. Master’s thesis, Leiden University, Leiden,
The Netherlands.
Vapnik, V. N. (1999). An overview of statistical learn-
ing theory. IEEE transactions on neural networks /
a publication of the IEEE Neural Networks Council,
10(5):988–99.
Wakita, H. (1973). Direct estimation of the vocal tract
shape by inverse filtering of acoustic speech wave-
forms. Audio and Electroacoustics, IEEE Transac-
tions on, 21(5):417–427.
World Health Organization (2013a).
Asthma: Fact sheet N307.
http://www.who.int/mediacentre/factsheets/fs307/en/
. Accessed: 26-06-2014.
World Health Organization (2013b). Chronic obstruc-
tive pulmonary disease (COPD): Fact sheet N315.
http://www.who.int/mediacentre/factsheets/fs315/en/
. Accessed: 26-06-2014.
Xu, W., Huang, M.-c., Liu, J. J., Ren, F., Shen, X., Liu,
X., and Sarrafzadeh, M. (2013). mCOPD. In Pro-
ceedings of the 6th International Conference on Per-
vasive Technologies Related to Assistive Environments
- PETRA ’13, PETRA ’13, pages 1–8, New York, New
York, USA. ACM Press.
HEALTHINF2015-InternationalConferenceonHealthInformatics
130
