Computational Investigation of Adaptive Deep Brain Stimulation
Christopher Y. Thang and Paul A. Meehan
School of Mechanical & Mining Engineering, The University of Queensland, Brisbane, Australia
Keywords: Closed-loop, Neural Feedback, Adaptive Deep Brain Stimulation, Parkinson’s Disease.
Abstract: Deep Brain Stimulation of the sub-thalamic nucleus (STN) has been proven to be effective at reducing
symptoms of patients with Parkinson’s disease (PD). Currently an implanted pulse generator provides
chronic electrical stimulation to the STN via an electrode and the stimulation parameters are chosen
heuristically. Closed-loop Deep Brain Stimulation (DBS) has been proposed as an improvement to this,
utilising neural signal feedback to select stimulation parameters, adjust the duration of stimulation and
achieve better patient outcomes more efficiently. In this research, potential neural feedback signals were
investigated using a computational simulation of the basal ganglia. It was found that the interspike-interval
in the globus pallidus externus provided a possible metric for ‘on’ and ‘off’ states in Parkinson’s disease.
This parameter was subsequently implemented as neural feedback in an adaptive closed-loop DBS
simulation and was shown to be effective. In particular, the thalamic relaying capability was evaluated using
an Error Index (EI) and the adaptive DBS was found to reduce the EI to 2%, which compared with 20% for
the PD case without DBS. This was achieved using 58% of the stimulation time used during continuous
DBS, indicating a large reduction in DBS energy requirements. This selection and implementation of a
potential neural feedback parameter will assist in developing improved implanted DBS pulse generators.
1 INTRODUCTION
Deep Brain Stimulation (DBS) has proven to be an
effective method for relieving the symptoms of
patients suffering from Parkinson’s disease (PD),
Essential Tremor (ET), dystonia (DT) and other
neurological conditions. During the procedure,
electrodes are inserted into targeted regions of the
basal ganglia (Fig. 1) and connected to an Implanted
Pulse Generator (IPG) positioned subcutaneously
below the clavicle (Coyne, Silburn et al. 2006).
Currently the stimulation parameters for DBS are
chosen heuristically, requiring periodic post-
operative programming sessions to determine the
optimum settings for symptom reduction for 6
months (Marjama-Lyons and Okun 2014). Neural
plasticity effects, progression of the neurological
disease, patient activity states and changes in the
medication may all lead to changing stimulation
requirements over time.
Closed-loop DBS has been proposed as an
alternative to chronic open-loop DBS, utilising
neural feedback signals to regulate the stimulation
parameters. By sensing symptoms and activating
stimulation when it is required, it is anticipated that
the power consumption of the IPG may be reduced,
symptom reduction may be improved and side-
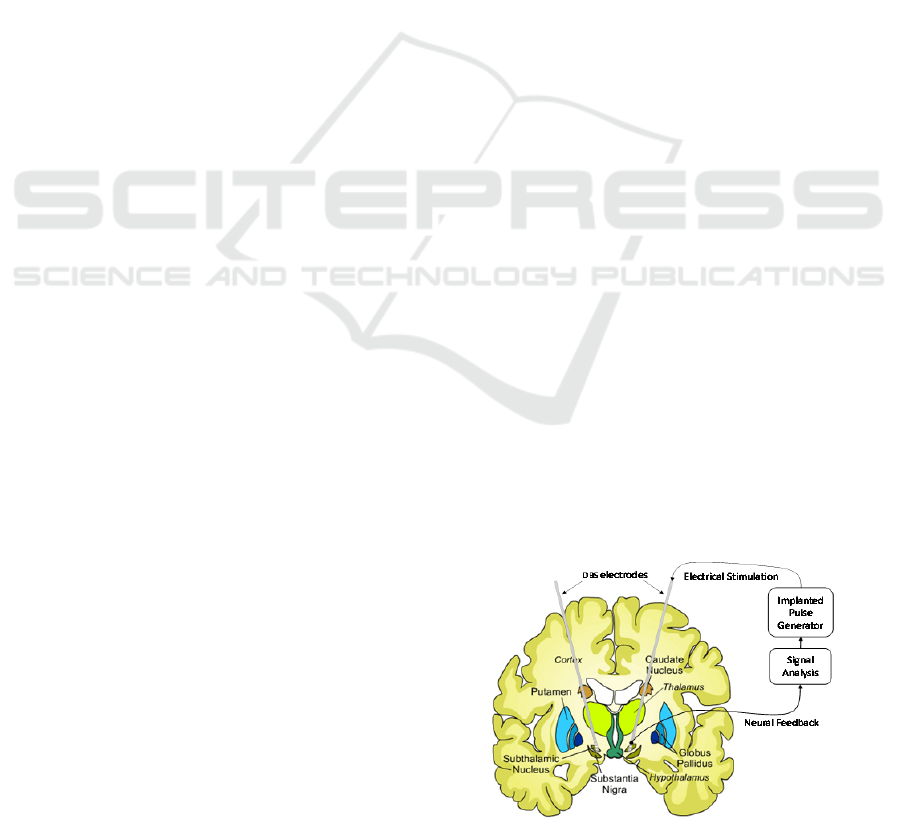
effects minimised. Figure 1 is a diagram of this
closed-loop DBS concept with neural feedback
being used to control the stimulation parameters.
Figure 1: Diagram of closed-loop deep brain stimulation
(Adapted from Huntington's Outreach Project for
Education 2010).
Multiple research groups are currently investigating
the feasibility of a system (Brain Institute, Utah;
Neuromedical Control Systems Lab, John Hopkins
University) and recently closed-loop DBS has been
66
Y. Thang C. and A. Meehan P..
Computational Investigation of Adaptive Deep Brain Stimulation.
DOI: 10.5220/0005212400660075
In Proceedings of the International Conference on Bio-inspired Systems and Signal Processing (BIOSIGNALS-2015), pages 66-75
ISBN: 978-989-758-069-7
Copyright
c
2015 SCITEPRESS (Science and Technology Publications, Lda.)
trialled in patients (Little, FitzGerald et al. 2013).
Prior to this, research has primarily been performed
on primates or computational models. Carron et al.
summarises the current closed-loop control
approaches as delayed and multi-site stimulation;
optimal control; proportional integral derivative
control and adaptive stimulation (Carron, Chaillet et
al. 2013). This work will focus on the latter control
strategy.
A major challenge thus far has been determining
a suitable neural feedback parameter that will
characterise the severity of PD along with
progression for the disease. Initial research has been
conducted, testing the non-markovity spectrum as a
neural measure however this work was focused on
measuring linguistic response (Meehan, Bellette et
al. 2011). It has previously been shown that Local
Field Potential (LFP) recordings from the sub-
thalamic nucleus (STN) show beta oscillations (8-35
Hz) in the PD state (Kühn, Kupsch et al. 2006,
Kühn, Hariz et al. 2008). Recently, Little et al. went
on further to successfully use this parameter as
feedback in a clinical trial of adaptive DBS. Results
showed a reduction in Unified Parkinson’s Disease
Rating Scale (UPDRS) motor scores by 27% in
blinded assessment, when compared with continuous
DBS (Little, FitzGerald et al. 2013). This new
clinical research testing faces many difficulties and
limitations that may be overcome with an efficient,
validated computational model. Hence the present
research aims to investigate and develop adaptive
DBS in a computational environment to better
understand the underlying neural mechanisms
associated with this method of control.
This research focuses on the identification of an
effective feedback parameter for closed-loop DBS
and quantifying the feasibility of using the parameter
in an adaptive DBS feedback system. A
computational model of the basal ganglia based on
the Rubin-Terman model (Rubin & Terman, 2004),
is used to simulate DBS for PD in the STN (So,
Kent et al. 2012). Neural output is then processed
and feedback parameters for PD are investigated. In
particular, the interspike interval is subsequently
implemented as neural feedback in an adaptive
closed-loop DBS simulation and its effectiveness
quantified. It is expected that demonstrating the
feasibility of closed-loop DBS for PD will provide a
basis for future investigations into more efficient and
effective systems for the treatment of PD and other
neurological conditions.
2 METHODS
This research builds upon a well-developed model of
the basal ganglia to develop an adaptive DBS
simulation. The existing basal ganglia model is first
presented, along with simulation parameters. This is
followed by details of two signal analysis methods
used to determine feedback parameters. A third
signal analysis method is also presented which will
be used to characterise the effectiveness of DBS.
2.1 Basal Ganglia Model
The basal ganglia (BG) is involved in the signal
processing of a range of neural functions including
voluntary motor movement, learning, cognition and
emotion. In the BG, information is transmitted
between nuclei via inhibitory and excitatory
projections. Under the canonical model of BG motor
loops, these projections form direct and indirect
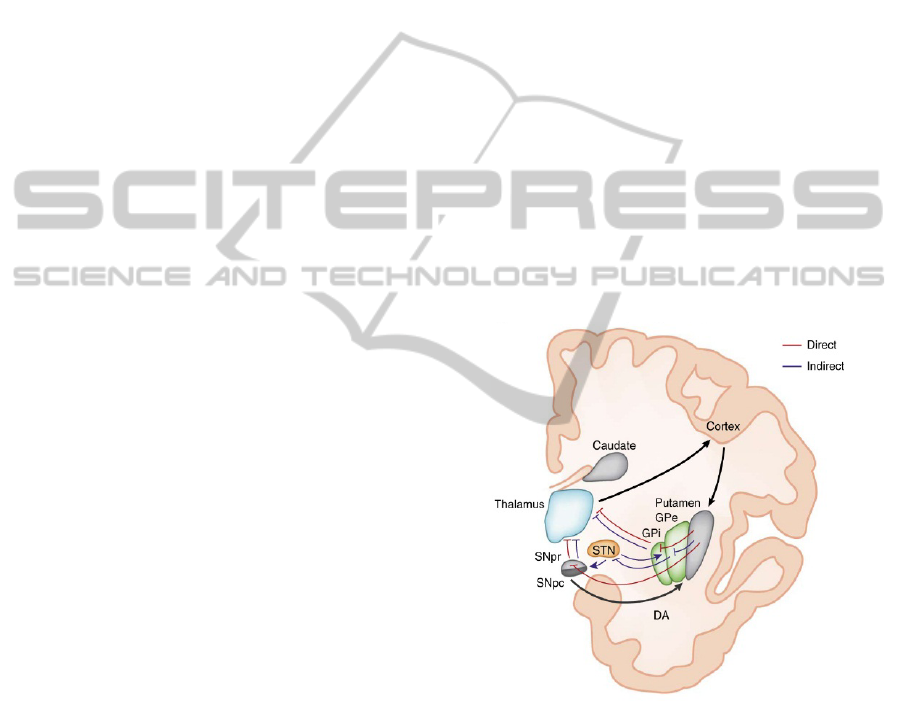
pathways through the BG. Figure 2 shows these
pathways and synaptic connections on a cross-
section of the BG.
Figure 2: Diagram of the indirect (blue) and direct (red)
pathways through the basal ganglia with excitatory and
inhibitory connections represented with arrows and flat-
ends respectively (Calabresi, Picconi et al. 2014).
In Figure 2, excitation of the direct pathway from
the cortex has the effect of exciting the putamen,
inhibiting the globus pallidus internus (GPi) and
consequently disinhibition of the thalamus, resulting
in ease of firing. Conversely, excitation of the
indirect pathway from the cerebral cortex results in
excitation of the putamen and consequently
inhibition of the globus pallidus externus (GPe).
This in turn leads to disinhibition of the sub-
ComputationalInvestigationofAdaptiveDeepBrainStimulation
67
thalamic nucleus (STN), excitation of the globus
pallidus internus (GPi) and inhibition of the
thalamus. When functioning correctly these
competing pathways balance so that the thalamus
operates correctly. A review of indirect/direct model
suggests that it is still the most plausible BG model,
although the possible role of pathway interactions
must be revised in light of recent experimental work
(Calabresi, Picconi et al. 2014).
An existing computational model of the BG,
developed by So et al., was used to simulate neural
output (So, Kent et al. 2012). This model is based on
the Rubin-Terman model (Rubin and Terman, 2004)
and it is a simplified model of the BG with
components of the classical indirect and direct
model. The excitatory and inhibitory synaptic
connections of the computational BG model are
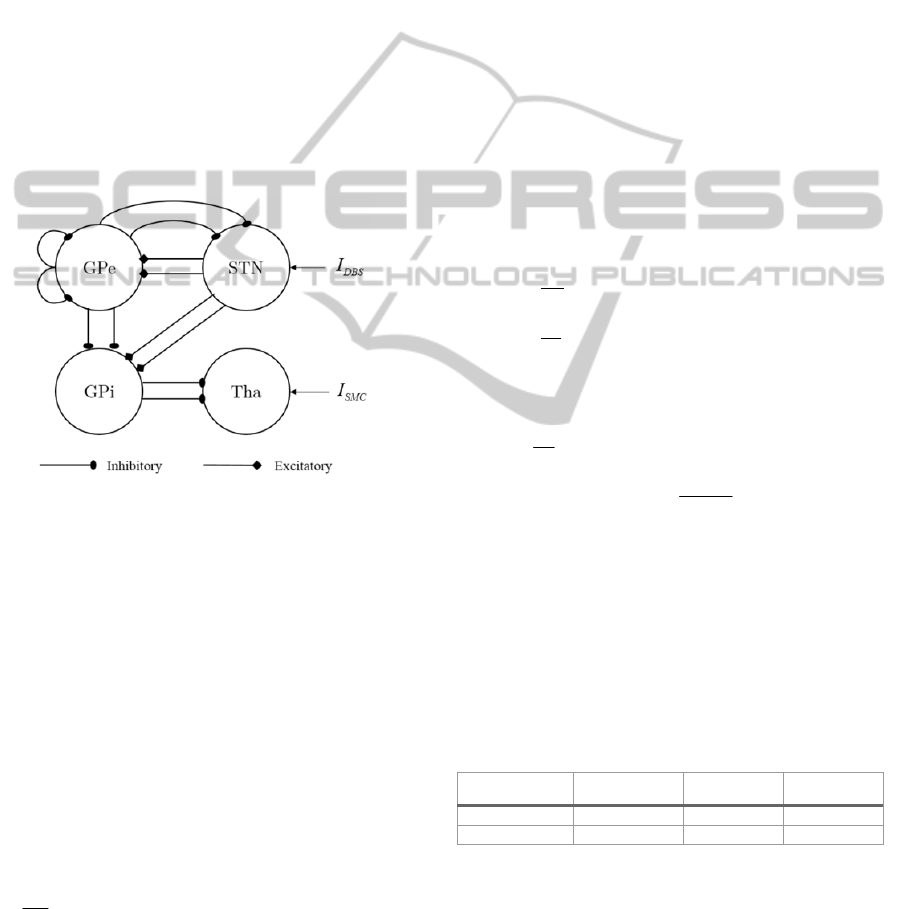
summarised in Figure 3.
Figure 3: Excitatory and inhibitory synaptic connections
used in the Basal Ganglia model.
In this model only the subcortical-thalamic region
(Tha), subthalamic nucleus (STN), globus pallidus
externus (GPe) and globus pallidus internus (GPi)
are modelled. STN neurons are modelled with
excitatory synapses to two GPe and GPi neurons;
GPe neurons inhibit two STN, GPe and GPi neurons
and each GPi neuron inhibits a Tha neuron. The
DBS stimulation is applied to the STN and
sensorimotor excitatory stimuli is inputted to the
Tha.
The individual neuron membrane potentials were
modelled using single-compartment conductance-
based biophysical models of the form (Terman,
Rubin et al. 2002, Rubin and Terman 2004),
.
m L Na K T Ca ahp in
CIIIIIIII
dV
dt
b
ab-
=- - - - - - - +
(1)
In (1), C
m
is the membrane capacitance; V
β
is the
membrane potential; I
L
,
I
Na
, I
K
,
I
T
,
I
Ca
and
I
ahp
are the
leak, sodium, potassium, low-threshold calcium,
calcium and afterhyperpolarization currents
respectively. Like most conductance based models,
each of these currents is controlled via a time variant
channel activation equation. Depending on the
nuclei, the total cell current is a combination of these
along with any current inputs, I
in
which may include
DBS, constant bias currents and sensorimotor input.
The complete equations and model parameters used
in this model are available in So et al. Synaptic
currents I
α-β
between neurons are represented as
follows where α is a pre-synaptic and β is a post-
synaptic neuron:
.
j
j
IgVE S
ab ab a ab a
é
ù
=-
ëû
å
(2)
In (2),
→
is the maximal synaptic conductance
and E
α-β
is the synaptic reversal potential.
The gating
of neurotransmitter receptors, S, varies from 0 to 1
and are described using an average response model.
For STN and GPi efferents, a second order alpha
synapse was used, where u(t) = 1 if the pre-synaptic
cell spikes and is otherwise 0:
0.234 ( ) 0.4 0.04 .
dS
z
dt
dz
ut z S
dt
(3)
The remaining connections were modelled using
first order alpha synapses of the form:
2 1 20 0.04
57
1/ 1 exp .
2
dS
SH V S
dt
v
Hv
(4)
In the Parkinson’s disease state, the loss of
dopamine results in disinhibition of the GPi via the
direct pathway and increased inhibition of the GPe,
disinhibition of the STN and further increased
activity of the GPi via the indirect pathway. PD
states were simulated using a reduction in applied
currents to the STN, GPe and GPi as summarised in
Table 1 (So, Kent et al. 2012).
Table 1: Applied currents in PD and Healthy states.
Neural State
app STN
I
app GPe
I
app GPi
I
Healthy
33 µA/cm
2
20 µA/cm
2
21 µA/cm
Parkinson’s
23 µA/cm
2
7 µA/cm
2
15 µA/cm
2
This produced firing behaviour consistent with
humans, rodents and primates with PD (So, Kent et
al. 2012). The reduction in the GPe applied current
is the largest which corresponds with disinhibiting
the GPi and STN.
High-frequency DBS input into the STN was
modelled using the Heavyside step function, H,
BIOSIGNALS2015-InternationalConferenceonBio-inspiredSystemsandSignalProcessing
68

(sin(2 t)) 1 (sin(2 ( ))) ,
DBS DBS DBS DBS DBS
IiH f H ftppd
éù
=´-+
êú
ëû
(5)
where i
DBS
is the stimulation amplitude, f
DBS
is the
stimulation frequency and δ
DBS
is the pulse width.
Simulations were run in MATLAB (MATLAB 8.3,
The MathWorks Inc., Natick, MA, 2014). The
simulated time was 6000 ms, with 30 neurons per
nuclei, 130 Hz stimulation and a time-step of 0.01
ms using Euler’s forward difference method unless
otherwise indicated.
2.2 Signal Analysis
The interspike interval and synchrony measures are
presented in this section and will be applied to the
spike-trains from the BG model. The third measure,
Error Index, tests for relaying fidelity and will be
used to examine DBS effectiveness.
2.2.1 Interspike Interval
The Interspike Interval (ISI) is defined as the time
between subsequent action potentials of the spike
train. The mean ISI of a neuron is often calculated to
be,
1
1
,
n
i
i
ISI ISI
n
=
=
å
(6)
where n is the number of spikes and ISI
i
is the
interval between two spikes. Whilst regularly used
for leaky integrate and fire (LIF) models, it requires
individual spike train data for neurons. This is
suitable for computational models but difficult to
obtain from in-vitro microelectrode recordings
(MER), unless a single-unit MER is used. The
threshold for peak detection was set at -10 mV and
the average and standard deviation of the ISI was
then taken across all 30 neurons, for each nuclei.
This resulted in a dataset of approximately 2,000
spikes for the thalamic region to 14,000 spikes for
the GPi.
2.2.2 Synchrony
It has been proposed that in PD states, increased
synchrony occurs in the GPi and that synchrony is
reduced in the thalamic region (Rubin and Terman
2004). Golomb proposes the following measure for
neuronal synchrony χ (Golomb and Rinzel 1993):
2
2
2
1
() .
1
i
V
N
V
i
N
N
s
c
s
=
=
å
(7)
In (7) the variance of the total voltage is defined as,
2
22
1
m
0
() () ,
11
where ... and ( ) ( ).
m
V
t
t
T
N
i
t
i
Vt Vt
dt V t V t
TN
s
=
éù
=-
êú
ëû
==
å
ò
(8)
Similarly the variance of individual neurons is
defined as:
2
22
() () .
i
ii
V
t
t
Vt Vts
éù
=-
êú
ëû
(9)
It can be seen that the neuronal synchrony measure
relies on voltage data from a population of neurons
which is only readily obtained from computational
models. For completely asynchronous behaviour, it
is expected that the synchrony measure will decrease
as the number of neurons sampled is increased.
Otherwise, for synchronous and weakly
synchronised neurons, the degree of synchrony will
be constant for varying N.
2.2.3 Error Index
Rubin and Terman have proposed an Error Index
(EI) to characterise the relaying fidelity of the
thalamic region (Rubin and Terman 2004). The EI is
determined as,
()
1
,
misses false
EI E E
n
=+
åå
(10)
where n is the number of input stimuli, E is an error
from either a false positive or a miss. False positives
are defined as spikes occurring without stimulus and
multiple spikes in response to a single stimulus.
Misses are defined as a failure to respond within 10
ms of a stimulus. High EI values correspond with
poor thalamic relaying capability of sensorimotor
input. In this testing, the EI is evaluated over a
sample size of approximately 800 input stimuli. This
EI will be used to characterise the effectiveness of
adaptive DBS in maintaining relaying capacity in the
thalamic region of sensorimotor input and compared
with results for healthy, PD and continuous DBS
states.
3 RESULTS
In this section the signal analysis results are used to
determine an optimum neural feedback parameter.
After being selected, the parameter is then used as
neural feedback in an adaptive DBS simulation. The
effectiveness of the adaptive DBS is compared with
healthy, PD and continuous DBS states, using the
Error Index measure to test for thalamic fidelity.
ComputationalInvestigationofAdaptiveDeepBrainStimulation
69
3.1 Signal Analysis
Two signal analysis methods are presented here as
possible feedback parameters. The results from the
interspike interval analysis is shown first, followed
by Golomb’s synchrony measure.
3.1.1 Interspike Interval
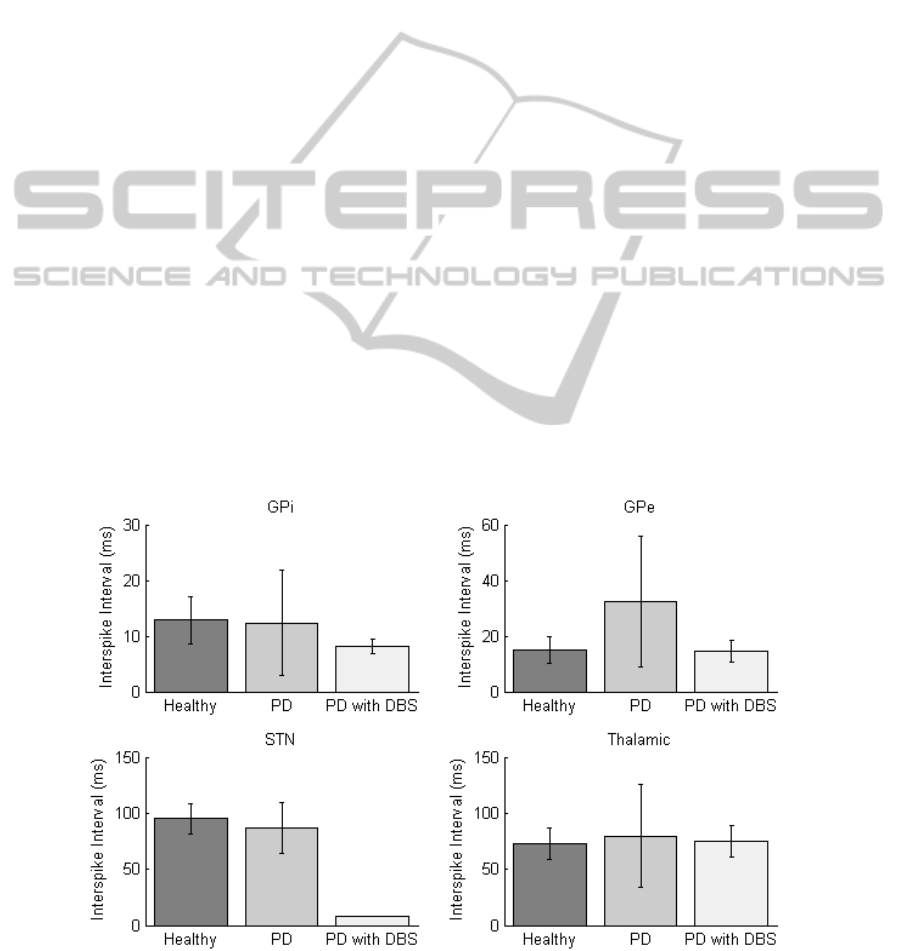
The Interspike Interval (ISI) results have been
plotted in Figure 4 for each of the nuclei in the
healthy, PD and PD with DBS states. When in the
PD state an increase in ISI can be observed in the
thalamic region due to misfiring. In the STN, the ISI
is reduced when DBS is applied since the neurons
are triggered to fire in unison at the 130 Hz
stimulation frequency. The GPi has a reduced ISI
when DBS is applied and the ISI in the GPe
increases for the PD state.
All four nuclei have an increase in ISI variance
(square of the standard deviation) for the PD states.
In particular, the standard deviation of GPe ISI
increases the most, rising by 380% in the PD state
(see error bars in Figure 4). This compares with a
corresponding 87% increase in ISI. This increase in
variance can be attributed to periodic periods of
spiking in the GPe instead of sustained firing. Once
DBS is applied, GPe ISI and standard deviation of
ISI return to similar values to the healthy state. ISI
variance in the thalamic region also exhibits similar
increases. This could be explained through BG loops
(Figure 3) as reduced activity in the GPe resulting in
disinhibition of the GPi and consequently increased
inhibition of the thalamus. This significant variation
in variance in the GPe shows potential as a possible
neural feedback parameter for ‘on’ and ‘off’ PD
states.
The response of the ISI was then tested for the
four nuclei when the DBS frequency is adjusted.
This was performed to determine if there were any
relationships between DBS frequency and ISI
measures. A batch script was run increasing the
frequency incrementally in intervals of 1 Hz from 0
to 120 Hz. The STN mean ISI was found to be
inversely proportional to frequency, as the STN
neurons are triggered to fire by the DBS.
In Figure 5, high fluctuating values are observed
in the ISI variance for thalamic neurons when
stimulation frequency is less than 52 Hz and
consistent low values are observed above 70 Hz.
From the results in Figure 4, it is assumed that low
variance corresponds with the DBS working
effectively and returning the BG to a healthy state.
In Figure 5, a spike in ISI and ISI variance occurs at
40-50 Hz suggesting that 40-50 Hz DBS may be
counter-effective. Similar trends were observed in
the GP region with stimulation appearing to be
ineffective for frequencies lower than 50 Hz. This is
consistent with the current understanding that low-
frequency DBS (<50 Hz) can be counter-effective
although the neural mechanisms for this are still
unknown (McConnell, So et al. 2012).
Figure 4: Mean Interspike Interval plotted for each of the four nuclei at healthy, Parkinson’s disease and DBS corrected
states with the standard deviation represented as error bars. Stimulation parameters are set at 130 Hz with pulse width of 0.6
ms and amplitude of 350 µA/cm
2
.
BIOSIGNALS2015-InternationalConferenceonBio-inspiredSystemsandSignalProcessing
70
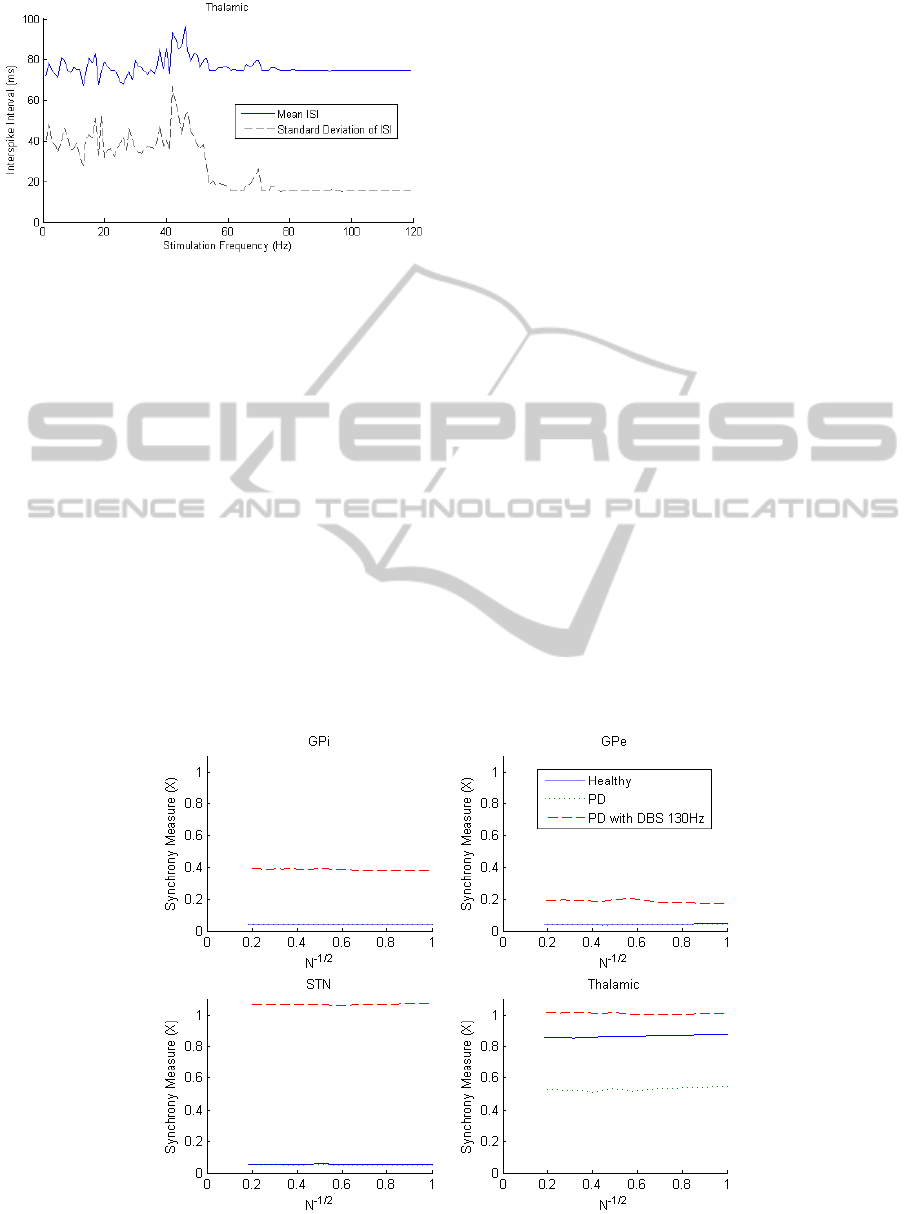
Figure 5: Thalamic ISI for varying DBS frequency.
The ineffectiveness of low-frequency DBS (<50 Hz)
and consistent effect at high frequencies (>80 Hz)
suggests that DBS frequency would not be an
effective stimulation control parameter.
3.1.2 Synchrony
The synchrony of the four nuclei in the healthy, PD
and PD with 130 Hz DBS states can be seen in
Figure 6. The measure has been plotted as a function
of N, the number of neurons included in the
measure. For completely asynchronous systems, it is
expected that the synchrony measure will go to zero
as N approaches large values. Clearly in this case
this testing is limited since only 30 neurons were
used in each nuclei.
Monotonic decreasing trends towards zero
should be observed if the system is asynchronous
and here it can be seen that the four nuclei are each
not completely asynchronous. The thalamic nuclei
has a 37% reduction in synchrony for the PD state
due to misfiring and GPi inhibition. After DBS is
applied, synchrony increases to value of 1,
indicating that sensorimotor input is being
transferred correctly. In all other regions, the DBS
results in increased degrees of synchrony, with the
greatest increase occurring in the STN where the
DBS is applied.
It appears that synchrony in the thalamic region
could be used as a feedback signal for the PD state,
although the DBS state appears to lead to a higher
degree of synchrony than the healthy state. It should
also be noted that this measure requires the
individual membrane potential data of a large
number of neurons, which is only obtainable in
computer simulations at this stage.
3.2 Adaptive DBS
An adaptive DBS scheme was implemented utilising
ISI variance in the GPe as a trigger for stimulation.
The motivation for this selection was based on the
largest rise between PD and healthy states. The
adaptive DBS stimulation threshold was set for a
GPe ISI standard deviation greater than 13 ms based
on data from the preceding 500 ms. This threshold
was chosen to be slightly above the variance of the
healthy state. A block diagram of this adaptive DBS
system is shown in Figure 7.
Figure 6: Synchrony for the four nuclei plotted as a function of the number of neurons included in the measure.
ComputationalInvestigationofAdaptiveDeepBrainStimulation
71
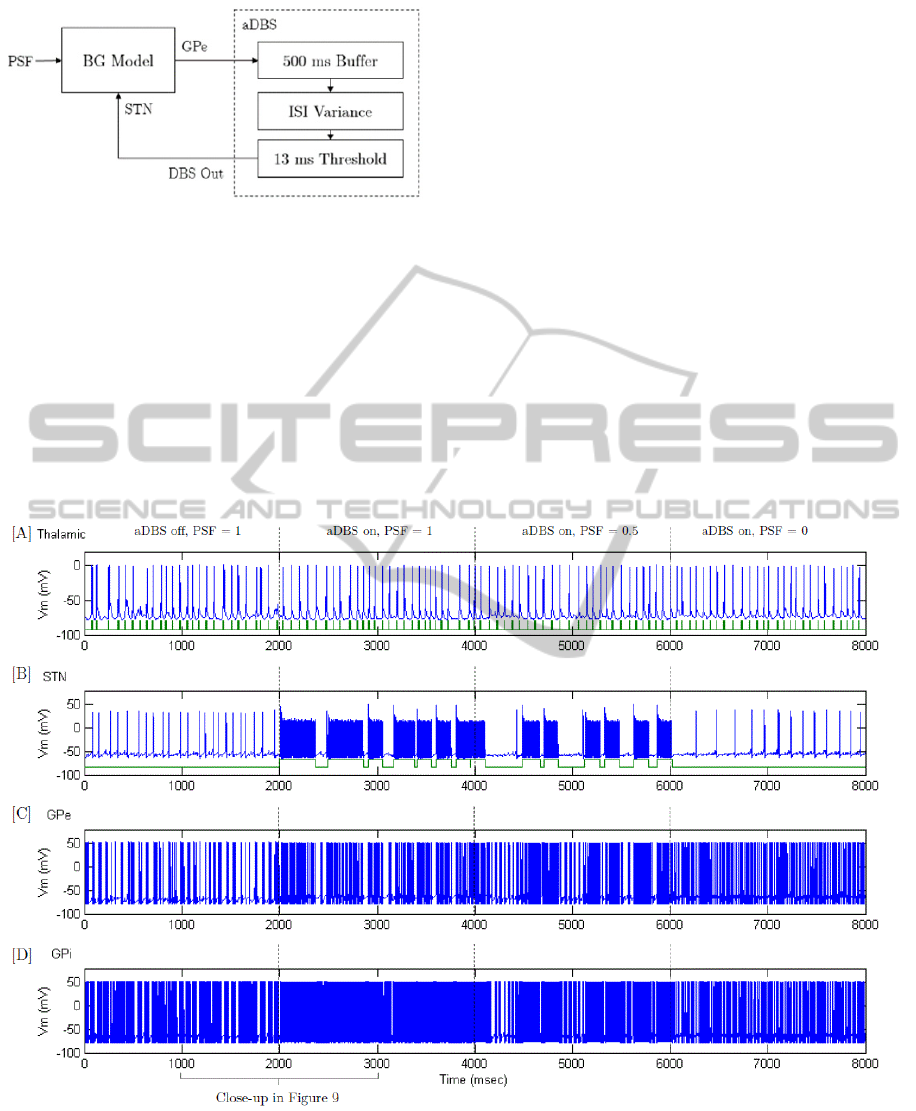
Figure 7: Block diagram of the adaptive DBS system.
Dynamic Parkinson’s disease conditions were
created by applying a stepped PD severity input. A
Parkinson’s Severity Factor (PSF) on a scale of 0-1
is used to adjust the PD severity and the applied
current in the STN, GPe and GPi was modified as
follows:
.
app PD base PD
IIPSFI
-
=- ´
(11)
The base current values I
base
in (11) were the healthy
applied currents and I
PD
was determined as the
difference between healthy and Parkinsonian states
in Table 1. Once stimulation is triggered, the aDBS
remains on for at least 150 ms before switching off.
The resulting spike trains in the basal ganglia can
be seen in Figure 8 for PD, with adaptive DBS using
GPe ISI variance as a feedback parameter to respond
to stepped PD severity input. For convenience, a
close-up of 1000-3000 ms is shown in Figure 9 so
that the effects of adaptive DBS may be compared
with the PD state. In Figure 8 [A], between 0 and
2000 ms, the BG is in the PD state. By comparing
the neuron spike train (above) with the sensorimotor
input (below), errors in the thalamic relaying
capability can be observed. These errors are
highlighted in Figure 9 [A], with two misfires
observed between 1000-2000 ms. At the same time
PD conditions are evident in Figure 8 [C] & [D]
with bursting firing behaviour in the GPe and GPi.
This is firing behaviour is seen clearly in Figure 9
[C] & [D], (left) with varying intervals between
bursts.
Figure 8: Adaptive DBS (aDBS) using variance of ISI from the GPe as a feedback signal. Between 0-2000 ms the
Parkinson’s severity is at a maximum and aDBS is not turned on; at 2000 ms the aDBS is initiated; between 4000-6000 ms
Parkinson’s severity is stepped down to 50% and at 6000 ms the severity is further reduced to 0%. [A] Spike-train from a
thalamic neuron (above) with sensorimotor input (below); [B] Spike-train from a sub-thalamic nucleus neuron (above) with
DBS stimulation times (below); [C] Spike-train from a globus pallidus externus neuron and [D] Spike-train from a globus
pallidus internus neuron.
BIOSIGNALS2015-InternationalConferenceonBio-inspiredSystemsandSignalProcessing
72
When adaptive DBS (aDBS) is initiated at 2000 ms,
the STN stimulation triggers periodically to maintain
consistent firing in the GPe as seen in Figure 8, [B].
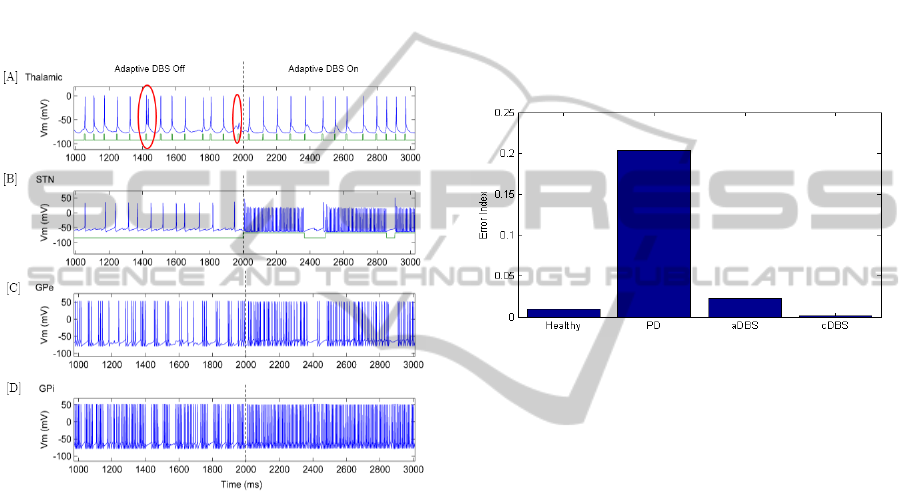
Figure 9 shows a close-up of this transition for
thalamic, STN, GPe and GPi neurons. It can be seen
in Figure 9 [B], (right) that the application of
stimulation to the STN triggers high-frequency STN
firing and restores thalamic throughput capability in
Figure 9 [A], (right). The short periods where the
aDBS switches off stimulation does not appear to
lead to errors in the thalamic relaying of
sensorimotor input.
Figure 9: The transition from adaptive DBS being ‘off’ to
‘on’ for an [A] thalamic, [B] sub-thalamic nucleus, [C]
globus pallidus externus and [D] globus pallidus internus
neuron; misfires in the thalamic region are circled in red.
In Figure 9 [C], when aDBS control is initiated the
GPe firing rate is steady during periods when
stimulation is on. Once the standard deviation of the
GPe ISI is reduced below the threshold, the
stimulation switches off and the GPe returns to
bursting behaviour (e.g. 2370-2460 ms). If the
standard deviation of the GPe ISI exceeds the
threshold, stimulation is turned on again and this
‘on’ and ‘off’ cycle can be seen in Figure 8 [B] until
the Parkinson’s severity is lowered. The GPi does
not appear to be affected by the short periods where
the stimulation is switched off which suggests a
delayed response. The continuous firing of the GPi
during these short periods of no stimulation may be
an important factor in the success of the aDBS in
maintaining reliable thalamic throughput.
During 4000-6000 ms in Figure 8, the severity of
Parkinson’s is reduced to 50% and a reduction in
GPe bursting behaviour is observed in [C] due to the
increase in applied current. As a result, the period
between STN stimulation triggering in [B] increases
since there is less variance in the GPe ISI. This
reduction in stimulation ‘on’ time does not appear to
impact the thalamic relaying capability. Finally,
when healthy conditions are imposed from 6000 ms,
regular GPe firing is observed in Figure 8 [C] and
consequently the aDBS control scheme no longer
triggers stimulation. No bursting is observed in the
GPe or GPi and the thalamic neuron transmits the
sensorimotor input correctly.
Figure 10: Error Index results for healthy, Parkinson’s
disease (PD), PD with adaptive DBS and PD with
continuous DBS states.
The Error Index (EI) is used to determine the change
in thalamic relaying capability when adaptive DBS
and continuous DBS are applied. These results are
compared to healthy and PD states in Figure 10 for a
stepped PSF input identical to Figure 11, [A].
Figure 10 shows that adaptive DBS was
successful in reducing the EI from 20% to 2%. The
healthy state had an error index of 1% and the PD
with cDBS state had an EI of 0.2%. Although the
aDBS did not reduce the EI to the levels of cDBS,
occasional misfiring does occur in the healthy state
and this is most likely an acceptable result. The clear
advantage of aDBS here is that only 58% of
stimulation was used in comparison with the cDBS
system whilst achieving a 95% of the reduction
towards the healthy state. If further tuning of the
aDBS is performed along with the implementation
of more advanced control methods, it is possible that
healthy conditions could be achieved with
substantial power savings.
The effectiveness of adaptive DBS was further
quantified by investigating the change in the GPe ISI
standard deviation with respect to Parkinson’s
Severity Factor, as shown in Figure 10. A stepped
PSF input has been inputted to the simulation with
ComputationalInvestigationofAdaptiveDeepBrainStimulation
73
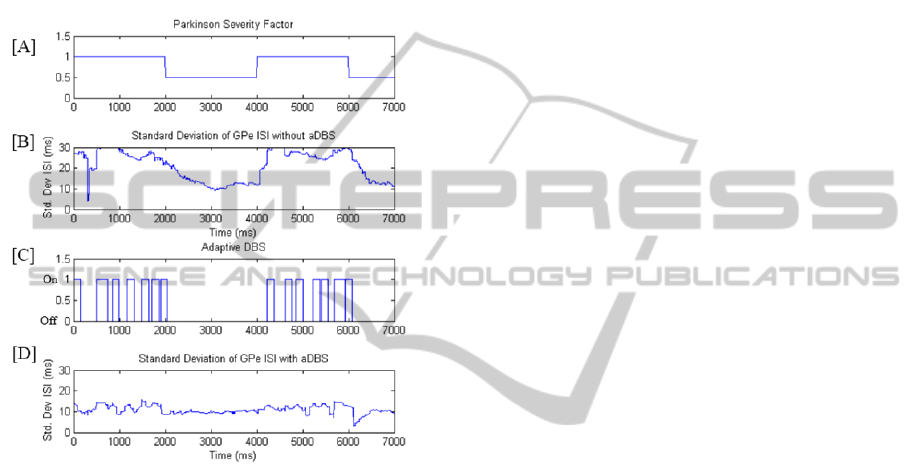
and without aDBS applied. When no DBS is applied
the standard deviation of the GPe ISI remains well
above the healthy threshold values for a maximum
PSF. It can be noted that the variance has a delayed
response to a stepped reduction to the PSF at 2000
ms. When aDBS is operating, the standard deviation
reaches the threshold regularly and triggers STN
stimulation. Comparing Figure 11 [C] and [D] to [B]
it is deduced that aDBS is effective in maintaining
healthy levels of variance in the GPe spike train.
Figure 11: [A] Stepped inputs of Parkinson’s Severity
Factor over time; [B] Standard deviation of GPe ISI
without aDBS being applied; [C] & [D] Adaptive DBS
with stimulation time (top) and corresponding Std. Dev of
GPe ISI (bottom).
4 CONCLUSIONS
In this investigation we examined the feasibility of
interspike interval (ISI) and synchrony as feedback
parameters for closed-loop DBS. Between the
healthy, Parkinson’s Disease (PD) and PD with DBS
states, an 87% increase in interspike interval was
observed in the globus pallidus externus (GPe). It is
hypothesised that this increase in interval between
spikes results in disinhibition of the globus pallidus
internus (GPi) which in turn inhibits the thalamus
and prevents the thalamus from relaying
sensorimotor input effectively. Underlying
rhythmicity in the GPi appears to further inhibit the
thalamus. In the PD state, the standard deviation of
GPe ISI was found to increase by 380% from the
healthy and PD with DBS states and thus
demonstrated potential as a feedback parameter.
Synchrony in the thalamic region was found to
drop by 37% from the healthy to PD state. It should
be noted that once DBS was initiated, the synchrony
measure in the thalamic region exceeded the healthy
levels. Other regions of the basal ganglia only
exhibited synchrony changes for the PD with DBS
state. Due to the practical difficulties associated with
obtaining multiple neuron recordings in a clinical
setting for the synchrony measure, the standard
deviation of ISI in the GPe was thus investigated
further in a closed-loop DBS simulation.
An adaptive DBS (aDBS) closed-loop control
scheme was used, where stimulation was turned on
or off depending on whether the GPe ISI Std. Dev
exceeded a threshold of 13 ms. The response of the
system was tested for stepped inputs for varying
Parkinson’s Severity Factors (PSF). The aDBS
scheme was successful in improving the thalamic
relaying capability, with an Error Index (EI) of 2%.
This compared with 1% for the healthy state and
20% for PD with no DBS. In this implementation,
the aDBS applied stimulation for 58% of the total
time during a stepped PSF input, indicating a
substantial reduction in DBS power consumption.
Challenges still remain between testing in the
computational environment and implanting this
technology in patients. Although clinical trials have
already successfully been performed by Little et al.
using beta-oscillations as a feedback parameter,
those trials were performed using a wired connection
between dedicated signal processing tools, laptop
and patient. The miniaturisation of these systems
into an IPG has yet to be achieved and this work
faces similar challenges with the signal analysis
tools. The accuracy of ISI interval sampling has also
not been tested in patients for this work although
single-cell microelectrode recordings may offer one
potential solution towards gathering the spike
interval data.
In this computational simulation, variance
(square of the standard deviation) in interspike
interval of the globus pallidus externus has
successfully been used as a feedback parameter for
aDBS. Research into more advanced control
methods such as Proportional-Integral control of
stimulation amplitude may offer further
opportunities to improve stimulation efficiency.
These alternate control methods will require tuning
to overcome the highly non-linear ‘all-or-none’
firing dynamic of neurons. Despite the widespread
use of such controllers in other applications, it is
possible that adaptive DBS may achieve a profile
BIOSIGNALS2015-InternationalConferenceonBio-inspiredSystemsandSignalProcessing
74

closer to the healthy state, due to the ‘all-or-none’
nature of the control method.
ACKNOWLEDGEMENTS
The authors would like to acknowledge Professor
Peter Silburn (Asia-Pacific Centre for
Neuromodulation) for his expertise in clinical
aspects of this research along with Professor Tipu
Aziz (Oxford Functional Neurosurgery) for his
research guidance.
REFERENCES
Calabresi, P., B. Picconi, A. Tozzi, V. Ghiglieri and M. Di
Filippo (2014). "Direct and indirect pathways of basal
ganglia: a critical reappraisal." Nat Neurosci 17(8):
1022-1030.
Carron, R., A. Chaillet, A. Filipchuk, W. Pasillas-Lépine
and C. Hammond (2013). "Closing the loop of deep
brain stimulation." Frontiers in Systems Neuroscience
7: 112.
Coyne, T., P. Silburn, R. Cook, P. Silberstein, G. Mellick,
F. Sinclair, G. Fracchia, D. Wasson and P. Stanwell
(2006). "Rapid subthalamic nucleus deep brain
stimulation lead placement utilising CT/MRI fusion,
microelectrode recording and test stimulation." Acta
Neurochirurgica Supplement 99: 49-50.
Golomb, D. and J. Rinzel (1993). "Dynamics of globally
coupled inhibitory neurons with heterogeneity."
Physical Review E 48(6): 4810-4814.
Huntington's Outreach Project for Education, S. U. (2010).
"HOPES Brain Tutorial - Basal Ganglia." Retrieved
14 November, 2014, from http://hopes
.stanford.edu/sites/hopes/files/f_ab18bslgang.gif.
Kühn, A. A., M. I. Hariz, W. Vandenberghe, B. Nuttin, P.
Brown, F. Kempf, C. Brücke, L. Gaynor Doyle, I.
Martinez-Torres, A. Pogosyan, T. Trottenberg, A.
Kupsch, G.-H. Schneider, Neurokirurgi, f. Medicinsk,
n. Farmakologi och klinisk and u. Umeå (2008).
"High-frequency stimulation of the subthalamic
nucleus suppresses oscillatory beta activity in patients
with Parkinson's disease in parallel with improvement
in motor performance." The Journal of Neuroscience
28(24): 6165-6173.
Kühn, A. A., A. Kupsch, G. H. Schneider and P. Brown
(2006). "Reduction in subthalamic 8–35 Hz oscillatory
activity correlates with clinical improvement in
Parkinson's disease." European Journal of
Neuroscience 23(7): 1956-1960.
Little, S., J. FitzGerald, A. L. Green, T. Z. Aziz, P. Brown,
A. Pogosyan, S. Neal, B. Zavala, L. Zrinzo, M. Hariz,
T. Foltynie, P. Limousin and K. Ashkan (2013).
"Adaptive deep brain stimulation in advanced
Parkinson disease." Annals of Neurology 74(3): 449-
457.
Marjama-Lyons, J. and M. Okun (2014). Parkinson's
Disease: Guide to Deep Brain Stimulation Therapy,
National Parkinson Foundation.
McConnell, G. C., R. Q. So, J. D. Hilliard, P. Lopomo and
W. M. Grill (2012). "Effective deep brain stimulation
suppresses low-frequency network oscillations in the
basal ganglia by regularizing neural firing patterns."
The Journal of neuroscience : the official journal of
the Society for Neuroscience 32(45): 15657-15668.
Meehan, P. A., P. A. Bellette, A. P. Bradley, J. E. Castner,
H. J. Chenery, D. A. Copland, J. D. Varghese, T.
Coyne and P. A. Silburn (2011). Investigation of the
non-markovity spectrum as a cognitive processing
measure of deep brain microelectrode recordings.
Biosignals 2011. Rome, Italy, SciTePress: 144-150.
Rubin, J. E. and D. Terman (2004). "High frequency
stimulation of the subthalamic nucleus eliminates
pathological thalamic rhythmicity in a computational
model." Journal of Computational Neuroscience 16(3):
211-235.
So, R. Q., A. R. Kent and W. M. Grill (2012). "Relative
contributions of local cell and passing fiber activation
and silencing to changes in thalamic fidelity during
deep brain stimulation and lesioning: a computational
modeling study." Journal of Computational
Neuroscience 32(3): 499-519.
Terman, D., J. E. Rubin, A. C. Yew and C. J. Wilson
(2002). "Activity patterns in a model for the
subthalamopallidal network of the basal ganglia." The
Journal of Neuroscience 22(7): 2963-2976.
ComputationalInvestigationofAdaptiveDeepBrainStimulation
75
