
COPD and Urban Air Pollution
GIS Based Spatial Pattern and the Geostatistical Analysis of Izmir
Cigdem Tarhan
1
and Nur Sinem Ozcan
2
1
Department of Management Information Systems, Dokuz Eylul University, Buca, Izmir, Turkey
2
Department of City and Regional Planning, Dokuz Eylul University, Buca, Izmir, Turkey
Keywords: Air Pollution, COPD, Environmental Health, GIS based Spatial Pattern, Multivariate Regression.
Abstract: In Turkey, starting from the 1950’s air pollution has been increasing because of rapid population increase,
rapid urbanization and industrialization. These cause intense energy usage in settlement areas and this
brings some problems in environmental health. The aim of the study is the examination of whether there is
any statistical relationship between the level of air pollution with the number of COPD cases and incidence
between 2006 and 2010 in Izmir City Center. The study area has six districts of Izmir City Center: Konak,
Bornova, Buca, Karsiyaka, Cigli and Balcova. There are in total 89,776 COPD cases between 2006 and
2010. The spatial pattern of these cases is mapped via the GIS environment. Then, multivariate linear
regression analysis is performed in the study. Additionally, the questionnaire was realized with 25 COPD
inpatients in Dr.S.Seren Chest Diseases Hospital in Izmir in March - April 2014. The results show that there
is a significant and positive relationship between the level of air pollution (PM and SO
2
) and the number of
COPD cases and incidence. In general, the increasing of the level of air pollutant and population cause an
increase in the number of COPD cases and incidence. It is observed that the level of air quality in
Karsiyaka, Bornova and Konak districts is lower than and incidence rates are higher than the other case
districts. According to questionnaire results, there is a significant relationship between the inpatients’ age
and their period of smoking. Also, there are significant relationships among the diagnosis, sex, job, risk
factor, genetic predisposition, smoking habits, environment lived in and heating preferences.
1 INTRODUCTION
Environment is quite important for human health. It
has been stated that there have been various agents
which can affect human health either directly or
indirectly (The Ministry of Health of Turkey, 2008).
Conducted studies generally show inequalities in
health are emerging according to socioeconomic
status, education level, geographic location, gender,
ethnic groups and age groups. The World Health
Organization Regional Office for Europe (WHO/
EURO) has started a major new project known as
“Healthy Cities” at the local level to adopt a policy
leading to ‘Health for all’. Izmir Metropolitan
Municipality also applied to be a member of Turkish
Healthy Cities Association on Jun 02, 2006 by
Resolution of the City Council. Within the studies of
healthy cities and environmental impacts on health,
some diseases among populations become noticeable
such as chronic obstructive pulmonary disease
(COPD).
COPD is defined as a clinical condition
characterized by chronic obstructive disease and
progressed on the basis of chronic bronchitis and/or
emphysema (Koç et al., 2002). The cause of COPD
in the literature is classified as smoking, air
pollution, viral respiratory infections during
childhood, organic and inorganic particles around
people and inherited changes (URL1, 2014). In
epidemiological studies, it has been determined that
air pollution causes an increase in total mortality,
and morbidity of respiratory diseases in adults and
respiratory symptoms in children. Especially, it has
been proved that the intensity of air pollutants
(sulfur dioxide (SO
2
) and particulate matter (PM))
causes COPD cases to increase (Koç et al., 2002;
Chen et al., 2000; Zanobetti et al., 2000).
In Turkey, from the 1950’s to today air pollution
has been increasing because of rapid population
growth, rapid urbanization and industrialization
rates. The increasing use of fossil fuels, unplanned
urbanization, inappropriate and inadequate
223
Tarhan C. and Ozcan N..
COPD and Urban Air Pollution - GIS Based Spatial Pattern and the Geostatistical Analysis of Izmir.
DOI: 10.5220/0005160402230230
In Proceedings of the International Conference on Health Informatics (HEALTHINF-2015), pages 223-230
ISBN: 978-989-758-068-0
Copyright
c
2015 SCITEPRESS (Science and Technology Publications, Lda.)

combustion techniques, lack of green areas and
increase of motor vehicles cause a significant
increase in urban air pollution.
Urban air pollution is an inevitable component of
modern life especially in urban areas. Therefore, it
exposes a contradiction between the biological and
economic requirements of human beings. More than
half of the total population in Turkey are living in
the settlement areas classified as “cities” that have a
population greater than 10,000 people. The level of
air pollutants in the atmosphere has been increasing
continuously because of dense population in these
settlement areas, in total comprising 1% of the land
area of the country, and increasing demand of
quality of life standards (Müezzinoğlu, 2000;
İncecik, 1994; Godish, 1997).
The aim of the study is the examination of
whether there is any statistical relationship between
the level of air pollution (PM and SO
2
) with the
number of COPD cases and incidence in the years
2006-2010 in Izmir City Center. The study area is
Konak, Bornova, Buca, Karsiyaka, Cigli and
Balcova districts of Izmir City Center. In 2009,
Konak district has been divided as Konak and
Karabaglar, also Karsiyaka district has been divided
as Karsiyaka and Bayrakli. COPD cases have been
recorded in the districts of Konak and Karsiyaka
until 2009 and have been started being recorded in
the districts of Konak, Karabaglar, Bayrakli and
Karsiyaka. In this study, for 2009 and 2010 COPD
cases, Karabaglar cases have been counted in Konak
district and also Bayrakli cases have been counted in
Karsiyaka district. There are total 89,776 COPD
cases between 2006 and 2010 (The Ministry of
Health, Izmir Provincial Directorate of Health,
Department of Statistics, The Distribution of Patient
and Deaths by Gender, 2006-2010 Years). SPSS
software is used to perform statistical analysis and
ArcGIS is used to realize spatial analysis. Spatial
patterns of these cases are mapped via a GIS
environment. Multivariate regression analysis is
performed in the study.
2 LITERATURE
Environmental health studies are related to the
effects of environmental factors, such as air
pollution, on human health and the effective health
policies to handle their effects (Maantay and
McLafferty, 2011).
In the literature, there exist a lot of studies thet
the relationship and either positive or negative
influence between air quality and respiratory system.
These studies are differentiated in terms of the type
of disease. Generally, respiratory system related
diseases studies are performed by Tagil and
Mentese, 2012; Cengiz et al., 2013; Unsal et al.,
1999; Zhang et al., 2013; Darçın, 2013; Jerrett et al.,
2009; Dockery et al., 1993 and Wong et al., 2001.
Besides, some studies are performed just using
COPD cases by Chen et al., 2000; Zanobetti et al.,
2000; Faustini et al., 2012; Lingdren et al., 2009;
and Cinarka et al., 2011.
A GIS is used as a common tool to be equipped
with an electronic environment which links the
exposure model with the demographic, migration
and health data of the exposed population. The
integration of the model in a GIS together with
individual data and information from routine health
statistics proved its usefulness in demarking the
exposed population (Poulstrup and Hansen, 2004).
GISs have been applied in assessment of
accessibility to opportunities such as education,
employment, goods and services, recreation and
health care services in urban environments. Related
researches have examined the relationship between
urban life and health levels. Additionally, GIS
makes it possible to combine survey based data on
COPD studies at the individual level with spatial
objective data of the urban environment (Marans and
Stimson, 2011).
In Turkey, despite the past and ongoing research
and studies on spatial distribution of COPD and
other diseases from the point of view of
epidemiology, the amount of research is quite
limited compared to studies in developed countries
(Schikowski et al., 2005; Nuvolone et al., 2011).
3 THE STUDY AREA AND DATA
The study area has six districts of Izmir City Center:
Konak, Bornova, Buca, Karsiyaka, Cigli and
Balcova. There are in total 89,776 COPD cases
between 2006 and 2010. In 2009, Konak district has
been divided as Konak and Karabaglar. Also
Karsiyaka district has been divided as Karsiyaka and
Bayrakli. COPD cases have been recorded in the
districts of Konak and Karsiyaka until 2009, and
have been started being recorded in the districts of
Konak, Karabaglar, Bayrakli and Karsiyaka. In this
study, for 2009 and 2010 COPD cases, Karabaglar
cases have been counted in Konak district and also
Bayrakli cases have been counted in Karsiyaka
district. The study area is represented in Figure 1,
the distribution of the number of COPD cases
between 2006 and 2010 at district level is shown in
HEALTHINF2015-InternationalConferenceonHealthInformatics
224
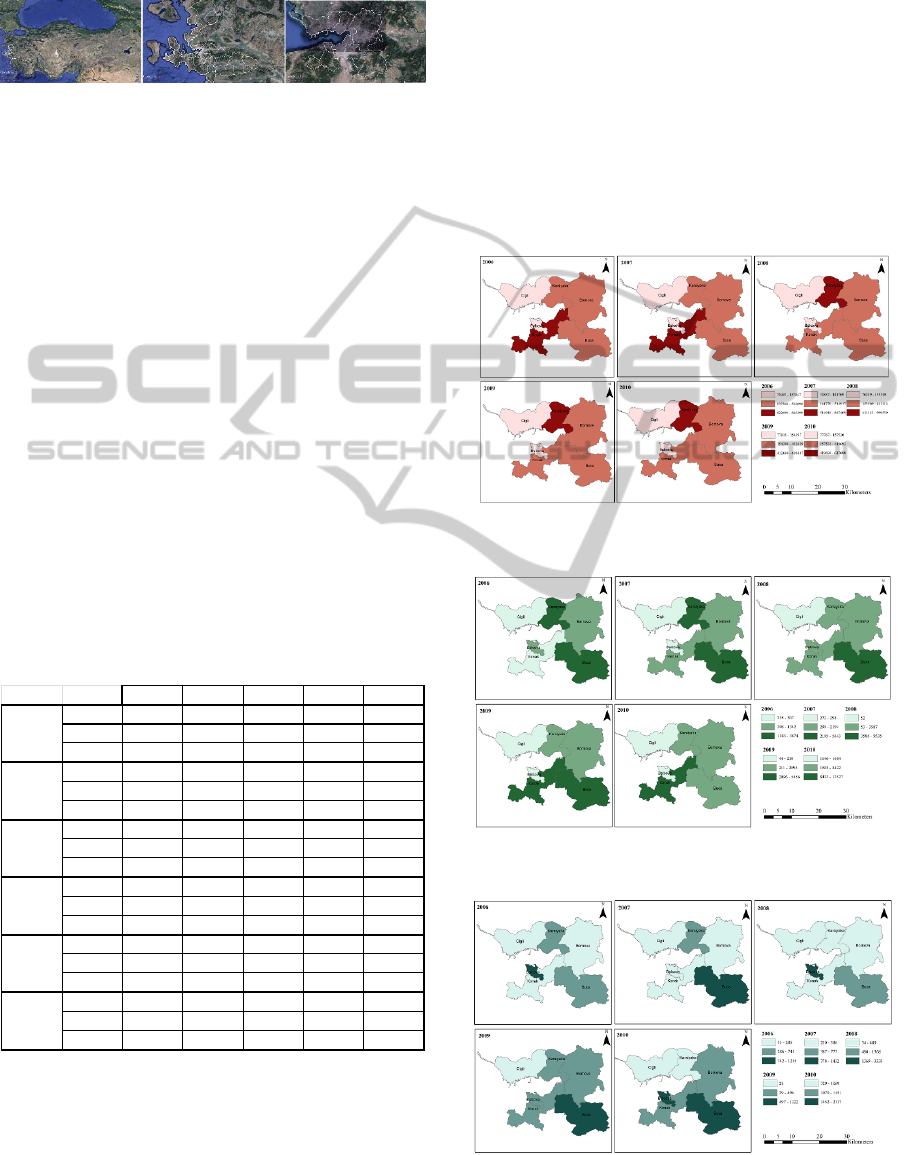
Table 1 and the spatial distribution of them
presented in Figure 3.
Figure 1: The Study Area (Turkey, Izmir, Districts of
Study Area) (Google Earth, 2014).
As seen in Table 1 and Figure 3, Konak, Buca,
Karsiyaka and Bornova districts have more intensive
COPD cases in 2006-2010 in Izmir Province. The
reason of this intensity can be explained by density
of population and motor vehicles in these districts,
also having more urban study areas than other
districts. Additionally, the main transportation axes
are in these districts; because of this, the level of air
quality is lower than the other districts.
In this study, the number of COPD cases are
related with the level of air quality. The level of air
quality is measured as air pollutants (PM and SO
2
)
and these measurements are shown in Table 2
(URL2, 2014). Additionally, the spatial distributions
of PM and SO
2
are presented in Figure 5 and Figure
6. In Table 2 and Figure 5, it is clearly observed that
the level of PM has the highest values in Karsiyaka,
Bornova, Konak and Balcova. As seen in Table 2
and Figure 6, the level of SO
2
has the highest values
in Konak, Karsiyaka and Bornova.
Table 1: Total population, COPD cases and COPD
incidence rate at district level (2006-2010).
Table 1 shows total population of the case districts
and COPD incidence rates. Additionally, Figure 2
and Figure 4 present these data spatially. As
presented in Table 1, the most intense districts are
Konak, Karsiyaka, Bornova and Buca in terms of
total population.
Also as shown in Table 1 and Figure 4, the
highest incidence rates are in Balcova, Buca,
Bornova and Karsiyaka. The difference between
total population and incidence rate is based on high
population density, but low COPD cases in districts.
The incidence rate is the number of new cases per
population at risk in a given time period, in this
study this rate represented per 100,000 persons. For
example, Konak has the most crowded district;
however its COPD incidence rate is lower than the
other districts in Izmir Province. Therefore, the
study considers both the number of COPD cases and
COPD incidence rates in statistical analysis.
Figure 2: The spatial distribution of population at district
level (2006-2010).
Figure 3: The spatial distribution of COPD cases at district
level (2006-2010).
Figure 4: The spatial distribution of COPD incidence at
district level (2006-2010).
2006 2007 2008 2009 2010
Population
470 645 470 211 392 631 402 453 412 275
Case
1 342 1 815 1 920 1 472 5 614
Inci de nce
285 386 489 366 1 362
Population
522 698 514 917 903 375 917 074 925 586
Case
3 874 4 003 2 478 2 095 6 746
Inci de nce
741 777 274 228 729
Population
376 189 393 934 404 472 412 639 419 693
Case
2 580 5 643 5 535 5 456 8 422
Inci de nce
686 1 432 1 368 1 322 2 007
Population
885 399 847 409 853 449 859 958 863 579
Case
307 2 194 3 587 4 268 12 527
Inci de nce
35 259 420 496 1 451
Population
75 497 74 837 76 219 77 915 77 767
Case
917 272 2 540 210 1 646
Inci de nce
1 215 363 3 333 270 2 117
Population
137 847 141 769 153 508 154 397 157 530
Case
235 298 52 44 1 684
Inci de nce
170 210 34 28 1 069
Bornova
Karsiyaka
Buca
Konak
Balcova
Cigli
COPDandUrbanAirPollution-GISBasedSpatialPatternandtheGeostatisticalAnalysisofIzmir
225
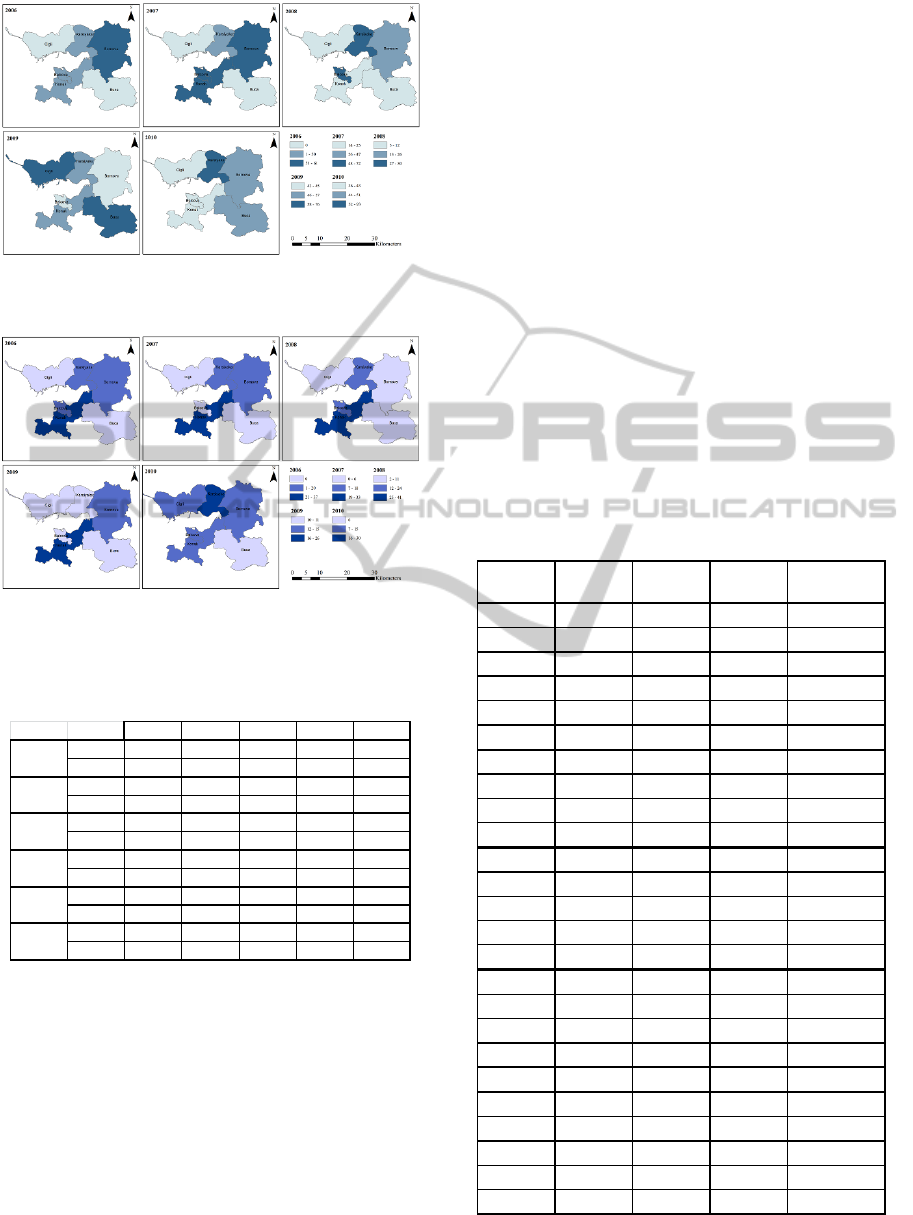
Figure 5: The spatial distribution of the level of PM at
district level (2006-2010).
Figure 6: The spatial distribution of the level of SO
2
at
district level (2006-2010).
Table 2: The levels of PM and SO
2
at district level (2006-
2010).
4 METHODOLOGY
Multivariate linear regression analysis is used in
order to measure the relationship between dependent
and independent variables. The number of COPD
cases and COPD incidence are dependent variables;
the level of air quality (PM and SO
2
) and total
population are independent variables in this study.
The independent variables are denoted as:
2006pm: PM value of 2006, 2007pm: PM value of
2007, 2008pm: PM value of 2008, 2009pm: PM
value of 2009, 2010pm: PM value of 2010, 2006so2:
SO
2
value of 2006, 2007so2: SO
2
value of 2007,
2008so2: SO
2
value of 2008, 2009so2: SO
2
value of
2009, 2010so2: SO
2
value of 2010, 2006tn: Total
population of 2006, 2007tn: Total population of
2007, 2008tn: Total population of 2008, 2009tn
Total population of 2009 and denoted 2010tn: Total
population of 2010.
The dependent variables are denoted as:
2006t: The number of COPD cases (2006), 2007t:
The number of COPD cases (2007), 2008t: The
number of COPD cases (2008), 2009t: The number
of COPD cases (2009), 2010t: The number of COPD
cases (2010), i2006: COPD incidence rate (2006),
i2007: COPD incidence rate (2007), i2008: COPD
incidence rate (2008), i2009: COPD incidence rate
(2009), and i2010: COPD incidence rate (2010).
Table 3 presents descriptive statistics of the
number of COPD cases, PM values, SO
2
values,
total population and COPD incidence rate.
Table 3: The descriptive statistics of parameters (2006-
2010) (n=6).
The number of COPD cases vary between 235
2006 2007 2008 2009 2010
PM 61 66 26 45 51
SO
2
15 12 11 15 15
PM 50 47 30 57 93
SO
2
20 18 24 11 30
PM0 25117651
SO
2
0 0 2116
PM407255436
SO
2
37 33 41 26 11
PM 49 59 29 43 43
SO
2
106201113
PM0 14126839
SO
2
0031014
Bornova
Karsiyaka
Buca
Konak
Balcova
Cigli
Variable Minimum Maximum Mean
Standard
Deviation
2006t
235 3 874 1 542.50 1 426.868
2007t
272 5 643 2 370.83 2 117.215
2008t
52 5 535 2 685.33 1 817.575
2009t
44 5 456 2 257.50 2 191.245
2010t
1 646 12 527 6 106.50 4 163.903
2006pm
0 61 33.33 26.666
2007pm
14 72 47.17 23.250
2008pm
5 30 18.83 10.759
2009pm
43 76 57.17 12.891
2010pm
36 93 52.17 20.923
2006so2
0 37 13.67 13.952
2007so2
0 33 11.50 12.645
2008so2
2 41 16.83 14.770
2009so2
10 26 14.00 6.132
2010so2
6 30 14.83 8.085
2006tn
75 497 885 399 411 379 293 078.197
2007tn
74 837 847 409 407 179 279 446.619
2008tn
76 219 903 375 463 942 346 449.822
2009tn
77 915 917 074 470 739 350 179.356
2010tn
77 767 925 586 476 072 352 019.613
i2006
35 1 215 522.00 440.987
i2007
210 1 432 571.17 466.671
i2008
34 3 333 986.33 1 235.714
i2009
28 1 322 451.67 453.720
i2010
729 2 117 1 455.83 534.356
HEALTHINF2015-InternationalConferenceonHealthInformatics
226

and 3,874 people, with a mean of 1,543 in 2006,
between 272 and 5,643, with a mean of 2,371 in
2007, between 52 and 5,535 people, with a mean of
2,685 in 2008, between 44 and 5,456 people, with a
mean of 2,258 in 2009 and between 1,646 and
12,527 people, with a mean of 6,107 in 2010. As
seen in Table 3, it is clearly observed that there is a
continuous increase in the number of COPD cases
between 2006 and 2010.
PM values vary between 0 and 61 µg/m
3
, with a
mean of 33.33 µg/m
3
in 2006, between 14 and 72
µg/m
3
, with a mean of 47.17 µg/m
3
in 2007, between
5 and 30 µg/m
3
, with a mean of 18.83 µg/m
3
in
2008, between 43 and 76 µg/m
3
, with a mean of
57.17 µg/m
3
in 2009 and between 36 and 93 µg/m
3
,
with a mean of 52.17 µg/m
3
in 2010. As shown in
Table 3, although there is a slight decrease in PM
value in 2008, the PM value trend is increase
between 2006 and 2010.
SO
2
values vary between 0 and 37 µg/m
3
, with a
mean of 13.67 µg/m
3
in 2006, between 0 and 33
µg/m
3
, with a mean of 11.50 µg/m
3
in 2007, between
2 and 41 µg/m
3
, with a mean of 16.83 µg/m
3
in
2008, between 10 and 26 µg/m
3
, with a mean of
14.00 µg/m
3
in 2009, and between 6 and 30 µg/m
3
,
with a mean of 14.83 µg/m
3
in 2010. As seen in
Table 3, although there is a slight increase in SO
2
value in 2008, generally any significant increase or
decrease SO
2
value is not observable between 2006
and 2010.
The total population of districts vary between
75,497 and 885,399 people, with a mean of 411,379
in 2006, between 74,837 and 847,409 people, with a
mean of 407,180 in 2007, between 76,219 and
903,375 people, with a mean of 463,942 in 2008,
between 77,915 and 917,074 people, with a mean of
470,739 in 2009, and between 77,767 and 925,586
people, with a mean of 476,072 in 2010. As seen in
Table 3, there is a continuous increase in the total
population between 2006 and 2010.
COPD incidence rates vary between 35 and
1,215 people, with a mean of 522 in 2006, between
210 and 1,432 people, with a mean of 571 in 2007,
between 34 and 3,333 people, with a mean of 986 in
2008, between 28 and 1,322 people, with a mean of
452 in 2009, and between 729 and 2,117 people,
with a mean of 1,456 in 2010. As shown in Table 3,
COPD incidence rate increases approximately three
times from 2006 to 2010.
In Table 4 and 5, according to the results
surveyed a total of 25 patients diagnosed with
COPD are almost all men, the average age is 65 and
mainly work in very risky occupations (steam
earnings, weavers, etc.). Inpatients reside mostly in
Konak and Karabağlar Districts and the average
residence period varies between 10 – 55 years. The
time since diagnosis of COPD ranges from 1 to 3
years. The average one person in each household
was found to consume a daily average of 1.5 packs
of cigarettes and inpatients have been active smokers
approximately 39 years. Residents in the districts
mainly prefer heating type of wood – coal and air
conditioning and the average residence time is 38
years. While travelling patients mainly prefer public
transport and they often live in an open environment
of green areas, not industrial areas.
Table 4: The descriptive statistics of the questionnaire
(n=25).
Table 5: The frequency distribution of the questionnaire.
The results of the survey show that there is a
significant and positive relationship between the
ages of inpatients diagnosed with COPD.
Additionally, there is a significant relationship
between the inpatients’ age and their period of
smoking. Also, there are significant relationships
Variables Minimum Maximum Mean
Standard
Deviation
Age
45 85 65.04 10.964
Sex
1 2 1.92 0.277
Residence Period (year)
3 85 37.96 25.538
Occupation Risk
1 2 1.32 0.476
Smoking Habit (package)
0 3 1.56 0.154
Smoking Person in Residence
0 10 1.28 2.151
Smoking Habit (year)
0 65 39.12 2.666
Heating System at house (Coal)
0 1 0.52 0.510
Heating System at house (Natural Gas)
0 1 0.08 0.277
Heating System at house (AC)
0 1 0.36 0.490
Heating System at environment (Coal)
0 1 0.52 0.510
Heating System at environment (Natural Gas)
0 1 0.12 0.332
Heating System at environment (AC)
0 1 0.28 0.458
Travelling Preferences
1 3 1.60 0.707
Recreation Area Existing
0 1 0.52 0.510
Industrial Area Existing
0 1 0.16 0.374
Variables Value Fre
q
uenc
y
Percent
(
%
)
Residence
(
district
)
Konak 7 28
Karaba
ğ
lar 7 28
Othe
r
1 4
Residence Period
(y
ear
)
10 - 15 2 8
20 - 25 2 8
30 - 35 2 8
50 - 55 2 8
Othe
r
1 4
Occu
p
ation Risk
More Risk
y
17 68
Less Risk
y
8 32
Dia
g
nosis
(y
ear
)
1 10 40
2 2 8
3 3 12
Othe
r
1 4
Smokin
g
Habit
(y
ear
)
30 5 20
40 4 16
50 6 24
Othe
r
1 4
Travellin
g
Preferences
Public Trans
p
ort 13 52
Private Car 8 32
Othe
r
3 12
COPDandUrbanAirPollution-GISBasedSpatialPatternandtheGeostatisticalAnalysisofIzmir
227

among the diagnosis, sex, job, risk factor, genetic
predisposition, smoking habits, lived in environment
and heating preferences (natural gas) (p <0.05). On
the other hand, no significant relationship was
determined between the diagnosis of COPD and
preferred coal home and environment, smoking
period and residence period (p>0.05).
5 RESULTS AND DISCUSSION
Multivariate linear regression analysis is performed
in order to estimate the statistical relationship
between the independent (explanatory) and the
dependent variables.
The result of multivariate linear regression
analysis is interpreted on the basis of years. The
model summary, which is done by using the number
of COPD cases and independent variables (PM, SO
2
and total population) is presented in Table 6a-6b. In
Table 6a, the selected model explains about 63% of
the proportion of the variability in the dependent
variables in 2006 (R
2
=0.632); about 88% in 2007
(R
2
=0.882); about 67% in 2008 (R
2
=0.670); about
85% in 2009 (R
2
=0.850); and about 99% in 2010
(R
2
=0.988). In Table 6b, the relationship between
the dependent variable (the number of COPD cases)
and the independent variables (PM, SO
2
and total
population) is statistically significant at the 0.05
level (p<0.05). In other words, PM, SO
2
and total
population are found to be significant at the 0.05
level for the number of COPD cases.
In Table 8, according to the models’ parameter
estimations, the increasing trend of the level of air
quality (PM and SO
2
) and total population between
2007 and 2010 caused also an increase trend for the
number of COPD cases. On the other hand, in 2006,
it is observed that there exists a decrease for the
number of COPD cases. Similarly, the increasing
trend of the level of air quality (PM and SO
2
) and
total population between 2006 and 2009 caused also
an increase trend for COPD incidence rate.
Table 6a: Model summary I (2006 - 2010).
However, in 2010, it is observed that there exists a
decrease for COPD incidence rate.
Table 6b: Model summary II (2006 - 2010).
Table 7a: Model summary I (2006 - 2010).
Table 7b: Model summary II (2006 - 2010).
The estimated model suggests that an increase in the
level of urban air pollution (PM and SO
2
) and
Year R R
2
Adjuste d R
Square
Std. Error
of the
Estimate
2006
0.795 0.632* 0.263 0.920132
2007
0.939 0.882* 0.765 0.549404
2008
0.818 0.670* 0.34 0.995425
2009
0.922 0.850* 0.699 0.757914
2010
0.994 0.988* 0.976 0.148554
* The R
2
coefficient of determination is a statistical measure of
how well the regression line approximates the real data points.
Sum of
Squares
df
Mean
Square
FSig.
Regre ssi on
4.354 3 1.451 1.714 0.025
Resi du al
2.540 3 0.847
Total
6.894 6
Regre ssi on
6.789 3 2.263 7.497 0.050
Resi du al
0.906 3 0.302
Total
7.694 6
Regre ssi on
6.031 3 2.010 2.029 0.028
Resi du al
2.973 3 0.991
Total
9.003 6
Regre ssi on
9.738 3 3.246 5.651 0.050
Resi du al
1.723 3 0.574
Total
11.461 6
Regre ssi on
5.371 3 1.790 81.128 0.002
Resi du al
0.066 3 0.022
Total
5.437 6
Year / Model
2006
2007
2008
2009
2010
Year R R
2
Ad
j
usted R
Square
Std. Error
of the
Estimate
2006
0.914 0.836* 0.671 1.464.763
2007
0.966 0.934* 0.867 0.973653
2008
0.931 0.866* 0.732 1.411.254
2009
0.975 0.951* 0.902 0.778403
2010
0.932 0.868* 0.737 1.610.722
*TheR
2
coefficient of determination is a statistical measure of how wellthe regression line
approximates the real data points..
Sum of
Squares
df
Mean
Square
FSig.
Regression
32.737 3 10.912 5.086 0.025
Resi du al
6.437 3 2.146
Total
39.174 6
Regression
39.937 3 13.312 14.043 0.029
Resi du al
2.844 3 0.948
Total
42.781 6
Regression
38.672 3 12.891 6.472 0.008
Resi du al
5.975 3 1.992
Total
44.647 6
Regression
35.350 3 11.783 19.447 0.018
Resi du al
1.818 3 0.606
Total
37.168 6
Regression
51.370 3 17.123 6.600 0.008
Resi du al
7.783 3 2.594
Total
59.153 6
Year / Model
2006
2007
2008
2009
2010
HEALTHINF2015-InternationalConferenceonHealthInformatics
228

Table 8: Parameter Estimations (2006 - 2010).
population causes a decrease in number of COPD
cases and an increase in incidence in 2006. An
additional 1% population and amount of pollutants
will cause 2,072 less number of COPD cases and
6,113 people more incidences for 2006. The model
suggests that an increase in the level of urban air
pollution (PM and SO
2
) and population causes in
number of COPD cases and incidence in 2007. An
additional 1% population and amount of pollutants
will cause 1,706 more COPD cases and 5,066 more
incidences for 2007. The model suggests that an
increase in the level of urban air pollution (PM and
SO
2
) and population causes an increase in number of
COPD cases and incidence in 2008. An additional
1% population and amount of pollutants will cause
1,922 more COPD cases and 6,759 more incidences
for 2008. An increase in the level of urban air
pollution (PM and SO
2
) and population causes an
increase in number of COPD cases and incidence in
2009. An additional 1% population and amount of
pollutants will cause 1,656 people more COPD cases
and 1,618 more incidence for 2009. An increase in
the level of urban air pollution (PM and SO
2
) and
population causes an increase in number of COPD
cases and a decrease in incidence in 2010. An
additional 1% population and amount of pollutants
will cause 1,115 more COPD cases and 9,334 less
incidence for 2010.
According to the findings of the analysis, the
increasing rate of total population and the decreasing
rate of air quality in the study area cause an
important increase for the number of COPD cases
and COPD incidence rate. In Karsiyaka, Konak and
Bornova Districts, the level of air pollution is lower
than the other districts because of the density of
population and motor vehicles in these districts, also
having more urban study areas than other districts
and the location of these districts according to the
main transportation axes.
In metropolitan cities, it is vitally important to
minimize the level of air pollutant in the atmosphere
for improving quality of life. Recently, several
precautions have been introduced for the
improvement of urban air quality such as the
dissemination of the usage of natural gas for
domestic heating, the emission controls for the
reduction of the level of air pollutants because of
dense motor vehicle in traffic and monitoring of coal
sales. Despite these precautions, the level of air
pollutants is still above the acceptable level
especially during the winter months.
There will be important steps in order to solve air
pollution problem especially in urban settlement
areas, such as the dissemination of renewable and
clean energy resources (natural gas, thermal energy,
etc.) in domestic heating and industrial processes,
more frequent controls for the measurements for air
quality in terms of spatial and time tables, improving
the control strategies, developing plan decisions in
consideration of air corridors, the dissemination of
open and green areas, encouragement of public
transportation and railway transportation type by
local governments and realizing studies to minimize
carbon emissions and to improve the air quality and
controlling over facilities of industrial areas.
REFERENCES
Cengiz, M.A., Senel, T., Terzi, E., Savas, N., Terzi, Y.,
2013. Samsun bölgesindeki hava kirliliginin neden
oldugu hastaliklarin istatistiksel modellenmesi.
Karadeniz Fen Bilimleri Dergisi / The Black Sea
Journal of Sciences Volume 3, Issue 8, pages 27-36,
ISSN: 1309-4726.
Chen, L., Yang, W., Jennison, B.L., Omaye, S,T., 2000.
Air particulate pollution and hospital admissions for
chronic obstructive pulmonary disease in Reno,
Nevada. Inhalation Toxicology, Volume 12, Issue 4,
pages 281-98.
Cinarka, H., Kilic Yilmaz, H., Yazici, N., Kayhan, S.,
Gumus, A., 2011. A five year mortality analysis in a
chest disease hospital located in East Blacksea Region.
Journal of Clinical and Analytical Medicine, Volume
2, pages 1-5.
Darcin, M., 2013. Association between air quality and
quality of life. Environmental Science and Pollution
Research, Volume 21, Issue 3, pages 1954-1959.
Dockery, D.W., Schwartz, J., Spengler, J.D., 1993. Air
pollution and daily mortality: associations with
particulates and acid aerosols, Environmental
Research, Volume 59, pages 362-373.
Faustini, A., Stafoggia, M., Cappai, G., Forastiere, F.,
2012. Short-term effects of air pollution in a cohort of
patients with chronic obstructive pulmonary disease.
Epidemiology, Volume 23, Issue 6, pages 861–879.
Variable
Es t i m a t e d
Unstandardized
Coefficients
tSig.
2006t
-207.2126 -0.984 0.025
2007t
170.5796 1.457 0.05
2008t
192.1966 0.127 0.028
2009t
165.611 1.498 0.05
2010t
111.46 5.489 0.002
i2006
611.3466 1.872 0.025
i2007
506.5806 2.087 0.029
i2008
675.9446 0.03 0.008
i2009
161.8033 1.35 0.018
i2010
-933.411 -0.038 0.008
COPDandUrbanAirPollution-GISBasedSpatialPatternandtheGeostatisticalAnalysisofIzmir
229

Godish, T., 1997. Air Quality. Chemical Rubber Company
(CRC) Press LLC, Florida, United States.
Google Earth Satellite Images, Access Date: 10th June
2014.
Jerrett, M., Finkelstein, M.M., Sears, M.R., 2009. A cohort
study of traffic-related air pollution and mortality in
Toronto, Ontario, Canada. Environmental Health
Perspective, Volume 117, Issue 5, pages 772–777.
Koc, Y., Karagöz, N., Söylemez Seven, A., 2002. Hava
kirliliginin sivas gögus hastaliklarini hastanesi’ne
yatislar uzerine etkisi. Kartal Egitim ve Arastirma
Hastanesi Tip Dergisi, Volume XIII: 2, pages 75 – 78.
Lindgren, A., Stroh, E., Montnémery, P., Nihlén, U.,
Jakobsson, K., Axmon, A., 2009. Traffic-related air
pollution associated with prevalence of asthmaand
COPD/chronic bronchitis. A cross-sectional study in
Southern Sweden. International Journal of Health
Geographics, Volume 8, Issue 2, pages 1-15.
Maantay, J. A., Mclafferty, S. (2011). Geospatial Analysis
of Environmental Health. Springer, USA.
Marans, Robert W., Stimson, R. J. (2011). Investigating
quality of urban life: theory, methods and empirical
research. Springer, Dordrecht, New York.
Muezzinoglu, A., 2000. Hava Kirliligi ve Kontrolunun
Esaslari. Dokuz Eylul Yayinlari, Izmir, Turkey.
Nuvolone, D., Maggiore, R.D., Maio, S., Fresco, R.,
Baldacci, S., Carrozzi, L., Pistelli, F., Viegi, G., 2011.
Geographical information system and environmental
epidemiology: a cross-sectional spatial analysis of the
effects of traffic-related air pollution on population
respiratory health. Environmental Health, Volume 10,
Issue 12, pages 1-12.
Poulstrup, A., Hansen, H. L. (2004). Use of GIS and
exposure modeling as tools in a study of cancer
incidence in a population exposed to airborne dioxin.
Environmental Health Perspectives, Volume 112,
Issue 9, pages 1032-1036.
Schikowski, T., Sugiri, D., Ranft, U., Gehring, U.,
Heinrich, J., Wichmann, H.E. et al., 2005. Long-term
air pollution exposure and living close to busy roads
are associated with COPD in women. Respiratory
Research, Volume 6, pages 1-12.
Tagil, S., Mentese, S., 2012. Zonguldak’ta hava kirliligi
(PM
10
ve SO
2
) ile iliskili olarak secilmis solunum yolu
hastaliklarinin zamansal ve mekânsal degisimi.
Balikesir Universitesi, Sosyal Bilimler Enstitusu
Dergisi, ISSN 1301-5265, Volume 15,
Issue 27, pages 3-20.
The Ministry of Health of Turkey, Ministry of Health
Department of Cancer Control. (2008). Cancer
Control in Turkey. Ankara: The Turkish Republic
Ministry of Health, Department of Cancer Control.
The Ministry of Health, Izmir Provincial Directorate of
Health, Department of Statistics, The Distribution of
Patient and Deaths by Gender, 2006-2010 Years.
Unsal, A., Metintas, S., Oner, S., Inan, O.C., 1999.
Eskisehir’de hava kirliligi ve bazi hastaliklar nedeniyle
acil basvurularin incelenmesi. Tuberkuloz ve Toraks
Dergisi, Volume 47, Issue 4, pages 449-455.
URL1: Kronik Obstruktif Akciger, http://www.xn--salk-
1wa3i.net/koah.html (10.06.2014).
URL2: Izmir Metropolitan Area Municipality
http://www.izmir.bel.tr/eislem/HavaDegerleri/HavaDe
gerleri.aspx, Access Date: 10th June 2014.
Wong, C.M., Ma, S., Hedley, A.J., Lam, T.H., 2011.
Effect of air pollution on daily mortality in Hong
Kong. Environmental Health Perspectives, Volume
109, Issue 4, pages 335-340.
Zanobetti, A., Schwartz, J., Dockery, D.W., 2000.
Airborne particles are a risk factor for hospital
admissions for heart and lung disease. Environmental
Health Perspectives, Volume 108, Issue 11, pages
1071–1077.
Zhang, Z., Wang, J., Chen, L., Chen, X., Sun, G., Zhong,
N., Kan, H., Lu, W., 2013. Impact of haze and air
pollution-related hazards on hospital admissions in
Guangzhou, China. Environmental Science and
Pollution Research, Volume 21, Issue 6, pages 4236-
4244.
HEALTHINF2015-InternationalConferenceonHealthInformatics
230
