
Multi-Constraints and Single Objective Based Optimum Routes
Planning for Assisted Evacuation
A Geographic Information System Based Solution and Simulation
Md. Imran Hossain
Institute for Applied Computer Science, University of the Bundeswehr Munich,
Werner-Heisenberg-Weg 39, 85577 Neubiberg, Germany
1 RESEARCH PROBLEM
With the advancement of modern technologies it is
now more or less possible to predict almost all kind
of natural and manmade disasters in terms of their
time of occurrence, intensity and geographic area of
occurrence. However, recent large natural and
anthropogenic disasters have clearly shown various
shortcomings and failures in existing technologies
for efficient emergency response especially in the
domain of evacuation (Konečný, Zlatanova and
Bandrova, 2010). Depending on the magnitude,
especially when a massive destruction is expected
for a forthcoming disaster, evacuations sometime
become so obvious to minimize the casualties. When
an evacuation becomes obvious, the responsible
authorities usually announce the event through
different media and possibly with escape routes and
directions. Thus, in the event of evacuation, people
who have their own vehicle or have good access to
the available transport modes can evacuate by
themselves. On the other hand, there are always
special groups of people who are subject to severe
mobility restrictions in terms of lack of personal
transportation, limited financial resources,
unfamiliarity with the area and its road network,
physical and mental disabilities, language barrier
etc. (Zimmerman, Brodesky and Karp, 2007). These
groups of people are therefore at greatest risk of
casualties. The responsible authorities (public safety
agencies, police department etc.) for evacuation
provide special evacuation units (vehicles) to collect
and shift those special groups to a safe place which
is called herein as the assisted evacuation.
The route plan for each evacuation unit has
significant effects on the efficiency of such assisted
evacuation. The contemporary manual route
planning with unknown spatial evacuee distribution
hinders the performance of assisted evacuation in
many folds. First of all, the evacuation units have to
go through all the streets of a given area of
evacuation which usually lead to a substantial waste
of time and therefore become very inefficient
especially when the evacuation is bounded by huge
time pressure. Secondly, the manual process is
unable to give estimation for the required/optimum
number of evacuation units to cover all the evacuees
who need assistance. And finally it cannot provide
estimation for evacuees to be covered under certain
time and resource constraints. Therefore, with a
known spatial distribution of the evacuees,
automatic dynamic optimized route plans for the
evacuation units would certainly preside over the
any manual interventions in this case.
An incident manager, under any circumstances,
would be interested to cover all the evacuees of an
area which is under disaster thread. But this might
not happen in reality as the performance of assisted
evacuation of an area depends on the route plan of
each evacuation unit together with at least three
major factors or variables: 1) Total available time
(T): the time segment between the announcement of
an evacuation and the actual disaster event. 2) Total
available evacuation units (U) and 3) Number of
evacuees (E): the number of the evacuees who need
assistance. Therefore, a decision support system that
can deliver the optimized dynamic route plans for all
the evacuation units by fixing any two
variables/factors and keeping the third as a goal
would enable the incident manager for estimating
the required resources and to take the right decision
in a given evacuation scenario. Along with the
optimized route plans the decision support system
should answer the following questions as well.
1) How many evacuees (E) could be evacuated
under certain time (T) and resource (U) constraints?
2) How many evacuation units (U) would be
required to evacuate a certain number of evacuees
(E) under a certain time (T) constraint?
3) How long (T) would it take to evacuate certain
amount of evacuees (E) with certain number of
evacuation units (U)?
This research project is therefore intended to
develop such kind of decision support system (DSS).
The DSS would be further tested, verified and
validated by a suitable simulation technology.
35
Hossain M..
Multi-Constraints and Single Objective Based Optimum Routes Planning for Assisted Evacuation - A Geographic Information System Based Solution
and Simulation.
Copyright
c
2014 SCITEPRESS (Science and Technology Publications, Lda.)

2 OUTLINE OF OBJECTIVES
The overall aim of this research is to design, build
and validate a decision support system that can
produce optimal dynamic route plans for multiple
evacuation units involved in the assisted evacuation
with multiple constraints and a single objective. To
achieve this aim the following research objectives
are formulated.
Objective 1: To estimate the spatio-temporal
distribution of the evacuees who need
assistance.
Objective 2: To divide a geographic area
defined by a set of geographic features
(buildings in this case) into multiple regions in
a way that each region is consists of almost
equal number of evacuees.
Objective 3: To estimate time required for
evacuating different type of evacuees
considering the traffic situation and
surrounding environment.
Objective 4: To develop dynamic routing
algorithm for optimum path generation that
further allows routing during run time.
Objective 5: To design and build a decision
support system with the output of all previous
four objectives.
Objective 6: To simulate some disaster cases
with appropriate simulation technology/ies to
test, verify and validate the decision support
system.
3 STATE OF THE ART
A spatial decision support system is an interactive,
computer-based system designed to support a user or
a group of users in achieving greater effectiveness in
decision-making while solving a semi-structured
(not completely programmable) spatial decision
problem (Malczewski 1999). There are quite a large
number of DSSs exist in the domain of Geographic
Information System (GIS). However, the author did
not find any decision support system that provides
exact solutions to the problem stated in the problem
statement part (section 1). However, quite a number
of literatures related to the objectives, especially
objective no. 1 to 4 are already available. Therefore,
the state of the art, herewith, is formulated according
to the different objectives of this research and is
given with the following subsections.
3.1 Spatio-Temporal Distribution of
Evacuees Who Need Assistance
Ahola et al. (2007) have developed a spatio-
temporal population model to support risk
assessment and damage analysis for Finnish Fire and
Rescue Services and the Finnish Defence Forces.
Their model uses a basic population and workplace
dataset maintained by the Helsinki Metropolitan
Area Council. With the model the authors prepare
population density map for day and night time for a
specific area.
Ural, Hussain and Shan (2011) have tried to map
the spatial distribution of population in a different
way mainly using a combination of aerial imagery
and GIS data. In their work they have extracted the
buildings from aerial imagery and then classified
those through City Zoning maps. Additional
ancillary geo-data has been used to filter out the
utility buildings. Finally, census block data has been
disaggregated and linked to the individual building.
Freire (2010) has used a dasymetric mapping
approach to refine population distribution in
Portugal. The author has calculated the maximum
day time and night time population for each 25 m
grid cell of a raster map.
It is clear that different approaches and
techniques are already available mainly for mapping
the spatial distribution of population. The temporal
aspects are considered in few cases but with a very
coarse temporal resolution. However, in this
research spatio-temporal distribution of the evacuees
who need assistance, need to be known. This could
be achieved through either enrichment and
modification of the available methodologies or
development of completely new methodology.
3.2 Regionalization/Zoning Systems
Automated zone design (AZD) or regionalisation is
a technique for which Shortt (Thrift and Kitchin,
2009) has given the overview of its concept,
terminology and methods. AZD is an umbrella term
for quite a number of approaches to create zones
from a set of basic building blocks following given
criteria. Among the automated zone design
algorithms automated zone design procedure (AZP)
is the most popular and widely used one. It was
introduced by Openshaw and Baxter (1977). The
AZP has been enhanced by Openshaw and Rao
(1994), Alvanides (2000) and Alvanides et al (2002).
Cockings et. al. (2011) used automated zone design
techniques to dynamically maintain existing zoning
systems. There are also a lot of other application of
AZP algorithm such as climate zoning, location
optimization and many more. The AZP algorithm
SIMULTECH2014-DoctoralConsortium
36

iteratively combinines and recombines sets of blocks
in order to create output zones which are optimised
based on a set of pre-specified design criteria
(Openshaw and Rao, 1994).
AZP is not applicable to the task defined in
objective 2 as firstly, AZP is applicable only to
continuous and connected feature sets whereas in
our case continuous and discrete feature sets must be
treated. Secondly, in AZP the geometric structure
and thematic attributes of the input building blocks
are destroyed to form a new zone out of them. This
should not be allowed in the present research work.
Also it is required in our approach that the bounding
polygon of each region must not overlap with any
other region to offer a distinct separate area for each
evacuation unit.
3.3 Time Estimation for Evacuation
The evacuation time requirement is expected to vary
according to the type of evacuees who need
assistance and their surrounding environment. For
example the required time for evacuating a
physically disabled evacuee who lives at the 10
th
floor would be much higher than an evacuee who
just doesn’t have transportation access and resides at
a single storied building. A model has to be
developed in this research that can provide
information on required time for a specific type of
evacuee considering the surrounding environment.
Unfortunately, no literature has been found that
present such a model. Therefore, this type of model
has to be built from the scratch.
3.3 Dynamic and Optimum Routing
Algorithms
Hundreds of routing algorithms are available
nowadays for calculating paths between two or more
points of interest. Laporte (1992) provides a general
wide overview and classification of the vehicle
routing algorithms. Most of them till date are static
in nature means the underlying data are known in
advance. On the other hand, routing algorithms are
designed in a way that it can provide routed between
the points of interest at a minimum cost, generally
the total travel time or the total travelled distance.
In the premise of Dynamic Vehicle Routing
Problems (DVRPs) new orders dynamically arrive
when the vehicles have already started executing
their tours, which consequently have to be re-
planned at run time in order to include these new
orders (Montemanni et al., 2003).
The DSS to be built in this research is expected
to provide routes for each evacuation unit involved
in the assisted evacuation in a way that instead of
shortest or fastest path, it can produce an optimized
path to serve all the evacuee of the defined territory
of an evacuation unit in an optimized way. In
addition, the routing algorithm should support the
DVRP as spatial distribution of the evacuees could
change over time.
4 STAGE OF THE RESEARCH
The authors at this stage successfully achieved only
objective number 2. An algorithm for segmenting a
geographic area defined by a set of geographic
feature set into equitable regions has been
developed, implemented and published in the 17
th
AGILE Conference on Geographic Information
Science (Hossain and Reinhardt, 2014). A brief
summary of the work is given below.
4.1 the Task
A geographic area G defined by a feature set
consisting of n features with a numeric attribute A
has to be completely divided into N (N | 2 ≤ N ≤
n) number of subsets/regions based on 3 criteria.
Input:
- Geographic area G = {f
n
| f
n
F (set of features), f
n
has a numeric attribute A}
- N (N | 2 ≤ N ≤ n) = number of required subsets
of G, N has to be defined by the user.
Output:
- N number of subsets R
n
(subsets/regions)
Criteria:
1) Region cannot be formed with splitted feature
means a feature of a region is not allowed to be in a
form like f
i
/m | m .
2) The sum of |A| (|A| is the value of attribute A) of
any region defined herein with O(R
i
)
= T ± d
3) The bounding polygon of any subset BNDline(R
i
)
do not overlap with the bounding polygon of any
other.
The value of T is calculated by equation 1and the
value of d is an element of set D. The value of d can
ranges from 0 to the maximum value of |A| of a
given feature set G (equation 2).
∑
|
|
(1)
d
D = {q
ℚ|0 ≤ q < MAX (|A|(G)) }
(2)
Multi-ConstraintsandSingleObjectiveBasedOptimumRoutesPlanningforAssistedEvacuation-AGeographic
InformationSystemBasedSolutionandSimulation
37
In general, the algorithm prioritizes forming
regions along the bounding line BNDline(G) of the
input feature set G. This approach prevents features
being unclassified and also prevent big differences
among the regions. A region R
i
is formed by
grouping features around the bounding line until
O(R
i
)
= T ± d. Once no region formation is possible
along the BNDline(G), another bounding line is
created for the features which are not classified into
regions and regions are again formed along the new
bounding line. This process continues until N-1
regions are formed. The N
th
region is formed with
remaining unclassified features after formation of N-
1
th
region and consequently it´s possible that the sum
of |A| may not be within T ± d in this case.
4.2 Steps of the Algorithm
The algorithm is described in more detail through
the following steps.
Step 1: Objective Function Calculation
Objective function returns the value of T on which
each region is formed. T is calculated through
equation 1.
Step 2: Selection of the Starting Feature for
the First Region
The starting feature for the first region is selected by
two criteria. Firstly, it has to be along the
BNDline(G) and secondly it has to be located in an
appropriate corner of G. Therefore the starting
feature is selected by firstly making an array of
features that touches the BNDline(G). Secondly a
feature is picked up from that array and distances are
calculated from that feature to all other features of
that array. The maximum distance is then stored
with each picked up feature. This process is carried
out for all features in the array. Finally, the feature
that has the maximum distance value compared to
A
1
A region (feature set with gray color) is formed by aggregating
features from G with starting feature based on closest distance
B
A feature (dark gray) from G is selected as a start feature for
subsequent region building if it is closest to the bounding
line of (thick dotted line) previously formed region and
touches the bounding line of the input feature set G
C
2
D
All the features along the bounding line (outer black line) of G
are classified into regions. A second bounding line (inner black
line) is formed for the unclassified features.
The features with gray color touch the bounding line (black
line). For each gray feature distance to other gray features are
measured and the maximum is stored. The maximum of gray
feature 1 (thicker line) is higher than the maximum of gray
feature 2 (thicker line). Thus the gray feature whose
maximum is the highest is selected as starting feature
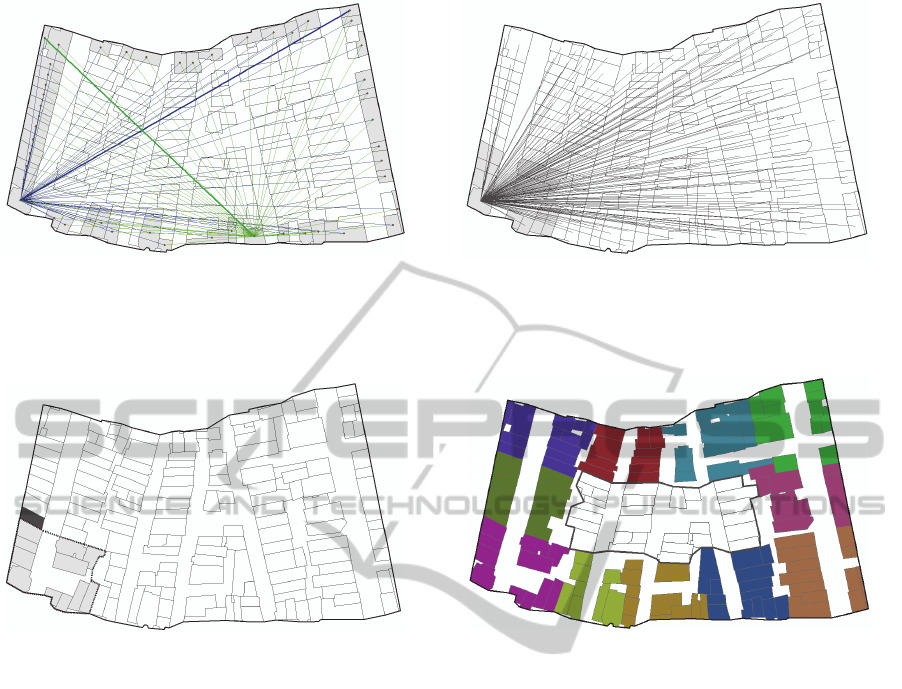
Figure 1: Visual illustration of different steps of the algorithm.
SIMULTECH2014-DoctoralConsortium
38
other features in the array is selected as a starting
feature for the first region formation (fig. 1A).
Step 3: Formation of the First Region
At the beginning the first region R
1
is formed only
with the starting feature. Then the region is grown
by grouping features from G on the basis of
minimum distance, which means a feature from G is
allowed to be grouped with the starting feature if the
distance between them is a minimum compared to
the distance of other features in G (fig. 1B). This
grouping or region building is continued until O(R
1
)
= T ± d criteria is fulfilled. Since a feature in G is
not allowed to divide according to the underlying
data model, it is only possible to completely include
or exclude a feature to a region. Which means the
feature cannot be sliced. So, O(R
1
) cannot always be
exactly equal to T. The maximum possible deviation
of O(R
1
) with T for R
1
to R
N-1
will be thus the
maximum value of |A| of any given G.
Once a region R
i
is formed, a static variable
StatN is updated with the number of region formed
and the feature set on which the process will be
continued is obtained by G - R
i
. The process
terminates and goes out of scope when N-1 = StatN.
For example, if 3 regions are expected and 2 regions
have already been completed then remaining
features of G automatically form a region and the
process goes out of scope.
Step 4: Start Feature Selection for the
Subsequent Regions
As stated earlier, the algorithm prioritizes forming
regions along the bounding line BNDline(G) of the
input feature set G. Therefore, a start feature for any
subsequent region R
i+1
should be located next to the
former region R
i
and also should touch the
BNDline(G) (fig. 1C). These are two simple criteria
for selecting a start feature for any subsequent
region building.
Step 5: Repetition
Step 3 to 4 are repeated until no start feature is
returned by step 4 and the required number of
regions is still not achieved. A null feature return by
step 4 means all the features along the bounding line
of G are classified into regions. If this is the case, a
new bounding line is created for the set of non-
classified features (fig. 1D). The BNDline(G) which
is created in step2 is replaced by the new bounding
line and the process starts continuing from step 2.
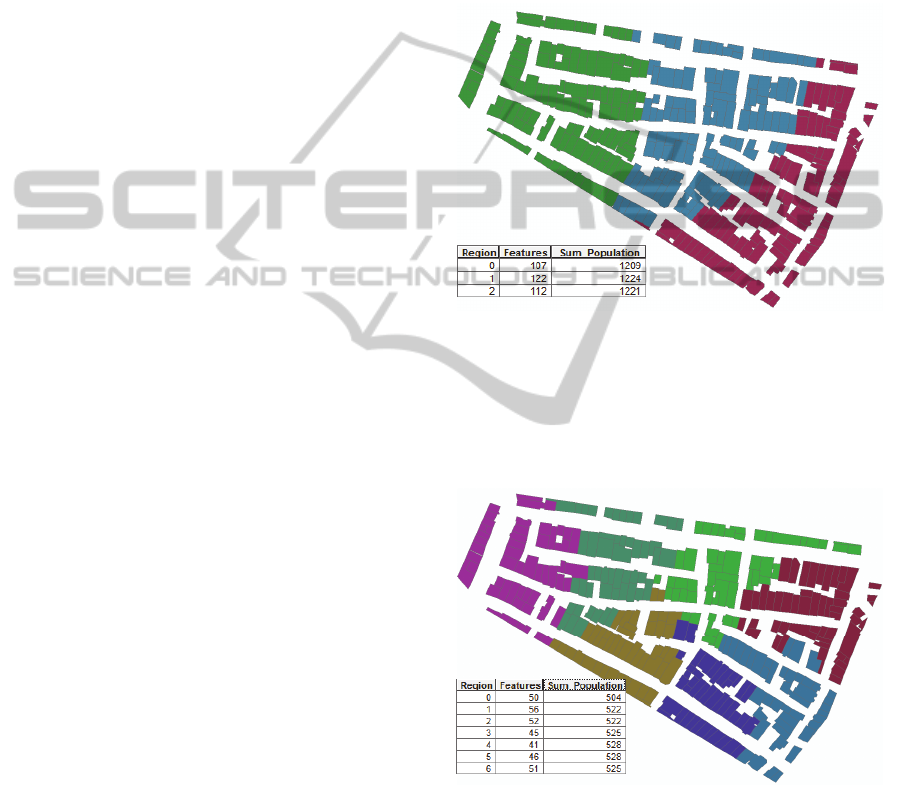
4.3 Implementation and Results
The algorithm presented in section 4.2 has been
implemented using c# programming language and
ArcObjects library of ESRI. Figure 2 and 3 show the
result of 2 examples of an application of the
implemented algorithm. Each feature (polygon) in
both figures represents residential buildings and has
an attribute called population (no. of residents). The
maximum value of d of the input feature set was 21.
Figure 2: Input feature set divided into 3 equitable regions.
In figure 2, the expected number of equitable
regions was 3 based on the population attribute
which means the feature set has to be divided into 3
non-overlapping regions so that the total population
for each region remains approximately equal.
Figure 3: Input feature set divided into 7 equitable regions.
In figure 3 the expected region number was 7.
Both figures show a distinct division of the feature
set into regions. None of the region in both figure
overlap with others. The important point to be noted
here is that region no.0 in both figures differs
significantly from other regions in terms of total
population and the difference goes beyond the
MAX(d) in figure 7. The differences among other
regions are minimal and within MAX(d).
Multi-ConstraintsandSingleObjectiveBasedOptimumRoutesPlanningforAssistedEvacuation-AGeographic
InformationSystemBasedSolutionandSimulation
39
Region 0 is in fact the last region formed with
the remaining feature set once N-1 regions are
formed. If the other regions formed with a positive
value of d (section 3, step 3) then the effect goes on
to the last N
th
region (region 0) which is forced to be
formed with a total value deduced by the cumulative
positive d of the former regions. Thus only the N
th
region’s O(R
n
) may not be equal to T ± d. The
maximum difference between the last region’s O(R
n
)
with other regions O(R
i
) is thus expected to be
higher with the increased no. of regions. However,
this problem can be solved with a constraint that two
consecutive regions should form with +d and –d
simultaneously which restricts region formation with
always +d or –d.
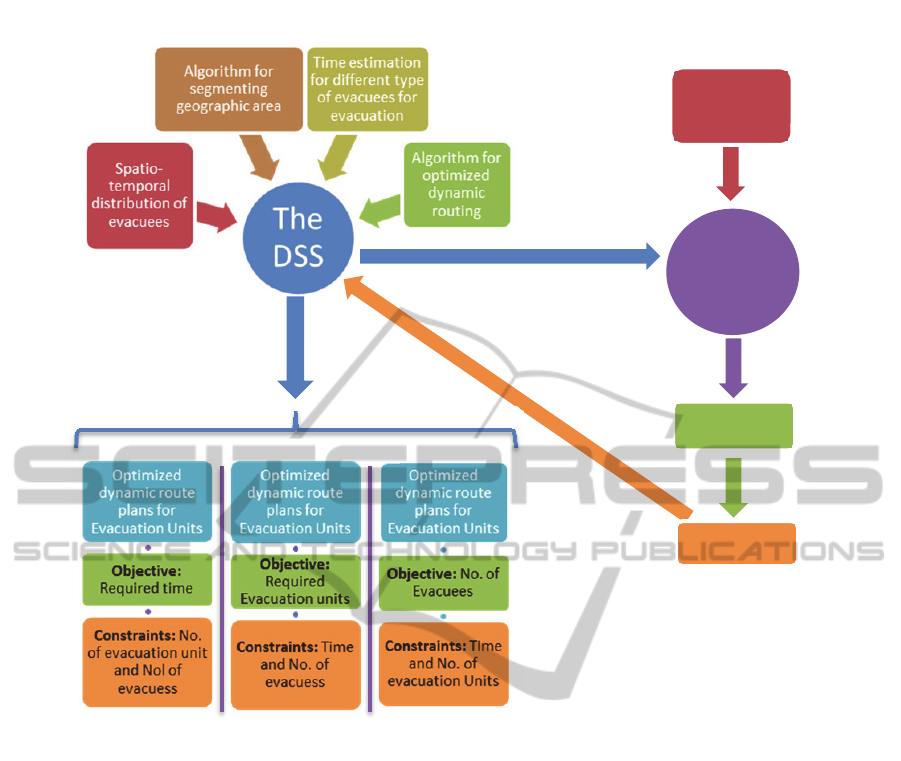
5 METHODOLOGY
The methodology of this research is presented by
figure 4. The DSS which is the core of the present
research is foreseen to be composed of four different
components. The first component is a model which
would provide the spatio-temporal distribution of the
evacuees who need evacuation assistance. The
second component is an algorithm by which a given
geographic area would be divided into multiple
equal regions in terms of the number of evacuees
and their corresponding required evacuation time to
assign each evacuation unit to a region.
Development of the second component is already
done for which a brief summery is given in the
section 4. The third component is a model to
estimate the required time for evacuating a specific
type of evacuee considering his/her surrounding
environment. And the fourth component is again an
algorithm which would provide dynamic route plan
for each evacuation unit with optimized path.
The outcome/usage of the DSS is shown by the
thick blue downward arrow in figure 4. Three
possible outcomes are shown here. An incident
manager can go for any one among the possible
three. All the outcomes have a common feature
which is the optimized dynamic route plans for the
evacuation units. Along with this, an incident
manager can fix two constraints at a time and can
get a decision regarding an objective. For example if
Evacuation
scenario
Simulation
Results
ResultAnalysis
OR
OR
Figure 4: A gross methodology of the research.
SIMULTECH2014-DoctoralConsortium
40

no. of evacuation unit and the no. of evacuees are
fixed then the incident manager will get as outputs
the required time and the route plans.
Once the DSS is build, a suitable simulation
framework would be created for testing, validation
and verification of the DSS. Decision regarding the
technological aspects behind the simulation is not
yet decided. It might be an agent based simulation,
statistical simulation or any other depending on the
suitability and purpose of the DSS.
Some evacuation scenarios would then be
simulated by combining the DSS with the simulation
framework. The result of the simulation would be
analysed. Any drawbacks or shortcoming that may
become identified with the analysis will then be
adjusted in the DSS (the components of the DSS).
6 EXPECTED OUTCOME
The main outcome of this research is a multiple
constraints based decision support system for a
single evacuation objective supported by optimal
dynamic route plans for multiple evacuation units
involved in the assisted evacuation. With the
decision support system an incident manager, among
the three variables: time, resources and evacuees,
could make estimation for one variable while fixing
the other two, supported by optimized dynamic
routing plans for the evacuation units. Moreover,
this research would create some further by-products
which are listed below.
1) Methodology for estimating the spatio-
temporal distribution of the evacuees who need
evacuation assistance.
2) An algorithm for segmenting a geographic
area into equitable regions
3) Methodology for estimating the time
requirement for evacuating different types of
evacuees considering the traffic situation and
surrounding environment.
4) An advanced algorithm for optimized routing.
The routing algorithm is also expected to be
dynamic which means it can provide alternative
updated route plans during run time.
5): A simulation framework for the testing,
varifiying and validation of the DSS with some
disaster cases.
REFERENCES
Ahola, T., Virrantaus, K., Krisp, J. and Hunter, G. (2007).
A spatio-temporal population model to support risk
assessment and damage analysis for decision-making.
International Journal of Geographical Information
Science, 21(8), pp.935--953.
Alvanides, S. (2000). Zone Design Methods for
Application in Human Geography. Ph.D. School of
Geography, University of Leeds.
Alvanides, S. Openshaw and P. Rees (2002). Designing
your own geographies. The Census Data System, pp.
47--65.
Cockings, S., Harfoot, A., Martin, D. and Hornby, D.
(2011). Maintaining existing zoning systems using
automated zone-design techniques: methods for
creating the 2011 Census output geographies for
England and Wales. Environment and Planning-Part
A, 43(10), p.2399.
Freire, S. (2010). Modeling of Spatiotemporal Distribution
of Urban Population at High Resolution – Value for
Risk Assessment and Emergency Management. In: M.
Konecny, S. Zlatanova and L. Bandrova, ed.,
Geographic Information and Cartography for Risk
and Crisis Management-Towards Better Solutions, 1st
ed. Berlin: Springer-Verlag Berlin Heidelberg, pp.52-
67.
Hossain, M. and Reinhardt, W. (2014). An algorithm for
segmenting a feature set into equitable regions. In:
Connecting a Digital Europe through Location and
Place. Castellón: Association of Geographic
Information Laboratories for Europe (AGILE).
Konečný, M., Zlatanova, S. and Bandrova, T. (2010).
Geographic information and cartography for risk and
crises management. 1st ed. Heidelberg: Springer
Verlag.
Laporte, G. (1992). The vehicle routing problem: An
overview of exact and approximate algorithms.
European Journal of Operational Research, 59(3),
pp.345--358.
Malczewsky, J. (1999). GIS and Multi-Criteria Decision
Analysis, New York: Wiley.
Montemanni, R., Gambardella, L., Rizzoli, A. and Donati,
A. (2003). A new algorithm for a dynamic vehicle
routing problem based on ant colony system. 1(1),
pp.27--30.
Openshaw, S. and Baxter, R. (1977). Algorithm 3: a
procedure to generate pseudo-random aggregations of
N zones into M zones, where M is less than N.
Environment and Planning A, 9(6), pp.1423--1428.
Openshaw, S. and Rao, L. (1994). Re-engineering 1991
census geography. 1st ed. Leeds: School of
Geography, University of Leeds.
Thrift, N. and Kitchin, R. (2009). International
encyclopedia of human geography. 1st ed. Amterdam:
Elsevier.
Ural, S., Hussain, E. and Shan, J. (2011). Building
population mapping with aerial imagery and GIS data.
International Journal of Applied Earth Observation
and Geoinformation, 13(6), pp.841--852.
Zimmerman, C., Brodesky, R. and Karp, J. (2007). Using
highways for no-notice evacuations. 1st ed.
Washington, D.C.: Federal Highway Administration,
Office of Operations.
Multi-ConstraintsandSingleObjectiveBasedOptimumRoutesPlanningforAssistedEvacuation-AGeographic
InformationSystemBasedSolutionandSimulation
41
