
Data Preparation for Tourist Data Big Data Warehousing
Nunziato Cassavia
1
, Pietro Dicosta
2
, Elio Masciari
1
and Domenico Sacc
`
a
2,3
1
ICAR-CNR, Rende Italia
2
DIMES UNICAL, Rende, Italia
3
Centro di Competenza ICT-SUD, Rende, Italia
Keywords:
ETL for Big Data, NoSQL and Hive.
Abstract:
The pervasive diffusion of new generation devices like smart phones and tablets along with the widespread
use of social networks causes the generation of massive data flows containing heterogeneous information
generated at different rates and having different formats. These data are referred as Big Data and require
new storage and analysis approaches to be investigated for managing them. In this paper we will describe a
system for dealing with massive tourism flows that we exploited for the analysis of tourist behavior in Italy.
We defined a framework that exploits a NoSQL approach for data management and map reduce for improving
the analysis of the data gathered from different sources.
1 INTRODUCTION
Due to the massive use of new software and hardware
tools like social networks, smartphones and tablets,
people leave digital trace of everyday activities. In
this respect, tourists generate huge amounts of valu-
able data that need to be properly elaborated(Agrawal
et al., 2011).
These heterogeneous, stream-based and complex
data are currently referred as Big Data and they are
receiving a great deal of attention as the above men-
tioned features make their management quite intrigu-
ing in order to create value from data (WWW1, 2008;
WWW2, 2010; WWW3, 2011; Agrawal et al., 2012;
Lohr, 2012; Manyika et al., 2011; Noguchi, 2011a;
Noguchi, 2011b). Indeed, we have to deal with sev-
eral problems starting from data acquisition phase
in order to perform meaningful (Labrinidis and Ja-
gadish, 2012). In particular, the data being collected
at high rates from different sources requires us to
make decisions, currently in an ad-hoc manner, about
what data to keep and what to discard, and how to
store, what we keep reliably with the right metadata
(Agrawal et al., 2012). Moreover, many problems
arise also when choosing the proper pre-elaboration
for data being analyzed. Indeed, we need to cope with
the following aspects:
1. Structure: Data are often generated in an unstruc-
tured format (e.g., in sensor networks, data can be
generated by heterogeneous sensors, possibly be-
cause of different vendors);
2. Semantic: Data may refer to different concepts
(e.g. in sensor networks, data can refer to different
physical properties which are observed for differ-
ent purposes);
3. Integration: Data value increases considerably
when target data sources can be linked with other
data sources, thus data integration is a crucial task
in the data value chain.
In this paper, we describe our approach to Big
Data analysis in the tourist data scenario. We aim
to define and implement models, processes and tools
for sustainable development of an intelligent territory
through the exploitation of its cultural heritage, envi-
ronmental resources and the promotion and market-
ing of its tourist offer. The main challenge is to orga-
nize and model data in order to improve later linkage,
querying, retrieval and analysis of previously created
data. In particular, data analysis could be a bottleneck
in many applications, both due to lack of scalability of
the underlying algorithms and due to the complexity
of the data that needs to be analyzed. Finally, pre-
sentation of the results and its interpretation by non-
technical domain experts is crucial for extracting ac-
tionable knowledge.
In more detail, our goal is to define and develop an
integrated system of novel services and applications
for the creation, certification, organization, monitor-
ing and promotion of tourism and a real time platform
419
Cassavia N., Dicosta P., Masciari E. and Saccà D..
Data Preparation for Tourist Data Big Data Warehousing.
DOI: 10.5220/0005144004190426
In Proceedings of 3rd International Conference on Data Management Technologies and Applications (KomIS-2014), pages 419-426
ISBN: 978-989-758-035-2
Copyright
c
2014 SCITEPRESS (Science and Technology Publications, Lda.)

to support Travel Mobility. We focus in this paper on
the effective analysis of tourist data by On Line An-
alytical Approach tools designed for supporting the
analysis of Big Data gathered from several sources. In
particular, we define an end-to-end framework to as-
sist decision makers starting from the pre-elaboration
process (that could reveal really hard for heteroge-
neous sources) to the analysis steps. To better under-
stand the features of our framework we first describe
basic tools devoted to Big Data management and our
effort to properly integrate them.
2 BIG DATA: DATA STORAGE
AND ANALYSIS FEATURES
Due to the advances in data gathering and storage and
the availability of new data sources such as social net-
works, data volume collected by public organizations
and private companies is rapidly growing. Moreover,
the users interested to access and analyse these data
are growing too. As a matter of fact, data management
systems are used intensively, in order to answer an in-
creasing number of queries to solve complex analysis
tasks needed to assist decision makers in crucial busi-
ness processes. As a result, activities like data anal-
ysis and business reporting call for ever increasing
resources. Moreover, only few years ago the largest
Data Warehouse size was about 100 Terabytes, while
nowadays Data Warehouse size of Petabytes are fre-
quently built. Therefore, there is a need for better,
faster and more effective techniques for dealing with
this huge amount of data.
Moreover, Big Data exhibits several formats for
raw data being collected. In many practical scenar-
ios, they are really different than the simple numer-
ical and textual information actually stored in Data
Warehouses. Thus, Big Data cannot be analyzed with
common SQL based techniques.
A crucial challenge posed by Big Data is a
paradigm shift in how organization behave with re-
spect to their data assets. More in detail data special-
ists must rethink:
• The data acquisition policies;
• The data analysis techniques most suited for data
being gathered;
• The impact of the analysis on the business strate-
gies.
To better understand the importance of the above
mentioned issues we mention here some key applica-
tion for almost all real life scenarios:
1. Efficient information search, ranking, ad tracking;
2. Geo-referenced analysis;
3. Causal factor discovery;
4. Social Customer Relationship Management;
All these requirements calls Business Intelligence
(BI) systems to provide proper innovative solutions
to complex analysis task. In this respect, decision-
makers need quick access to information as much
complete as possible in order to make accurate and
fast decisions in a continuously changing environ-
ment. Thus, the challenge is to assure a satisfac-
tory efficiency when querying huge Data Warehouses,
which (unfortunately) are (often) built, on top of rela-
tional structures, storing data in a row-oriented man-
ner. Indeed, the relational model is flexible and it is
tailored to support both transactional and analytical
processing. However, as the size and complexity of
Data Warehouses increases, a new approach has to be
proposed as an efficient alternative to row oriented ap-
proach. To this end a valid approach is the data stor-
age in a column oriented way. The rest of this section
is devoted to describe the main component of a Big
Data infrastructure.
2.1 Column Oriented DBMS
Using the row oriented approach, the data storage
layer contains records (i.e. rows), while in a col-
umn oriented system it contains families of rows (i.e.
columns). The widespread use of the relational ap-
proach is mainly due to its flexibility to represent al-
most any kind of data. Indeed, users are able to access
and manipulate data without being involved in any
technical aspects concerning data storage and access.
This is a simple model but particularly suitable for
data repositories used by analytical applications deal-
ing with huge amount of data. Indeed, row-oriented
databases are not adequate to deal with complex anal-
ysis of massive datasets because they are designed
for transactional processing. Thus, this approach is
not suitable in an analytical systems (for large scale
processing), because a lot of read operations are ex-
ecuted in order to access a small subset of attributes
in a big volume of data. In fact, transactional queries
are answered by (typically) scanning all the database
records, but processing only few elements of them.
On the contrary, in a column-oriented database all in-
stances of a single data element, such as account num-
ber, are stored together so they can be accessed se-
quentially. Therefore, aggregate operations such as
MIN, MAX, SUM, COUNT, AVG can be performed
very quickly.
Recently, NoSQL(Not Only SQL) approaches are
being used to solve the efficiency problems discussed
DATA2014-3rdInternationalConferenceonDataManagementTechnologiesandApplications
420

above. The rationale to develop and use NoSQL data
stores can be summarized as follows:
• Avoidance of Unneeded Complexity: Relational
databases provide a variety of features that how-
ever must obey strict data consistency constraints.
This rich feature set and the ACID properties im-
plemented by RDBMSs are manadatory while for
some application scenarios they could be disre-
garded;
• High Throughput: NoSQL databases provide a
significantly higher data throughput with respect
to traditional RDBMSs.
• Horizontal Scalability and Possible Running on
Commodity Hardware: In contrast to relational
database management systems, most NoSQL
databases are designed to scale well in horizontal
way and not rely on the hardware features;
• Avoidance of Expensive Object-Relational Map-
ping: Most of the NoSQL databases are designed
to store data structures that are either simple or
more similar to the ones of object-oriented pro-
gramming languages compared to relational data
structures. They do not make expensive object-
relational mapping no longer needed.
Non relational data stores are usually grouped ac-
cording to their data model:
1. Key-value Stores: These systems store values
along with an index based on the key defined by
users;
2. Document Stores: These systems store docu-
ments. A “document” can contain values that are
nested documents or list of values as well as scalar
values. Attribute names are dynamically defined
for each document at runtime. Documents are in-
dexed and a simple query mechanism is provided
through Javascript.
3. Column Family Stores: These systems store ex-
tensible records that can be partitioned vertically
and horizontally (eventually simultaneously on
the same table) across nodes, but generally do not
support secondary indexes. Rows are split across
nodes through sharding on the primary key, while
columns of a table are distributed over multiple
nodes by using the so called “column groups”.
4. Graph Stores: Provide efficient storage and
querying of a graph exploiting references among
nodes. Like for relational DBMS, these systems
usually support ACID transactions.
Systems belonging to categories 1,2 and 3 achieve
scalability by reading (potentially) out-of-date repli-
cas obeying the constraints fixed by CAP theorem. In-
deed, CAP theorem states that a system can exhibits
only two out of three of the following properties:
Consistency, Availability, and Partition-tolerance.
As usual in a distributed system, it is Consistent if
update operations performed by a writer can be seen
by all users on the shared data source. Availability
refers to the system design. In particular, a system is
available if it is designed and implemented in a way
that allows it to properly work operation (i.e. allow-
ing read and write operations) even if some node in
the cluster fails or some hardware or software com-
ponents are down due to maintenance operations. Fi-
nally, Partition-tolerance is the ability of the system
to work if the network is partitioned. The latter has
not to be confused with the ability of a system to cope
with the dynamic addition and removal of nodes. Due
to the complexity of a satisfactory trade-off usually
NoSQL systems smooth consistency constraints.
2.2 HBase
HBase is an open source, non-relational, distributed
database modeled as Google BigTable, it is devel-
oped in Java. More in detail, it is an Apache
project and runs on top of HDFS (Hadoop Distributed
Filesystem), providing BigTable-like capabilities for
Hadoop. That is, it provides a fault-tolerant way of
storing large quantities of sparse data. HBase main
features are:
• Quite good compression performances;
• in-memory execution of operation;
• Bloom filters on a per-column basis as in BigTable
specification.
Tables in HBase are used to perform Input and
Output for MapReduce jobs running on Hadoop,
and may be accessed through the Java API but also
through REST, Avro or Thrift gateway APIs. It is
worth noting that HBase is not a column-oriented
database in the typical RDBMS sense, but utilizes an
on-disk column storage format. Rows are composed
of columns, and those, in turn, are grouped into col-
umn families in order to build semantical or topical
boundaries between the data as shown in Fig. 1. Fur-
thermore, the latter data organization makes it pos-
sible to improve compression or specific in-memory
operation.
Columns are referenced as family having a qual-
ifier represented as an array of bytes. Each column
value (or cell) is either implicitly timestamped by the
system or can be set explicitly by the user. Rows in
the tables are sorted by a row key and this key pro-
vides access to information contained in the row. On
the other side, columns are grouped into column fam-
ilies and can be updated at runtime (by specifying the
DataPreparationforTouristDataBigDataWarehousing
421
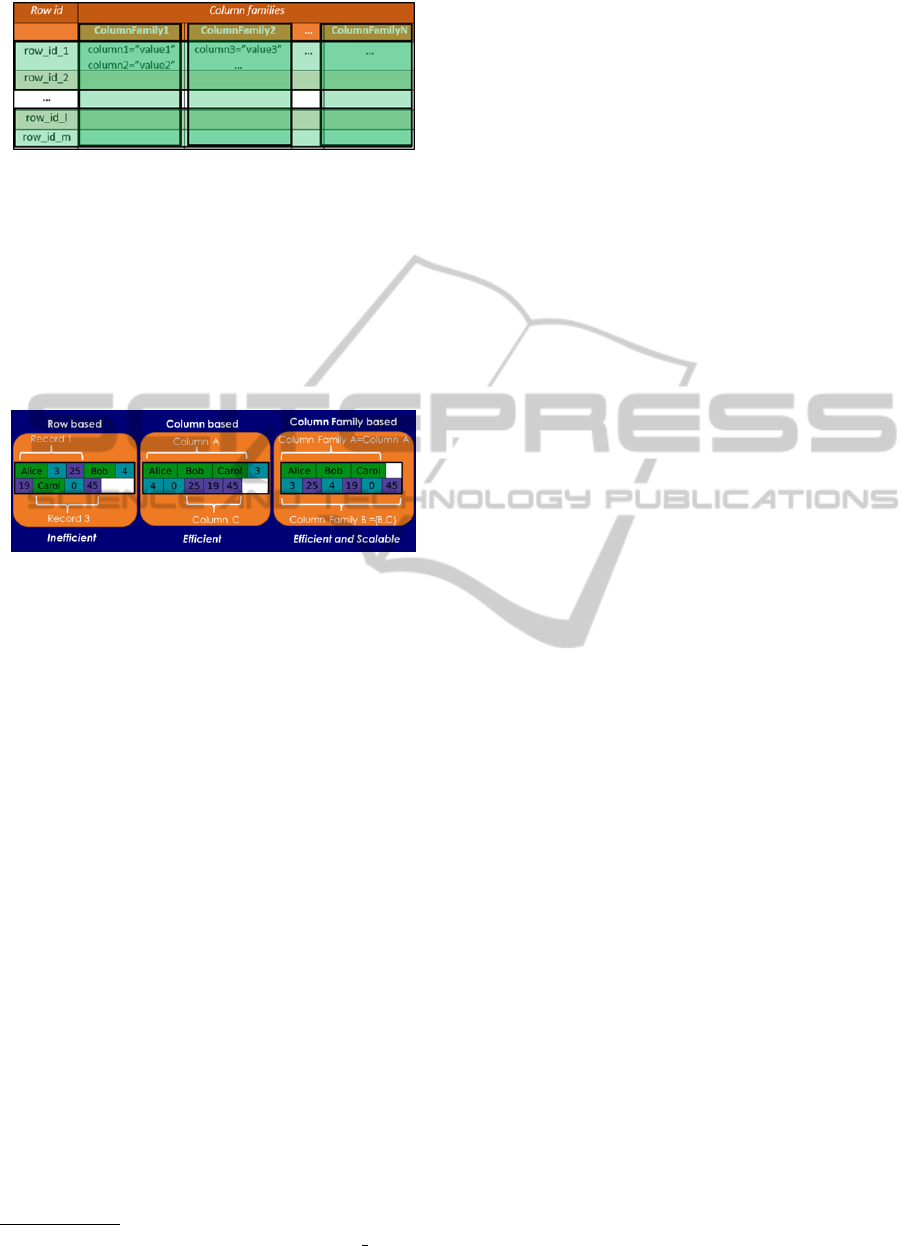
Figure 1: HBase storage organization.
column family through a prefix). Indeed, this model
turns to be efficient and scalable, thus well suited
for Big Data management as in this context a row
based approach is inefficient, simple column based
approaches are efficient but not scalable while column
family based approaches achieve both efficiency and
scalability. Fig. 2 summarizes the features and the
difference among the approaches.
Figure 2: Features of several storage models.
At the physical level, all columns in a column fam-
ily are stored together in the same low level storage
file, called an HFile. In addition to the notion of the
column, table and row, HBase uses the so called ”re-
gion”. In fact, the HBase tables are automatically par-
titioned horizontally into regions that are distributed
in the cluster. Each region consists of a subset of rows
of a table and in this way a table that is too large to
be contained in a server can be distributed in different
servers in the cluster.
2.3 The MapReduce Framework
MapReduce framework
1
is a programming model for
processing and generating large data sets. It basically
works by implementing two key function:
1. a map function that processes a key/value pair
to generate a set of intermediate key/value result
pairs, and
2. a reduce function that merges all intermediate val-
ues associated with the same intermediate key.
Many real world tasks can be solved using this
model, and algorithms that are MapReduce compli-
ant can be automatically parallelized and executed on
large computing clusters. In fact, the runtime system
1
https://hadoop.apache.org/docs/r1.2.1/mapred tutorial.html
takes care of the details concerning input data parti-
tioning, scheduling, machine failures handling, and
managing communication overhead.
Indeed, recently, a plethora of special-purpose
computational tasks have been implemented to pro-
cess large amounts of raw data, such as crawled doc-
uments, web request logs, to cite a few. These tasks
allow to compute many kind of derived data, e.g. in-
verted indices, representations of the graph structure
of web documents, summaries of the number of pages
crawled per host, the set of most frequent queries in a
given day.
2.4 Data Analysis Tools
A crucial component of our system is the On Line An-
alytical Processing module. Due to Big Data features,
we need to take care of several requirements. In or-
der to guarantee flexibility to our system, we chose to
exploit Pentaho BI suite free community edition. As
mentioned above, a crucial activity is the Extraction,
Transformation and Loading (ETL) of raw data be-
ing collected from several sources. In this respect,
Pentaho provides a suite for performing this task,
namely Pentaho Data Integration (PDI) (also referred
as Kettle (Kettle Extraction Transforming Transporta-
tion Loading Environment)). We describe here, in de-
tail, this solution as, it has been profitably exploited
in our prototype.
Each PDI task is based on the following sequence
of operations:
1. Step. It is used to represent both Input or Out-
put data. More in detail, every step performs a
specific task on its input datastream, such as data
manipulation, filtering or pattern matching;
2. Transformation. It is a wrapper for steps devoted
to perform operations such as data normalization
intended to prepare data for successive analysis;
3. Job. It is a sequence of transformations, that will
be run sequentially, according to user set up.
In order to assist users to specify the operation to
be performed, Pentaho, provides four additional tools
to design the ETL process based on user needs. In
particular it provides:
• Spoon: it is the main tool for ETL workflow
definition. It provides a graphical user interface
that allows a simple editing of Kettle operations.
Main features provided include the possibility of
extracting and storing data from wide range of
data sources (databases, spreadsheets, text files,
etc.), data manipulation with the possibility of us-
ing tasks with built-in functionality, custom tasks
eventually defined by the user through Java code
DATA2014-3rdInternationalConferenceonDataManagementTechnologiesandApplications
422
and JavaScript. Moreover, it performs data ag-
gregations that feed the data warehouse for later
usage by Mondrian;
• Pan: it is the tool that allows user to execute
transformations operations previously designed
by Spoon. Usually, operations are scheduled in
batch mode and executed according to a user de-
fined plan;
• Kitchen: allows you to run from the command
line with the Job defined by Spoon
• Carte: is an HTTP server for the execution of
transformations and jobs remotely. It runs on the
cluster and distributes the load on the resources.
As mentioned above, Mondrian is the OLAP
server provided by Penatho BI suite. It is based on
ROLAP technology, thus it translates MDX queries to
SQL based on a user defined multidimensional model
queried using Hive. It accesses information stored in
the data repository and perform aggregation opera-
tions that are then cached. It also makes extensive
use of materialized views to optimize the response
time. Finally, the BI suite also contains Schema Work-
bench (SW), that is a graphical tool for data cubes cre-
ation. The schema file is generated using a graphical
user interface. Schema Workbench produces as out-
put an XML file containing the definition of the cube
structure for OLAP analysis that will be performed
by Mondrian. Schema Workbench provides an inte-
grated environment in order to validate the specified
schema based on the source data specified during con-
figuration. Finally, Pentaho provides two options to
display data. You can use either JPivot, the built-
in tool, or Saiku, a plugin that offers several advan-
tages with respect to JPivot as it allows simple drag
and drop and deals with HTML5 and CSS in a flexi-
ble way. In the following section we briefly describe
main features of Hive, i.e. the query executor that we
exploited in our prototype.
2.4.1 Hive
Apache Hive is a Data Warehouse infrastructure built
on top of Hadoop that facilitates querying and man-
aging large datasets residing in a distributed storage.
Hive provides a mechanism to map the data struc-
ture on the storage layer in order to query data us-
ing a SQL-like language called HiveQL, which au-
tomatically translates SQL-like queries into Map Re-
duce jobs executed on Hadoop. A Hadoop cluster
is a collection of heterogeneous data, from multiple
sources and in different formats. Hive allows users
to explore data, analyze it, and then turning them to
business insight. For each database, tables are se-
rialized and each table is stored in a Hadoop Dis-
tributed File System (HDFS) directory. Data storage
is guided by two parameters: row format and file for-
mat. More in detail, row format influences the way
the rows, and their row fields, are stored. This opera-
tions is called SerDe (Serializer-Deserializer). Dese-
rialization is performed when querying a table, thus
SerDe will deserialize a data row from the bytes con-
tained in the file using the object type defined by Hive
to operate on that row. On the contrary, when per-
forming an INSERT, serialization is required. In this
case, SerDe will serialize Hive internal representation
of a data row into the bytes to be written to the out-
put file. The file format defines types associated to
fields in a row. The simplest format is a plain-text
file, but there are row-oriented and column-oriented
binary formats available, too. In order to speed-up
queries, Hive provides indexes, including bitmap in-
dexes that allows response times faster than the ones
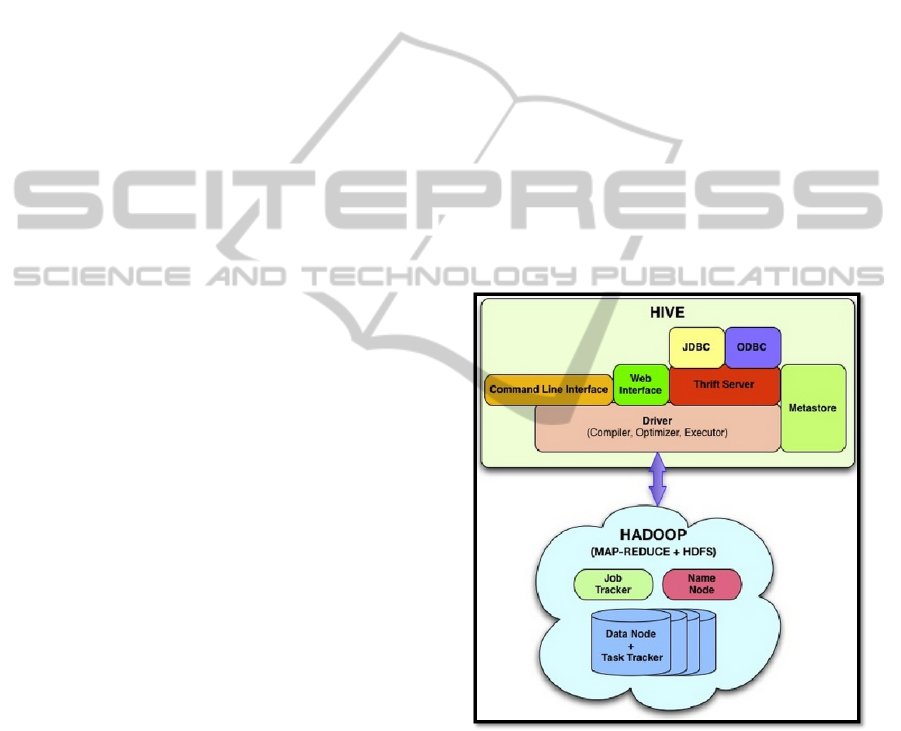
obtained with other tools. Finally, Hive achieves good
scalability due to its storage model. The overall archi-
tecture is reported in Fig. 3
Figure 3: Hive Architecture.
3 SYSTEM ARCHITECTURE
In this section we present the architecture of our
analysis engine. It effectively exploits the column-
oriented storage model, the scalability of NoSQL sys-
tems and the Mondrian OLAP server. More in detail,
the system depicted in Fig. 4 is composed by three
modules:
1. Mondrian as OLAP Server
DataPreparationforTouristDataBigDataWarehousing
423
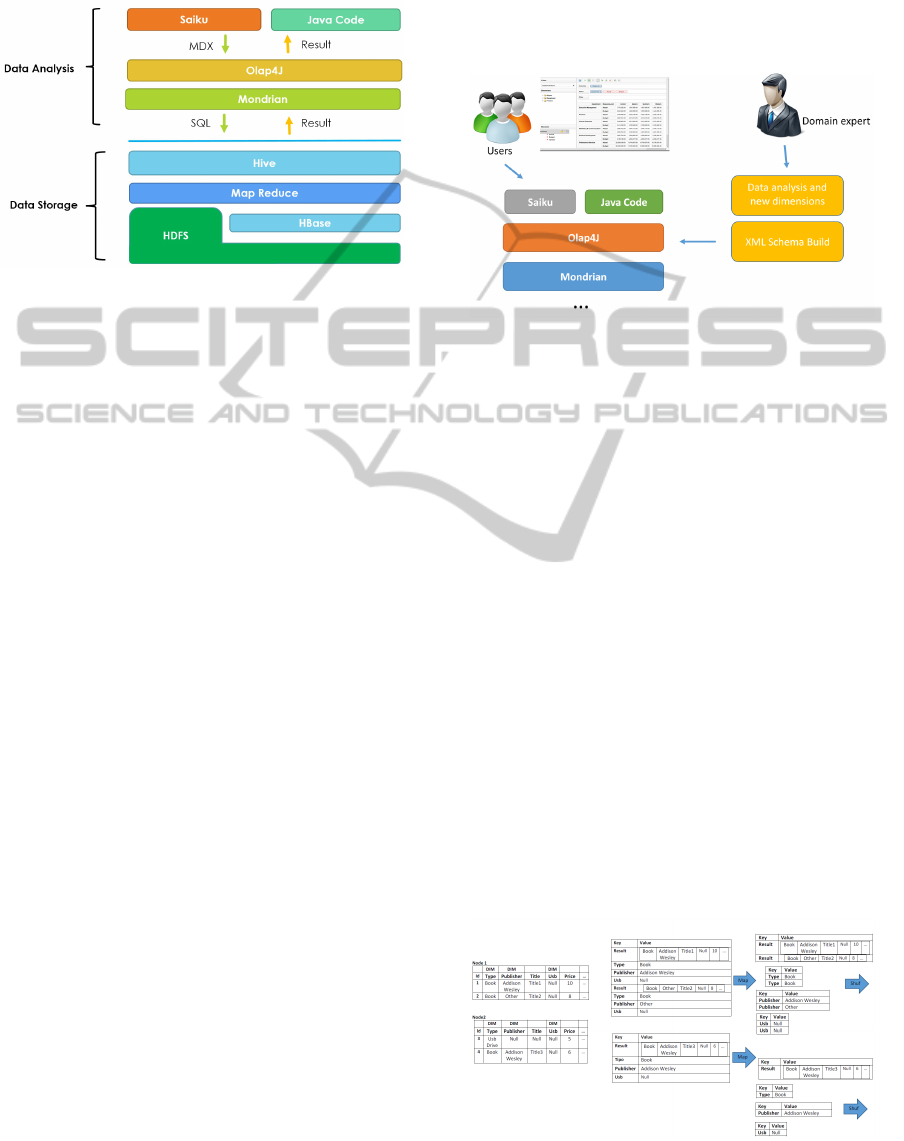
2. Hive as Query Executor on Hadoop MapReduce
3. HBase as NoSQL Data Storage
Figure 4: Big Data Analysis Module architecture.
We choose to combine Mondrian and Hive in or-
der to guarantee the distributed processing of queries
across multiple nodes of our cluster composed of 20
(sixteen core each) nodes. We take also advantage
of the usage of SQL as a common language for both
sub-systems.
Moreover, the combined use of HBase and Hive
allows to overcome some speed limitations of Hive
thus accelerating data access and querying. The latter
is obtained by exploiting HBase main features such as
vertical partitioning into Column Families, horizontal
partitioning into Regions, replication, realtime access
and indexing. We point out here that the integration
of these systems is far from being trivial as we need to
take into account the different features of each mod-
ule.
As regards the OLAP analysis, Mondrian issues
SQL queries to Hive that translates them into MapRe-
duce jobs. Then, jobs access data, stored in HBase,
through a JDBC driver. It also performs the mapping
of SQL commands to HBase commands (e.g. get, put,
scan, delete).
In order to guarantee scalability, Mondrian pro-
pose two different solutions. The first solution is
based on the so called aggregate tables. These ta-
bles contains pre-aggregate data. As an example, sup-
pose that the system stores information about sales at
hourly granularity level, but manager is interested to
perform analysis having daily and weekly granularity
level. We can create an aggregate table storing in-
formation at those granularity levels. The latter will
result in a reduced size of data being returned when
querying the repository.
A second approach is based on caching. Indeed,
Mondrian allows to cache schema, members, and seg-
ments (the objects used for aggregating data). This
means that as data are queried they are materialized.
The proposed architecture provides a complete
tool for Big Data analysis that allows user to spec-
ify queries in a simple way disregarding the complex-
ity of the data acquisition and cleaning that are per-
formed in background with the guide of a domain ex-
pert as shown in Fig. 5.
Figure 5: Our simplified workflow.
3.1 Intelligent Data Filtering Example
Our main contribution is the development of an in-
telligent filtering approach to Big Data. Indeed, the
availability of such a tool is crucial in many applica-
tion scenarios in order to suggest users valuable infor-
mation(IBM et al., 2011; Herodotou et al., 2011). We
exploit map-reduce approach in order to explore data
in a smart and faster way (Jiang et al., ). We show
in the following an illustrating example instead of de-
scribing the technical details of the query processing
to be performed. Consider a book store selling tourist
books whose information system is distributed over
several nodes. For each book, information related to
title, publisher, support type, authors are stored. Man-
agers would like to understand which dimensions are
relevant for performance analysis about selling. In
this respect, they initially identify dimensions, Type,
Publisher and Usb as relevant. Based on this expert
input, we perform a map task as reported in Fig. 6 and
then a reduce step as shown in Fig. 7, with the goal of
refining the initial information.
Figure 6: Map.
DATA2014-3rdInternationalConferenceonDataManagementTechnologiesandApplications
424
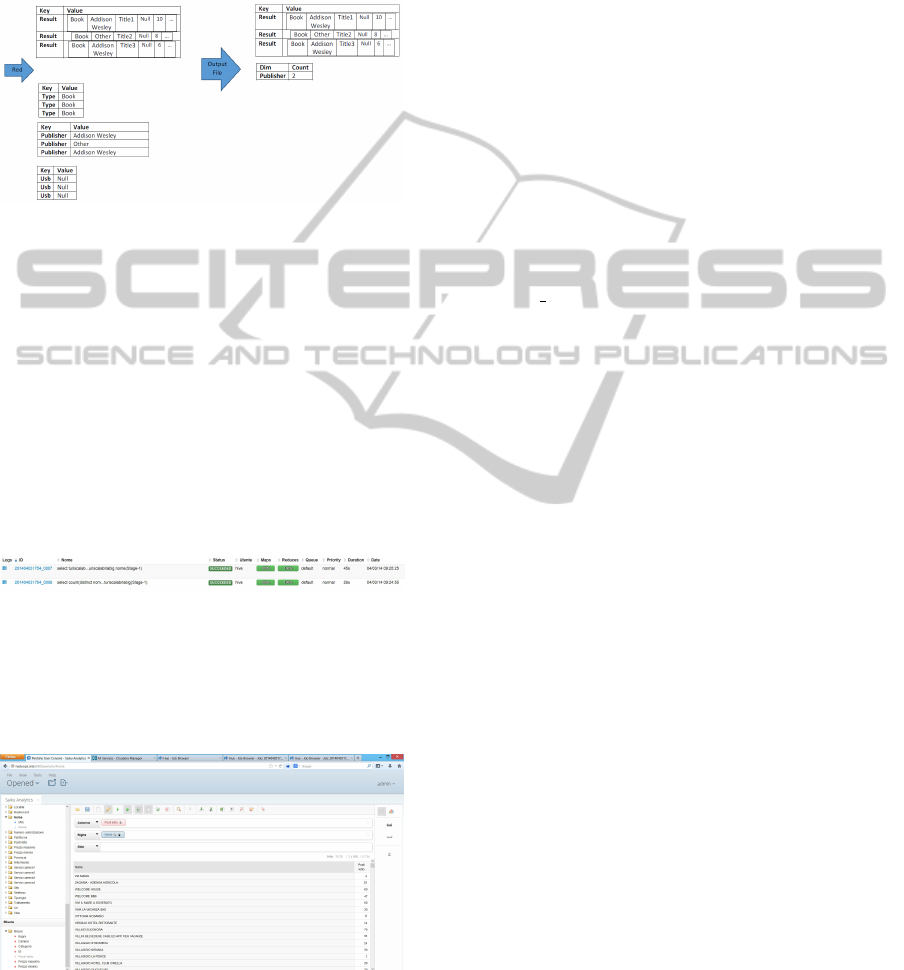
As it is easy to see, information gathered about the
dimension count allow to suggest that dimension Usb
is useless for analysis purposes. This approach, can
be profitably exploited in all system where efficient
analysis of data distributed over nodes is mandatory
for decision support.
Figure 7: Reduce.
3.2 Preliminary Analysis
Indeed, preliminary tests performed on early data
available are quite encouraging. More in detail, the
efficiency achieved with our approach is quite satis-
factory. In Fig. 8 we show the execution report of
two aggregate queries issued on a test set of 240M tu-
ples. As it is easy to see, the results are returned very
quickly. In particular, first query that does not use any
filter to count tuples took 45 seconds while the second
one that computes a sum and group by took only 26
seconds.
Figure 8: Query execution report.
Finally, due to the overall goal of our project, we
provide results in a user friendly way, i.e. user may
specify dimensions by simply drag and drop and nav-
igate through the returned results as shown in Fig. 9.
Figure 9: A query issued on our system.
4 CONCLUSION
In this paper we presented a framework for end-to-end
analysis of Big Data tourist information. We provided
an effective tool to fully manage Big Data life cycle in
the target scenario, from the data loading to the data
analysis. Preliminary results confirm the validity of
our approach both in term of usability by non-expert
users and efficiency of the query processing. As a fu-
ture work we plan to develop a novel data filtering
technique intended to assist users in the discovery of
new dimensions induced by data. The latter will heav-
ily improve the analysis task.
ACKNOWLEDGEMENTS
This work was supported by MIUR Project
PON04a2 D DICET INMOTO Organization
of Cultural Heritage for Smart Tourism and REal
Time Accessibility (OR.C.HE.S.T.R.A.)
REFERENCES
Agrawal, D., Bernstein, P., Bertino, E., Davidson, S., Dayal,
U., Franklin, M., Gehrke, J., Haas, L., Halevy, A.,
Han, J., Jagadish, H. V., Labrinidis, A., Madden, S.,
Papakonstantinou, Y., Patel, J. M., Ramakrishnan, R.,
Ross, K., Shahabi, C., Suciu, D., Vaithyanathan, S.,
and Widom, J. (2012). Challenges and opportuni-
ties with big data. a community white paper devel-
oped by leading researchers across the united states.
http://cra.org/ccc/docs/init/bigdatawhitepaper.pdf.
Agrawal, D., Das, S., and El Abbadi, A. (2011). Big
data and cloud computing: Current state and future
opportunities. In Proceedings of the 14th Interna-
tional Conference on Extending Database Technol-
ogy, EDBT/ICDT ’11, pages 530–533, New York,
NY, USA. ACM.
Herodotou, H., Lim, H., Luo, G., Borisov, N., Dong, L.,
Cetin, F. B., and Babu, S. (2011). Starfish: A self-
tuning system for big data analytics. In In CIDR,
pages 261–272.
IBM, Zikopoulos, P., and Eaton, C. (2011). Understanding
Big Data: Analytics for Enterprise Class Hadoop and
Streaming Data. McGraw-Hill Osborne Media, 1st
edition.
Jiang, D., Chin, B., Lei, O., and Wu, S. S. The performance
of mapreduce: An in-depth study.
Labrinidis, A. and Jagadish, H. V. (2012). Challenges and
opportunities with big data. PVLDB, 5(12):2032–
2033.
Lohr, S. (2012). The age of big data. http://www.
nytimes.com/2012/02/12/sunday-review/bigdatas-
impact-in-the-world.html.
DataPreparationforTouristDataBigDataWarehousing
425

Manyika, J., Chui, M., Brown, B., Bughin, J., Dobbs, R.,
Roxburgh, C., and Byers, A. H. (2011). Big data: The
next frontier for innovation, competition, and produc-
tivity. McKinsey Global Institute.
Noguchi, Y. (2011a). Following digital breadcrumbs
to big data gold. National Public Radio,
http:// www.npr.org/2011/11/29/142521910/the-
digitalbreadcrumbs-that-lead-to-big-data.
Noguchi, Y. (2011b). The search for analysts to
make sense of big data. National Public Ra-
dio, http://www.npr.org/2011/11/30/142893065/the-
search-foranalysts-to-make-sense-of-big-data.
WWW1 (2008). Big data. nature. http://www.nature.
com/news/specials/bigdata/index.html.
WWW2 (2010). Data, data everywhere. the economist.
http://www.economist.com/node/15557443.
WWW3 (2011). Drowning in numbers digital
data will flood the planetand help us under-
stand it better. the economist. http://www.
economist.com/blogs/dailychart/2011/11/bigdata-0.
DATA2014-3rdInternationalConferenceonDataManagementTechnologiesandApplications
426
