
Towards a Data Model of End-User Programming of Applications
Marko Palviainen
1
, Jarkko Kuusijärvi
2
, Timo Tuomisto
3
and Eila Ovaska
2
1
Digital Systems and Services, VTT Technical Research Centre of Finland, P.O. Box 1000, FI-02044, Espoo, Finland
2
Digital Systems and Services, VTT Technical Research Centre of Finland, P.O. Box 1100, FI-90571, Oulu, Finland
3
Digital Systems and Services, VTT Technical Research Centre of Finland, P.O. Box 1300, FI-33101, Tampere, Finland
Keywords: Data Model, Tiles4Data Data Model, End-User Programming, Post-Processing of Data.
Abstract: End-user programming produces applications that can produce and/or consume data. An end-user can be a
software enthusiast or non-programmer. In this paper end-users are understood to be non-programmers that
are interested in creating applications for their personal needs and daily tasks. An interesting research
question is how the input and output data of end-users’ applications should be represented? What kind of a
data model is needed for this data? And how this input and output data can be utilised? Firstly, the data
model should be designed for end-users so that the data model is easy to comprehend and utilise by non-
programmers. Secondly, the data model should be suitable for SW professionals that make functionalities
available for end-user programming. Thirdly, the data model should be designed so that it is possible to
provide reusable processing components for input/output data represented via this model. This paper
discusses these three research questions and outlines a data model, called the Tiles4Data data model that is
designed for the above requirements.
1 INTRODUCTION
There is a strong trend towards integration of the
capabilities and data of separate software systems.
The Internet of Things (IoT) (Fielding, 2000)
technologies enable creation of interoperable
devices, applications, and digital services being
capable of interacting across vendor and industry
domain boundaries. In addition, there will be more
and more smart spaces that enable users to share
information, to monitor their environment and to
control it. In United States and Europe the public
sector is continuously opening computer-readable
data (for example, geographical data, weather data,
and environmental data) to be used freely for
commercial and non-commercial use (Auer et al,
2007; Poikola et al, 2011). Furthermore, open
source, OpenStreetMap, Wikipedia, and social
media communities provide open data.
There are (at least) two perspectives to data, i.e.,
who produces it and who consumes it. In addition,
three common needs relate to the use of data; the
users want to i) see what is in the data (i.e., need
visualisations for the data), ii) share data for other
users and iii) monitor the interesting changes/trends
in the data. A software system can be designed for
these needs but at the implementation phase it is
almost impossible to identify all the needs of various
users and the needs that will possibly arise in the
future. Thus, there is a strong need for End-User
Programming (EUP) that enables the users to tailor
the software systems for their needs and daily tasks.
In our vision, the end-users will be involved in the
integration of capabilities and data: a) The
capabilities and data of the existing software systems
are opened for end-user programming by using IoT
and smart space technologies. b) The opened data is
represented via a uniform data model supporting the
interoperability of data and interoperability of
configurable components processing the data. There
will be two kinds of data: professional data and end-
user data. Professional data are represented via data
models that software professionals can use and
comprehend. The end-user data are data that: a) are
understandable and interesting for end-users and b)
are represented via data models that are designed for
end-users.
As a contribution, this paper outlines the
Tiles4Data data model for EUP that: a) Is based on
the basic concepts such as number, time and location
that the end-users use in their everyday life, b)
provides a simple set of data primitives and data
composites and means for SW professionals to open
data for EUP and c) finally enables the easy use of
data for non-programmers. This paper focuses on
data relating to the EUP of cross-smart space
applications (see details from Palviainen et al, 2012,
272
Palviainen M., Kuusijärvi J., Tuomisto T. and Ovaska E..
Towards a Data Model of End-User Programming of Applications.
DOI: 10.5220/0005109602720281
In Proceedings of 3rd International Conference on Data Management Technologies and Applications (DATA-2014), pages 272-281
ISBN: 978-989-758-035-2
Copyright
c
2014 SCITEPRESS (Science and Technology Publications, Lda.)

2012b and 2014). The Tiles4Data data model creates
the following added value for its users:
Domain data – The data that experts and
professionals of a specific domain produce and
use. The drivers based on the Tiles4Data
provide this data available for end-users.
Driver specifications – The data model provides
a standard model to provide Semantic End-User
Application Programming Interfaces (S-APIs),
drivers and driver environments available for
EUP.
End-user’s applications – The data model
provides a standard model to describe the end-
user’s applications produced by EUP tools.
Output data – The data model provides a
standard way for an application to publish
output data.
Input data – The data model provides a standard
way for an application to consume input data.
The added values the Tiles4Data data model
provides are: 1) The systematic way to create
reusable and configurable drivers that visualise the
S-APIs and application scripts to end-users. 2) The
systematic way to process data, visualise data, share
data and monitor data relating to the execution of an
end-user’s application.
This paper is structured as follows. Section 2
describes background related to the Tiles4Data data
model, Section 3 describes the design of the
Tiles4Data data model and then Section 4
exemplifies the use the Tiles4Data data model.
Discussion related to the approach is provided in
Section 5. Finally, conclusions are drawn in Section
6.
2 BACKGROUND
In the beginning of the history of electricity
appliances the lack of standards of electricity
voltages and electricity frequencies caused problems
for electricity producers, consumers and device
manufacturers. Over time the 230 V standard has
become widespread so that 230 V equipment can be
used in most parts of the world with the aid of an
adapter or a change to the equipment's connection
plug for the specific country (Wikipedia, 2014). The
situation in the information age data is like in the
electricity appliances in the beginning, there are no
generic standards for data but a huge number of
different kinds of data formats are used in the
software systems causing problems for data
producers, data consumers and the developers of
applications and digital services. For example,
handling of various data formats causes
dependencies between the client code and legacy
software components and makes it more difficult to:
Implement reusable processing components for the
data and replace the software components with new
ones. Thus, there is a great need for data models
standardising the representation of data. The rest of
this section discusses the terminology used in this
paper, the models used in the representation of data,
open data and open APIs and the existing EUP
approaches.
Terminology
2.1
The following terminology is used in this paper (part
of the terms are taken from (Palviainen et al, 2012,
2012b and 2014)):
Professional API – An API that is targeted for
programmers and for the software development.
S-API – The S-API describes capabilities
(commands) and the inputs, outputs and execution
branches of the commands and assists the use of
professional APIs by providing easy access to the
information/operational capabilities that are
available in the professional APIs.
Driver – implements S-API and makes the
capabilities and data of professional APIs available
for end-user programming. A driver is a reusable
and configurable processing component that can
process data, visualise data, share data and monitor
data in the application execution phase or in the
post-processing phase.
Driver specification – A driver specification
defines a symbolic name, an S-API and possibly a
run-time identifier (URI) for a driver.
Application script – An end-user’s application is
described as an application script consisting of
driver specifications and execution sequences
(commands) that are executed in the application
execution phase or in the post-processing phase.
Data Models
2.2
The World Wide Web has been originally designed
for direct human processing. In order to better
support machine processing there has been
developed the next-generation Web, called Semantic
Web for establishing semantic interoperability on
the Web and for enabling construction of intelligent
and interoperable services — such as information
brokers, search agents, and information filters —
which offer greater functionality than the current
stand-alone services (Decker et al, 2000).
Extensible Mark-up Language (XML) (W3C,
2000) and Resource Description Framework (RDF)
(W3C, 2004) standards support establishing of
semantic interoperability on the Web, but XML
addresses only document structure. RDF better
TowardsaDataModelofEnd-UserProgrammingofApplications
273

facilitates data interoperation, representation and
exchange by providing a data model that can be
extended to address sophisticated ontology
representation techniques (Decker et al, 2000).
Furthermore, languages such as SPARQL (W3C,
2008) and N3 (Berners-Lee and Conolly, 2011) can
be used in description of queries for semantic data.
The Gleaning Resource Descriptions from Dialects
of Languages (GRDDL) is a mark-up based on
existing standards: for declaring that an XML
document includes data compatible with the RDF
and for linking to algorithms (typically represented
in XSLT) that are capable of extracting this data
from the document (Bodle, 2011). JavaScript Object
Notation (JSON) is a lightweight data-interchange
format that is easy for humans to read and write and
is easy for machines to parse and generate (JSON,
2014).
Linked Data has the potential to enable a
revolution in how data is accessed and utilised
(Berners-Lee et al, 2009). The success of Web APIs
has shown the power of applications that mash up
content from different Web data sources. However,
application developers face the challenge of scaling
their development approach beyond fixed,
predefined data silos, to encompass large numbers of
data sets with heterogeneous data models and access
methods (Berners-Lee et al, 2009).
The described techniques support representation
of data but are not designed for end-users since the
use of these techniques requires technical knowledge
and typically only SW professionals can use them.
Open Data and Open APIs
2.3
The idea of open data is to make data or part of data
freely available to everyone to use and republish as
they wish, without restrictions from copyright,
patents or other mechanisms of control (Auer et al,
2007). In United States, Great Britain and other parts
of Europe there is a clear tendency to increase the
utilisation of open data (Poikola et al, 2011). For
example, the European Union (EU) has INSPIRE
directive (Inspire, 2014) that tends to create an
environmental spatial data infrastructure across
Europe and enable the public access to this data.
The more lightweight business model of Web
2.0 companies emphasizes the “read/write” Web.
Significant content flows both upstream and
downstream from the site’s users and therefore users
are both purchasers and contributors (Greaves,
2007). This business model also often includes open
APIs that let companies share their data and leverage
others’ data. Thus, open APIs provide new ways of
sharing and participating and support
interoperability by providing the tools to share data
used to develop Web applications, achieve seamless
integration of social media services, and give rise to
mutually beneficial third-party developer
ecosystems that build on top of social media
platforms (Bodle, 2011).
The open data and open APIs are now more
targeted for software professionals and software
enthusiasts. There is a clear need for approaches
providing the open data and capabilities of open
APIs available for EUP of applications.
End-User Programming
2.4
The EUP methods aim at bridging the gap between
the use and programming of applications (Mørch,
1998; Mørch et al, 2004). For example, the
programming-by-example (Hartmann et al, 2007),
visual programming (Kovatsch, 2010), script-based
creation (Ousterhout, 1998), repository-based
creation (Miller, 2003), and tailoring of applications
techniques (Won et al, 2006) are introduced for
EUP.
We have developed an end-user programming
approach (Palviainen et al, 2012, 2012b and 2014)
supporting interoperability of smart spaces and
creation of cross-smart space applications. The
approach is based on easy-to-apply S-APIs and on
driver specifications that are first added to the
application to define the drivers that are used in the
application. The execution sequence is then
composed of the commands of the specified drivers.
Unlike professional APIs, the S-API does not just
define operations and the inputs and outputs of
operations but structures, i.e., commands that also
describe the execution branches to which the end-
users can bind other commands. Thus, the end-user
does not need to use if-else structures in
programming; but the “if” is implemented inside a
command, whereas the execution branches define
the “then” branches to which the end-user can insert
other commands. In addition, end-users can easily
tailor applications for new purposes by inserting
commands to the execution branches that relate to
the commands of an application. This paper extends
our EUP approach by outlining how the data related
to EUP should be represented so that end-users
could benefit from this data in the EUP and
execution phases of applications.
3 THE DESIGN OF THE
Tiles4Data DATA MODEL
The Tiles4Data data model is depicted in Figure 1. It
is designed for the representation of data relating to
our EUP approach (Palviainen et al, 2012, 2012b
and 2014) that consists of four main steps: a) The
DATA2014-3rdInternationalConferenceonDataManagementTechnologiesandApplications
274
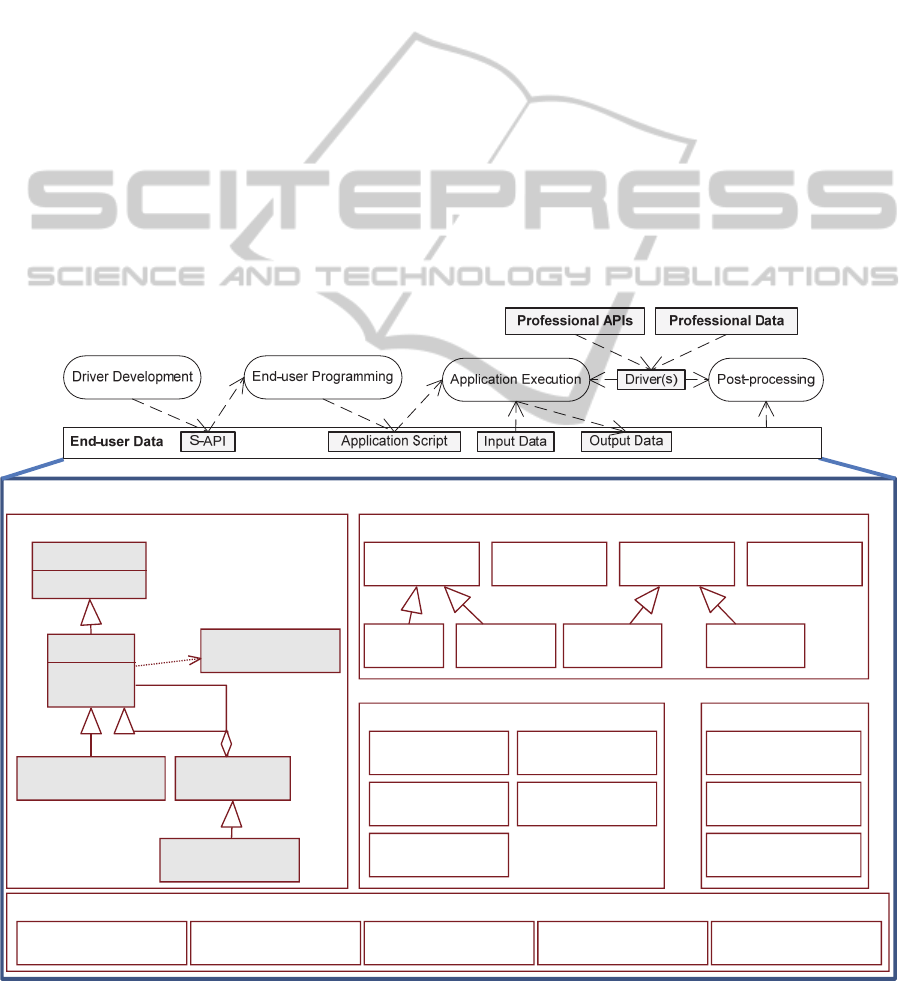
driver development, b) end-user programming, c)
application execution and d) post-processing steps.
The SW professionals are responsible for the driver
development, producing S-APIs and drivers that
open the professional data and capabilities of
professional APIs to end-users. Application’s input
data and output data can contain domain data and
data about the user’s preferences, user’s context
(e.g., user’s location), user’s input, execution path of
the application and errors related to the application
execution. The post-processing of this data is based
on drivers, too. Thus, the same driver components
can be used in the application execution and post-
processing phases. The use of a driver in post-
processing requires that it is connected to a smart
space that is used in post-processing. The end-user
can then see the driver’s capabilities in the EUP tool,
select the capabilities for post-processing and
configure the inputs of the selected capabilities for
using the capabilities for various purposes and for
various kinds of data.
The next subsections discuss the design of the
Tiles4Data data model (in Figure 1) from two
viewpoints: from the software professional’s
viewpoint and end-user’s viewpoint. However, these
viewpoints overlap and many of the presented issues
are related to the both viewpoints.
Viewpoint 1 – Software
3.1
Professionals
The Tiles4Data data model must be suitable for SW
professionals that develop S-APIs and drivers for
end-user programming. Thus, it must support:
Representation of Interesting Data – The data
model should enable easy: a) use of data and b)
representation of data that is interesting for end-
users and used in the everyday life of end-users. We
used the composite pattern (Gamma et al, 1995) and
data types of the existing programming languages
such as Java and C++ as a starting point in the
design of the Tiles4Data data model. In order to
make the learning curve smoother for non-
programmers, the data is described by using a small
number of easy-to-apply data elements that are
Figure 1: The elements of the Tiles4Data data model are used for describing the end-user data.
Tiles4Data DataModel
Content-References
Cross-References
Data Primitives
Data Composites
Core Elements
Tiles4Data
+Name
+DataType
AdditionalData
<<DataCollection>>
DataCollection
<<Tiles4Data>>
CrossReference
<<DataCollection>>
Content-Reference
<<Tiles4Data>>
Text
<<Tiles4Data>>
Boolean
<<Tiles4Data>>
Number
<<Tiles 4Data>>
Range
<<Tiles4Data>>
Unit
<<Text>>
Duration
<<Number>>
BeginTime
<<Number>>
GPSLocation
<<Text>>
List
<<DataCollection>>
Image
<<Content-Reference>>
Route
<<DataCollection>>
Cell
<<DataCollection>>
Table
<<DataCollection>>
WebPage
<<Co ntent-Reference>>
Audio
<<Content-Reference>>
Video
<<Content-Reference>>
ContentLink
<<Co ntent-Reference>>
List Section
<<Cross-Reference>>
Table Section
<<Cross-Reference>>
Route Section
<<Cross-Reference>>
DomainData
+DomainType
Guidance
<<DataCollection>>
TowardsaDataModelofEnd-UserProgrammingofApplications
275

based on concepts such as number, time, and
location that the users use in their everyday life. The
use of composite pattern enables easy creation of
hierarchical data structures i.e., the data primitives
and data composites can be composed to other data
composites. The Tiles4Data data model contains 8
primitive types and 5 composite types. Primitive
types are: Text, Boolean, Number, Range, Unit,
Begin Time, Duration, and GPS Location.
Composite types are List, Table, Cell, Route and
Guidance.
Representation of Interesting Fragments of Data
– Often only a small fraction of the available data is
interesting for the user. For a programmer it is easy
to write a small snippet of code extracting the data
from the data structure but how could a non-
programmer use only small fractions of the data?
One possibility is to put (at least) a part of the
burden of data selection for the SW professionals
that open data for EUP. For this purpose there are
provided cross-reference elements that do not
contain data but: i) refer to elements of data
collections that could provide interesting data for the
end-user, ii) define a descriptive name for the
referred data and iii) thus assists the use of
interesting fragments of data in the drivers. The
cross-reference element types of the Tiles4Data data
model are: List Section, Table Section and Route
Section.
Representation of Interesting Content related to
Data – In many cases streamed content such as
textual, image, audio, and video content could add
value to the provided data. In cross-smart space
applications, the streamed content is not directly
transported between the smart spaces and drivers but
this kind of content is embedded in the data model
by using the content-reference elements that refer to
(i.e., specify URLs for) the streamed content. The
content-reference element types of the Tiles4Data
data model are: Web Page, Image, Audio, Video and
Content Link.
Adding Value to the Data – Meta-data and
quality information of data will increase the value of
data (Immonen et al, 2014 and 2014b). It is possible
to add additional data (e.g., meta-data, cross-
reference elements, content-reference elements and
guidance elements) to each data element of the
Tiles4Data data model to enhance the usability/value
of the provided information and guide the end-users
in the use of data. The additional data can provide a
textual description for the data, describe the origin of
the data, or even provide a reference to a preview
image that a default visualization component has
produced for the data.
Evolution of Data – Often in software
development projects it is difficult to create data
structures to cover all possible use cases. In addition,
this will lead to a more and more complex data
models that: Will evolve over the time and are
difficult to maintain and use. The Tiles4Data domain
data models consist typically of few elements and
the structures of data models do not evolve over
time. However, it is easy to add additional data to
the models and to ensure the backward compatibility
of the models, i.e., the data that was available in the
previous data model will exist in the extended data
model, too. If a completely new data model is
needed, a new model and domain type (URL) must
be defined for the new domain data model.
Transportation of Data – The prototype of the
Tiles4Data data model is implemented in Java. The
GSON library (GSON, 2014) is capable of
converting Java objects to JSON and vice-versa. We
used the GSON and implemented toolkits for
Tiles4Data to JSON and for JSON to Tiles4Data
conversions. Thus, the Tiles4Data data can be
exported to JSON format, transported to other
drivers that finally import the data from the received
JSON objects.
Viewpoint 2 – End-Users
3.2
The Tiles4Data data model is designed to assist the
use of data in the EUP and application execution
steps. The Tiles4Data data model supports:
Selection of Interesting Data – In order to
support selection of data elements, each Tiles4Data
data element has a data type (e.g., text, number or
table). A name and domain type can also be defined
for the data elements. The names, data types, domain
types and cross-reference elements support the
selection of data; the drivers can be configured to
select data that has a particular name, data type,
and/or domain type.
Selection of Drivers – The data type and domain
type are used in the selection of drivers. For
example, a visualisation driver could take only data
collections as an input.
Validation of the Output-Input Connections of
Drivers – The EUP tool uses the data types and
domain types of the Tiles4Data data for type
checking for ensuring that only compatible output-
input connections are created; the tool that can either
prevent creation of invalid output-input connections
or then warn the end-user about invalid output-input
connections (e.g., visualise invalid connections with
a red colour).
Visualisation and Browsing of Data – Often the
use of data requires visualisations for the data. It is
easy to implement drivers to provide visualisations
for the hierarchical Tiles4Data data that enable the
end-user to browse the data and to see what kind of
data is available. Application scripts, S-APIs, driver
specifications, and application’s input data and
DATA2014-3rdInternationalConferenceonDataManagementTechnologiesandApplications
276

output data are represented as Tiles4Data data, too.
As a benefit, in the EUP phase it is easy to provide
visualisations for: a) application scripts to assist the
user to comprehend what happens inside an
application and thus assists the selection and
tailoring of an application, b) S-APIs to assist in
searching and understanding of the capabilities and
data provided in S-APIs, and c) driver specifications
to assist the searching of drivers for different
purposes.
Sharing of Data – The sharing data for other
applications and users is based on drivers that are
capable of: a) publishing Tiles4Data data to shared
databases and b) querying/fetching Tiles4Data data
from the shared databases.
Monitoring of Data – This is based on the
drivers that monitor the execution environment,
react to the changes in the environment and inform
the user about the changes in the Tiles4Data data.
4 EXAMPLE – THE USE OF
Tiles4Data DATA MODEL FOR
ELECTRICITY DATA
This section exemplifies how the Tiles4Data data
model can be used in the representation of domain
data and how the reusable drivers can process,
visualise, share, and monitor the Tiles4Data data in
the application execution phase.
Creation of a Tiles4Data Data
4.1
Model
The Nord Pool Spot (Nord Pool Spot, 2014)
provides electricity spot price data (open data) via a
Web Service. We decided to implement a driver for
the Nord Pool Spot and by this way opened the
service’s capabilities and data for EUP.
In the driver implementation, we first created a
representation for electricity price of the Tiles4Data
elements in Java. The electricity spot price data is
represented as a table containing number primitives
(see Figure 2). Each number primitive provides
additional data that defines the unit (cents / kWh) for
the number and time when the data value is valid
i.e., begin time and duration for the value in
milliseconds. The EUP tool must represent the time
values in more user-friendly way, for example, “the
begin time is “28
th
May 2014 4 pm”. The name of
the electricity producer text element and the
“Electricity Prices for Last Day” and “Electricity
Prices for Last Night” cross-reference elements were
added as an additional data to the table. As a result,
it is easy for the end-user to configure a visualizer
driver to represent “Electricity Prices for Last Day”
in a line diagram because (s)he does not need to
exactly define the cells providing the data in
question. Moreover, the end-user could, for
example, use the time values of the data to limit the
visualized price information for a given day. A
WebPage element was added as a guidance element
to provide a URL link to the Nord Pool Spot market
place.
Secondly, we used a transformer tool for
transforming the created Tiles4Data data model into
a Java class offering direct methods to assist the use
of the data elements of the Tiles4Data data model in
the drivers. Thirdly, we defined an S-API for the
driver and transformed a driver skeleton from the S-
API and finally implemented the actual driver code
in Java. The driver contains the getElectricityPrice
command that reads electricity price data form the
Nord Pool Spot, represents this data via the
Tiles4Data data model, and finally provides the
electricity price data as an output.
Processing of the Tiles4Data Data
4.2
We have an early stage prototype for the browsing
view of the Tiles4Data data that enables the user to
see what kind of data is available and configure the
processing parameters for the data. An example of a
very simple reusable and configurable processing
component is a driver that calculates the average
(i.e., creates a new representation for the data) of the
numbers existing in a table. The user must configure
the inputs of the driver to define that the average is
calculated from the number elements (that are
produced in the execution of an application) whose
domain type is
“http://electricity.com#ElectricityPrice”. The driver
represents the calculated average as a Tiles4Data
number whose domain type is “http://electricity.com
#ElectricityPrice”. In addition, the user can
configure that additional data is attached to the
produced Tiles4Data number to define a unit (cents /
kWh) for the average number.
Visualisation of the Tiles4Data
4.3
Data
The visualisation of data is based on reusable drivers
that can be configured to produce (e.g., diagram, tree
and table) visualisations for the whole data or only
for the data elements of cross-references, or for the
specific kind of elements (selection is based on the
data types or domain types) of the data model.
Figure 3 depicts diagram, bar and tree visualisations
for hourly electricity price data, electricity use and
electricity costs. The visualisations are produced by
using a configurable driver that is capable of
TowardsaDataModelofEnd-UserProgrammingofApplications
277
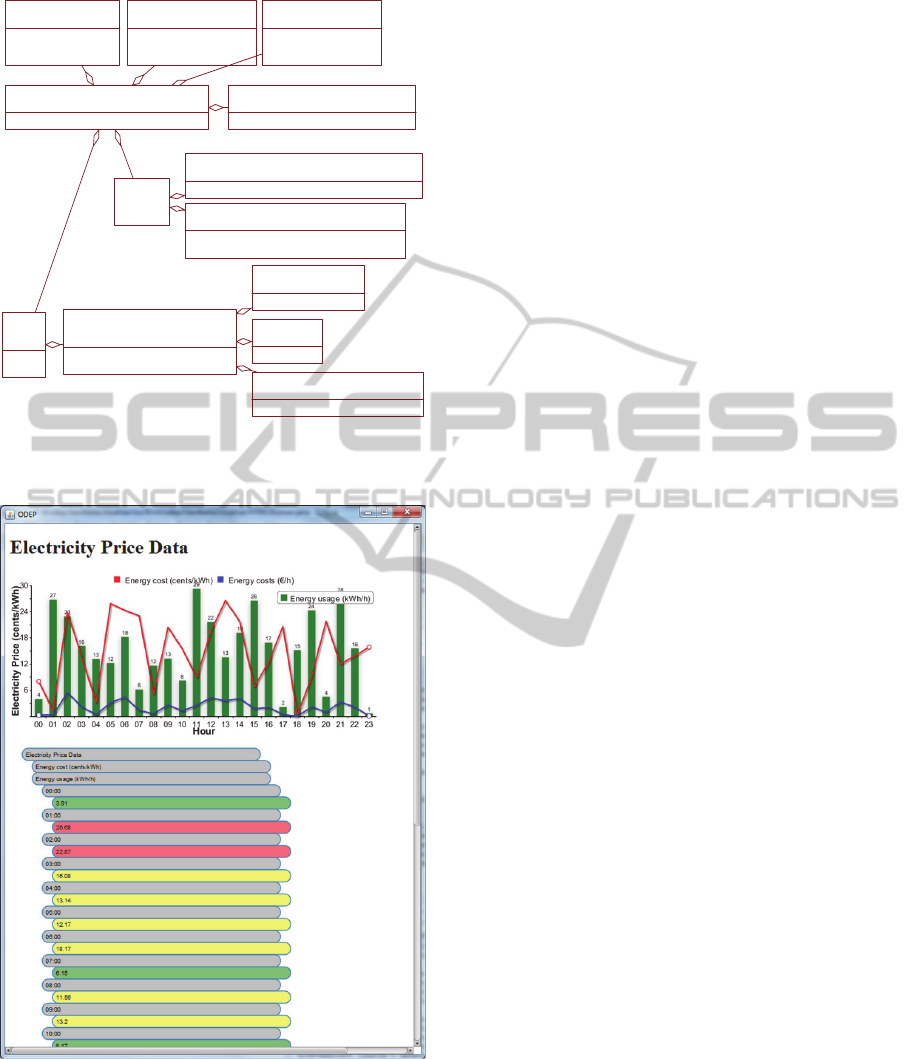
Figure 2: A Tiles4Data data model for electricity price
data.
Figure 3: Diagram and tree visualisations for electricity
price data.
visualising the Tiles4Data data in a browser view by
using HTML5 and various HTML5 visualisation
libraries, such as RGraph JavaScript library
(RGraph, 2014) and D3 (D3, 2014).
Sharing of the Tiles4Data Data
4.4
The user’s unique id such as the user’s phone
number and timestamp is attached to the published
Tiles4Data data. The query of Tiles4Data data is
based on: user ids, timestamps, data types and
domain types and on reusable and configurable data
fetching drivers. The user can configure a data
fetching driver to query data that his/her friends
have produced to a shared database or try to fetch
specific kind of domain data from the database. For
example, the user could use this driver to fetch
location data about his/her friends from the shared
database and then use other driver to visualise
his/her friends’ locations in a map view.
The administrators of databases must take care
of the garbage collection of the shared data. Most of
the produced and consumed data is thought as open
and therefore requires no security measures to be
taken into operation. On the other hand, if the
applications using open data are used for business or
for example, to control the usage of electrical
appliances, the confidentiality, integrity, and
availability of the data (e.g., provided by the Nord
Pool Spot) has to be assured. Garbage collection,
security and privacy issues are not in the focal point
of this paper, but these should be taken into account
when a data is shared into an open database.
Monitoring of the Tiles4Data Data
4.5
Monitoring context or value changes is enabled by a
reusable driver that monitors and classifies
Tiles4Data data. The driver is first configured to
monitor data whose domain type is
“http://electricity.com#ElectricityPrice”. Secondly, a
limit or a range is configured for the data value. For
example, the user can define that if the numeric
value is over 15 (cents / kWh) then the result will be
a textual Tiles4Data data that has value “Electricity
Price is High”. The representation of data is
changed, too; a textual explanation is produced from
the numeric value. Thereafter, this textual
explanation is delivered to a reusable driver that
sends the Tiles4Data data to a desired email address.
Naturally, an application can be running in the
background of the user’s smart phone and the user
can be notified by a toast or similar as an alternative.
5 DISCUSSION
A great and interesting benefit of the Tiles4Data
data model is the possibility to create reusable and
configurable processing components (i.e., drivers)
for data originating from different domains. These
Ele ct ric it yPric e s
<<Table>>
+DomainType: htt p://electricity .com#ElectricityPriceC ollection
Ele ct ricit y
Price Cell
<<Cell>>
+Row: 1
+Column: 1
Elec t r ic ity Price from 16 to 17 o'clock 28th
Ma
y
2014
<<Number>>
+DomainType: http://electricity.com#ElectricityPrice
+Value: 15
Unit for Electricity Price
<<Unit>>
+DomainType: http://electricity.com#CentsPerKWH
Ele ct ric it y Pro duce r A
<<Text>>
+DomainType: http://electricity.com#ElectricityProducer
When this price data is valid.
<<BeginTime>>
+BeginTime: 1401281949833
Ele ct ricit y Pric e s for La st Da y
<<Cross-Reference>>
+BeginRow: 1
+EndRow: 8
+Column: 2
Electricity Prices for Last Night
<<Cross-Reference>>
+BeginRow: 15
+EndRow: 24
+Column: 2
Electricity Prices for Last Evening
<<Cross-Reference>>
+BeginRow: 9
+EndRow: 14
+Column: 2
Duration
<<Duration>>
+Duration: 3600000
Help for
Ele ct ric it y
User
<<Guidance>>
Help Te xt
<<Text>>
+Value: This data model prov ides electricity price data from the last day.
Market Place for Electricity
<<WebPage>>
+URL: http//www.nordpoolspot.com
+De scription: Elect ricity price data is obtained f rom Nord Pool Spot.
DATA2014-3rdInternationalConferenceonDataManagementTechnologiesandApplications
278

components enable the end-users to create rich and
meaningful applications tailored to their specific
needs and also make the modification of these
applications easy and fast.
The RDF and JSON provide generic and
standard ways for describing data. The RDF or
JSON based data can be represented via the
Tiles4Data data model and the Tiles4Data data
model can be represented as an RDF or JSON data.
Thus, the Tiles4Data data model can be seen as a
layer inserting convenience methods to the RDF or
JSON based data models to assist the use and
production of data. Firstly, there are ready-made
methods for searching data elements based on the
name, data type and domain type. Secondly, in
generic data formats such as in RDF there are many
alternative ways for describing the data and it can be
difficult to decide how the data should be
represented. The Tiles4Data provides a very limited
set of building blocks for describing data and data
structures. It is easy to learn to use the Tiles4Data
data models, the development of data models is
more straightforward and the development time of
drivers is shorter. This is a crucial issue; a great
number of drivers and developers implementing
drivers for EUP should exist. Easy-to-use data
models are one important step towards this. The
limited data model makes the development of EUP
tools easier, too. Compared to very generic data
models, it is easier to provide EUP tools for a
limited and predefined set of data elements. For
example, in comparison to RDF, a tailored UI can be
provided for each Tiles4Data data element type to
assist the end-user in the input of data and in the use
of data.
It is important to note that the Tiles4Data data
model does not yet provide a complete solution for
all kind of data. However, it is possible to extend the
model with new elements for needs that may
possibly arise in the future. Although more
validation is needed for the Tiles4Data data model,
our initial tests show that:
The use of the composite pattern enables
flexible creation of hierarchical data
structures and thus the Tiles4Data data
model suits well for the representation of
hierarchical domain data. However, streamed
data cannot be directly represented via the
Tiles4Data data model but the handling of
streamed data is based on the content-
reference elements and on the drivers
capable of using the referred content for
different purposes.
The Tiles4Data data model is used in the
EUP phase and execution phase of
applications. Driver specifications, S-APIs,
application scripts and applications’ domain
specific input/output data, such as the
electricity price data and electricity
consumption data are represented as
Tiles4Data data.
The Tiles4Data domain data models do not
evolve over time. However, it is always
possible to add additional data to enhance the
usability/value of the provided information.
The additional data does not prevent the
backward compatibility of the model, i.e., the
data that was available in the data model will
exist in the extended data model, too. Thus,
the evolution of data structures is supported,
too.
Reusable and configurable drivers can be
provided for the Tiles4Data data. As a result,
the end-users will get more possibilities to
affect the utilization of data. For example,
the data can be visualized in a way that is
suitable for a particular user, the data can be
flexibly shared with other users, and the end-
users can configure monitoring mechanisms
for the data, too.
The development of data models/drivers
requires co-operation with the end-users; the
developers must co-operate with the end-
users, understand what data and what
fractions of data are interesting for the end-
users, and implement drivers that provide the
interesting data and the required additional
data as Tiles4Data data.
However, the Tiles4Data data model still needs to
be:
Applied to represent different kinds of
domain data and the usage experiences have
to be analyzed, and
Validated from the end-user perspective by
performing usability tests in a field in order
to ensure that the non-programmers can
really comprehend and use the Tiles4Data
data model in different kinds of application
domains.
6 CONCLUSIONS
This paper describes the Tiles4Data data model that
is designed i) for end-users, ii) for SW professionals
that open capabilities and data of legacy software
systems for end-user programming, and iii) for post-
processing of data. In our vision, the applications
created in end-user programming represent data via
an easy-to-apply Tiles4Data data model that is easy
to comprehend and use by the non-programmers.
The Tiles4Data data model extends our end-user
TowardsaDataModelofEnd-UserProgrammingofApplications
279

programming approach; the drivers can
communicate in different data formats with legacy
software components. However, the input data and
output data of the drivers is represented via the
Tiles4Data data model that enables: a) composition
of data from a small set of easy-to-apply data
elements, b) insertion of additional data to the data
elements, c) definition of cross-references that
specify data elements that are assumed to be
interesting for the end-users, and d) definition of
content-references to assists the end-users in the use
of the data.
The Tiles4Data data model enables creation of
reusable drivers capable of automatically processing
the Tiles4Data data for different purposes,
visualising the data, sharing the data, and monitoring
changes in the data. Typically the use of drivers
requires configuration effort. The user must: a)
Decide which data is interesting and b) configure the
drivers to perform the desired processing for the
interesting data.
REFERENCES
Auer, S., Bizer, C., Kobilarov, G., Lehmann, J., Cyganiak,
R. and Ives, Z., 2007. DBpedia: A Nucleus for a Web
of Open Data. The Semantic Web. Springer Berlin
Heidelberg.
Berners-Lee, T. and Connolly, D. (Eds.), 2011. Notation3
(N3): A readable RDF syntax,
http://www.w3.org/TeamSubmission/n3/.
Berners-Lee, T., Cyganiak, R., Hausenblas, M., Presbrey,
J., Seneviratne, O. & Ureche, O. E., 2009. Realising A
Read-Write Web of Data.
Bodle, R., 2011. Regimes of sharing. Information,
Communication and Society, 14, 320-337.
Decker, S., Melnik, S., Van Harmelen, F., Fensel, D.,
Klein, M., Broekstra, J., Erdmann, M. & Horrocks, I.,
2000. The Semantic Web: the roles of XML and RDF.
Internet Computing, IEEE, 4, 63-73.
D3, 2014. D3 Javascript Library [Online] Available from:
http://d3js.org/
Fielding, R. T., 2000. Architectural styles and the design
of network-based software architectures. University of
California, Irvine.
Gamma, E., Helm, R., Johnson, R. & Vlissides, J. (1995)
Design Patterns, Addison-Wesley.
Greaves, M., 2007. Semantic Web 2.0. Intelligent Systems,
IEEE, 22, 94-96.
GSON, 2014. Google-gson [Online] Available from:
http://code.google.com/p/google-gson/
Hartmann, B., Wu, L., Collins, K. & Klemmer, S. R.,
2007. Programming by a Sample: Rapidly Creating
Web Applications with d.mix. Proceedings of the 20th
annual ACM symposium on User interface software
and technology. Newport, Rhode Island, USA, ACM.
Immonen, A., Palviainen, M. & Ovaska, E., 2014.
Requirements of an Open Data Based Business
Ecosystem. IEEE Access, 2, 88-103.
Immonen, A., Palviainen, M. & Ovaska, E., 2014b.
Towards open data based business: Survey on usage of
open data in digital services. International Journal of
Research in Business and Technology, 4, 286-295.
INSPIRE, 2014. INSPIRE directive [Online] Available
from: http://inspire.jrc.ec.europa.eu
JSON, 2014. JavaScript Object Notation (JSON) [Online]
Available from: http://www.json.org/
Kovatsch, M., Weiss, M. & Guinard, D., 2010.
Embedding internet technology for home automation.
IEEE Conference on Emerging Technologies and
Factory Automation (ETFA).
Miller, R. C., 2003. End-user Programming for Web
Users. The End User Development Workshop at CHI
Conference. Ft. Lauderdale, Florida, USA.
Mørch, A. I., 1998. Tailoring tools for system
development. Journal of Organizational and End User
Computing (JOEUC), 10, 22-29.
Mørch, A. I., Stevens, G., Won, M., Klann, M., Dittrich,
Y. & Wulf, V., 2004. Component-based technologies
for end-user development. Communications of the
ACM - End-user development: tools that empower
users to create their own software solutions, 47, 59-
62.
Nord Pool Spot, 2014. Nord Pool Spot [Online] Available
from: http://www.nordpoolspot.com.
Ousterhout, J. K., 1998. Scripting: Higher level
programming for the 21st century. IEEE Computer,
31, 23-30.
Palviainen, M., Kuusijärvi, J. & Ovaska, E., 2012.
Framework for End-User Programming of Cross-
Smart Space Applications. Sensors, 12, 14442-14466.
Palviainen, M., Kuusijärvi, J. & Ovaska, E., 2012b.
Architecture for end-user programming of cross-smart
space applications. the 4rd International Workshop on
Sensor Networks and Ambient Intelligence (SeNAmI
2012). Lugano, Switzerland.
Palviainen, M., Kuusijärvi, J. & Ovaska, E., 2014. A semi-
automatic end-user programming approach for smart
space application development. Pervasive and Mobile
Computing, 12, 17-36.
Poikola, A., Kola, P. & Hintikka, K. A., 2011. Public data-
an introduction to opening information resources.
Ministry of Transport and Communications, Helsinki,
Finland.
RGRAPH, 2014. RGraph: HTML5 charts library [Online]
Available from: http://www.rgraph.net/
WIKIPEDIA, 2014. Wikipedia, ”Mains electricity,”
[Online] Available from:
http://en.wikipedia.org/wiki/Mains_electricity#Voltag
e_levels.
Won, M., Stiemerling, O. & Wulf, V. (Eds.), 2006.
Component-Based Approaches to Tailorable Systems,
Dordrecht, Netherlands, Springer.
W3C (Ed.), 2000. Extensible Markup Language (XML)
1.0 (Second Edition).
DATA2014-3rdInternationalConferenceonDataManagementTechnologiesandApplications
280

W3C (Ed.), 2004. RDF Vocabulary Description Language
1.0: RDF Schema.
W3C (Ed.), 2008. SPARQL query language for RDF.
TowardsaDataModelofEnd-UserProgrammingofApplications
281
