
Hemodynamics Monitoring in Sport
Using Hemodynamic Monitor for Sport Training Planning
Anna Shishkina, Natalia Tarbeeva, Oksana Alimpieva, Anastasia Berdnikova,
Alena Tarbeeva and Tatiana Miasnikova
Institute of Physical Education, Sport and Youth Policy, Ural Federal University, Mira Street, Ekaterinburg, Russia
Keywords: Cardiovascular System, Hemodynamic Indicators, Training Process, Athletes’ Hemodynamics, Training and
Testing.
Abstract: The study stresses the meaning of the physiological measures that are obtained with the functional
diagnostics devices and how these values can be used in coaching sportsmen. Methods: Hemodynamic
monitor was used for monitoring hemodynamics and heart function of athletes (n=305) with different fitness
levels. Active orthoclinostatic tests and antiorthostatic tests with passive body position changing were
carried out with hemodynamics measurements recorded. Results: The most informative indicators and
indices of heart function for high performance sport and their values at rest were detected. Along with
common hemodynamics indicators (HR, SV, CO, EDV, blood pressure, etc.) the possibility of using
correlation rhythmogram in coaching was studied. The correlation rhythmogram “cloud” dependence on
athletes’ fitness level was revealed in transient during active orthoclinostatic test.
1 INTRODUCTION
The success in sport training and performance is
determined by the adequate functioning of the
cardiovascular system and by the conformity of
system blood flow to physical work intensity. Too
intensive physical work and mental stress disrupts
the regulatory systems interaction, leads to fatigue
and impaired immunity and causes non-specific
defence mechanisms changing homeostasis and
reducing the effectiveness of professional sport
activity.
Current functional diagnostics provides the
opportunities to study various indicators that are
important in sports activities. Regular measurements
allow estimating how different training load
influences the athlete’s body.
There are several aims of athletes’ functional
diagnostics:
- Assessing current functional state;
- Detecting early signs of physical stress and
overtraining;
- Evaluating the effectiveness of the training
process;
- Determining appropriate ways for further
individual training planning.
Many devices are currently available for measuring
human function (
Critoph, 2013; Magder, 2014;
Rowland, 2003; Newman, 1999; Cooke, 1998, etc
).
Understanding the utility of these devices requires
an understanding of the determinants.
Functional hemodynamics monitoring is a
rapidly evolving field whose pluripotential is just
now being realized (
Pinsky, 2014). The aim of our
research was twofold. Firstly, it was necessary to
study the possibility of using the hemodynamic
monitor for hemodynamics assessment in sport
research. Secondly, we investigated the use of the
device in sport coaching. Not only is it important to
measure a great number of different indicators, but
also to interpret the data for effective sport training
planning.
2 DEVICE AND TECHNOLOGY
DESCRIPTION
The hemodynamic monitor MARG 10-01
"Microlux" used in emergency and operation rooms
was made in Chelyabinsk (Russia). The device
functioning is based on such noninvasive methods of
hemodynamic monitoring as impedance
103
Shishkina A., Tarbeeva N., Alimpieva O., Berdnikova A., Tarbeeva A. and Miasnikova T..
Hemodynamics Monitoring in Sport - Using Hemodynamic Monitor for Sport Training Planning.
DOI: 10.5220/0005094301030110
In Proceedings of the 2nd International Congress on Sports Sciences Research and Technology Support (icSPORTS-2014), pages 103-110
ISBN: 978-989-758-057-4
Copyright
c
2014 SCITEPRESS (Science and Technology Publications, Lda.)
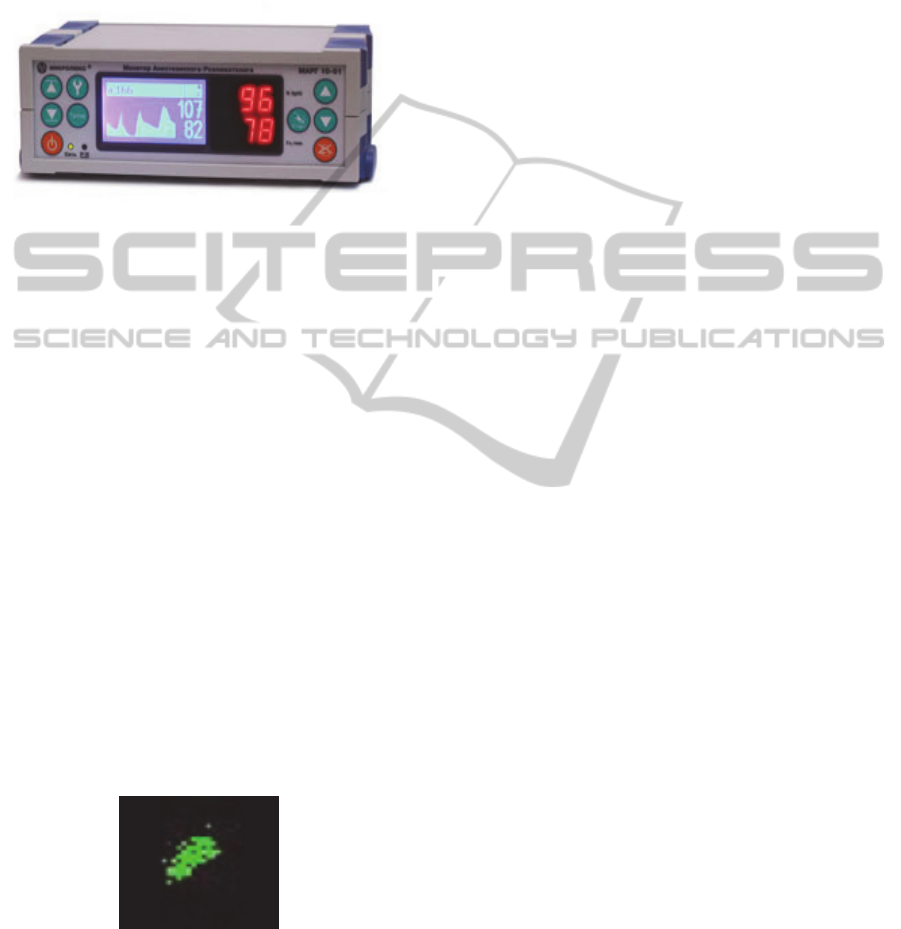
cardiography and spectrophotometry. Compact
(250x140x90 mm) and light (less than 2 kg) MARG
10-01 measures and displays data of the following
areas: electrocardiogram monitoring (ECG), pulse
oximetry monitoring, reography and central
hemodynamics monitoring, blood pressure and
temperature monitoring.
Figure 1: The hemodynamic monitor MARG 10-01
"Microlux".
ECG monitoring includes a graphic
representation of the current ECG-signal for visual
assessment.
Hemodynamics is described by four general
indicators: volemia, inotropy, vascular tone,
chronotropy. The above-mentioned indicators are
shown as a percentage of normal values. The ranges
of normal values of indicators are counted by the
program taking into account the patient examination
features (gender, age, weight, breast and neck
circumference, distance between electrodes,
hemoglobin, etc.). The deviations of more than 25%
are considered too high/low.
Volemia is the amount of circulating blood
which corresponds to the vessel volume. Inotropy is
myocardial contractility power. Vascular tone may
be normal, dilated or constricted.
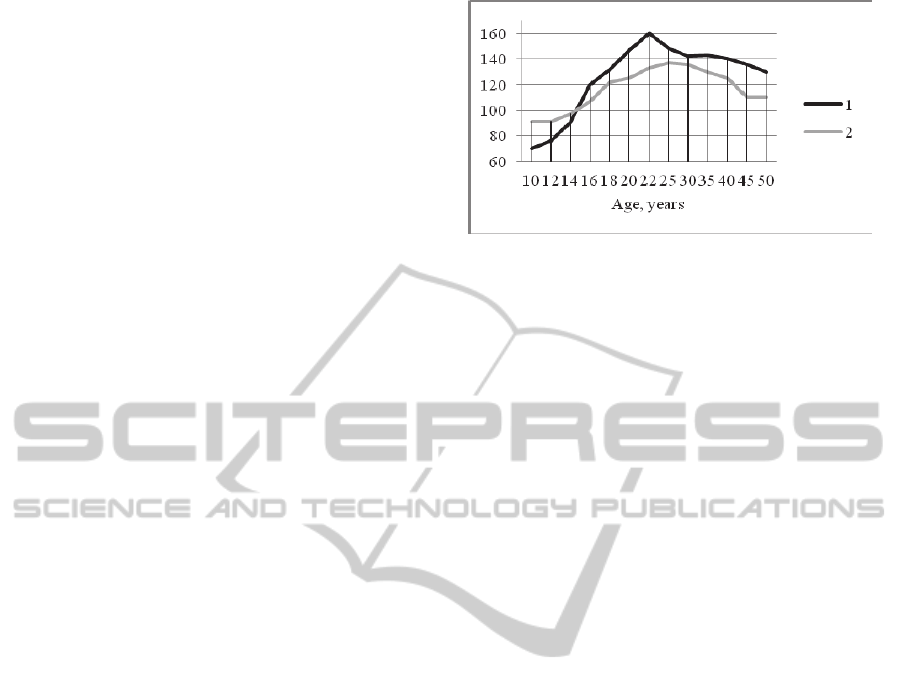
A correlation rhythmogram is a set of points
which have coordinates defined by two adjacent
cardiointervals values (RR
i
and RR
i+1
). Normal
"sinus arrhythmia" forms the image of "cloud"
(fig.2).
Figure 2: Correlation rhythmogram.
The method of heart beat distribution is highly
sensitive to a sudden RR-intervals duration change.
It allows seeing extrasystoles, rhythm disturbances,
signs of different diseases (for instance, acute
respiratory diseases) and other changes in
cardiorhythm.
Central hemodynamic indicators are presented in
four groups: perfusion, preload, afterload,
contractility and left ventricular activity.
Perfusion is the movement of fluid (i.e. blood)
through an organ or tissue in the vessels as a result
of pressure changes. Perfusion is composed of the
following indicators:
• Stroke volume is the volume of blood ejected
by the left ventricle in each systole. In healthy
people it is 60-80 ml at rest;
• Cardiac output is the volume of blood flowing
through the cross section of the aorta and pulmonary
trunk per minute. 3.4 litres is the normal value for
healthy people;
• Stroke index is the ratio of stroke volume to
body surface area;
• Cardiac index is the ratio of cardiac output to
the body surface area in square metres.
Preload is a measure of left ventricular wall
effort at the end of diastole. Preload is represented
by:
• End-diastolic volume is the maximum amount
of blood received in left ventricle at the end of
diastole;
• End-diastolic index is the ratio of end-diastolic
volume to the body surface area in square metres
Afterload is a measure of left ventricular wall
effort during systole. Afterload is represented by the
following indicators:
• The index of total peripheral resistance;
• Stroke index of total peripheral resistance
Contractility and left ventricular activity includes
the following indicators:
• Contractility index (acceleration index) is an
integral component of contractile ability of the heart;
• Ejection fraction is the relative volume of blood
ejected from the left ventricle during contraction, in
healthy individuals it is 58%;
• Index of left ventricle activity is a generalized
measure of the work of the left ventricle;
• Stroke index of left ventricle activity.
Measuring Methods. For the experiment a
patient (athlete) was in supine position on the tilted
table in the silent room with constant air temperature
(22ºC). Before recording all subjects were at rest in
supine position during 10 minutes. 8 pregelled ECG
electrodes Ag/AgCl were attached as shown in
figure 3. All measured indicators of the central
hemodynamics were automatically registered by the
programme by beat-to-beat record.
icSPORTS2014-InternationalCongressonSportSciencesResearchandTechnologySupport
104

Figure 3: Scheme of electrodes attachment.
3 EXPERIMENTS
We assume that regular informative athletes’
functional diagnostics should be the basis for the
planning of the training process.
Experiment 1
Participants and Methods. From May 2010 to
May 2014 a large group (n = 305) of athletes from
different kinds of sport (cross country skiing,
biathlon, track and field, triathlon, swimming,
Greco-Roman wrestling, sport games, etc.) aged
from 10 to 50 was examined. Among the
participants there were athletes of various skill levels
from novice (n=38) and intermediate level (n=239)
to advanced athletes (n=28), including those who
had achieved international level.
By novice we mean those athletes who engaged
in sport not longer than 3 years ago. Intermediate
athletes have 4-7 years of serious training experience
in the chosen kind of sport. Special attention was
given to representatives of endurance kinds of sport
(cross country skiing, track and field and biathlon).
Results And Discussion. To investigate the
functional state of the athletes we chose the most
informative for sports activity hemodynamic
indicators.
Heart rate (HR) is the most accessible and
informative indicator of the development of athletes’
cardiorespiratory system. HR at rest for adult
representatives of endurance cyclical kinds of sport
is less than 55 beats/min. The lowest value recorded
during the experiment was 28 beats/min. – in the
well-trained female who has been practising cross-
country skiing for more than 30 years has such. An
athlete’s HR at rest that is over 55 beats/min
indicates insufficient heart function for elite sport
and/or muscular system domination over the
cardiovascular development preventing success in
endurance sport. The best representatives of
"aerobic" sport with a duration of competitive
activity over 20 min, including sports games, also
have low heart rate. For elite athletes with a
predominance of speed and power parameters in
competitive activities a heart rate within 60±5
beats/min is permissible. High pulse of the latter
may not be the limiting factor in competitive
activity; however, it does not allow an athlete to
cope with a large amount of physical load required
for high performance sport.
The stroke volume (SV) values of untrained
adult men do not exceed 100 ml, well-trained adult
females have 120±15 ml, male athletes – 140±17 ml,
while the best representatives of sports requiring
endurance show SV 180 ±14 ml (Seluyanov, 2002).
These indicator values should be a reference point in
examining athletes.
Cardiac output (CO) is the indicator of cardiac
systolic function and is equal to HR multiplied by
SV. Increasing SV and CO during long term
exercise is one of the main effects of endurance
training. At the same time the growth of CO should
occur due to SV rise, but not due to heart rate rise.
Large end diastolic volume (more than 190 ml)
provides sufficient stroke volume and cardiac output
and is the guarantor of good tolerance to high
intensity work load in training and competitive
activities.
An ejection fraction changes from 60 to 65 and
serves as an indicator of fitness level and the
intensity of the training process. Regular extensive
endurance training does not increase ejection
fraction (Scharhag, 2002). The highest values of
ejection fraction are observed in sport game players.
In cyclical kinds of sport ejection fraction increases
correspondingly to the athlete’s fitness level
enhancement to the competitive activity. It is
explained by analysing the physical load structure
per year: the closer the competition, the more
intensive workouts are used, the higher the ejection
fraction.
Breathing rate. It is considered that special
training of the respiratory system is not required for
well-trained athletes as it develops itself during
physical training. However, 12,13 % of the
examined athletes have higher than normal breathing
rate. The normal number of breaths per minute in
adults is correlated with the heart rate as 1:4.
Breathing and hemodynamics are interdependent
processes (Donina, 2011). In case of high breathing
rate in athletes you should first check blood
hemoglobin, hematocrit and lung capacity, secondly,
exclude post training acidosis and, thirdly,
fermentopathy and heart disease. For enhancing
respiratory function in healthy athletes with high
HemodynamicsMonitoringinSport-UsingHemodynamicMonitorforSportTrainingPlanning
105
breathing rate breathing exercises, altitude training
or partly limited air inhaling during training (for
instance, breathing through nose), intermittent
hypoxic training, etc may be used.
For finding out the correlation between
hemodynamic indicators and sport performance
thirteen well-trained skiers (men) were included in
the next study. The subjects’ age was from 15 to 17.
All of them had 5-6 years of training and
competition experience. Each subject was well
rested before testing during the previous 24 hours.
All athletes in measurement were at rest in the
supine position.
We determined normal values (mean±standard
deviation) for each hemodynamic indicator in the
group of athletes. Then we held correlation analysis
between indicators and sport performance ranking of
skiers in Russia. Statistical analysis showed
significant correlation between athletes’
performances and stroke volume (r = 0.77;
122±22ml), cardiac output (r = 0.61; 6.8±1.6 l), end-
diastolic volume (r = 0.76; 193±34ml), stroke index
(r = 0.82; 69±11ml/m
2
), heart index (r =
0.65;3.9±0.9l/m
2
), end-diastolic index (r = 0.81;
110±17ml/m
2
) and stroke index of left ventricle
work (r = 0.62; 74±14). There was no correlation
between performance and heart rate (57±8
beats/min), ejection fraction (63±2%) and index of
left ventricle activity (4.2±1.0).
Thus such indicators as stroke volume, cardiac
output and end-diastolic volume showed athlete’s
conditions and they might be predictors of fitness
level and competition results. But these indicators do
not take into account athletes’ body size and muscle
mass.
Such indicators as heart rate, ejection fraction
and index of left ventricle work do not correlate with
performance, however they show the heart work
quality and can be good indicators of overexertion.
All the above-mentioned indicators can be used for
monitoring athletes’ function during seasons.
It is known that cardiorespiratory system
functions are considered important factors of success
in endurance sports. In force-velocity sports, martial
arts and sport games coaches sometimes
underestimate the level of cardioendurance.
However, our study showed that important
hemodynamic indicators (SV, EDV) of medal
holders in World and European championships were
always high.
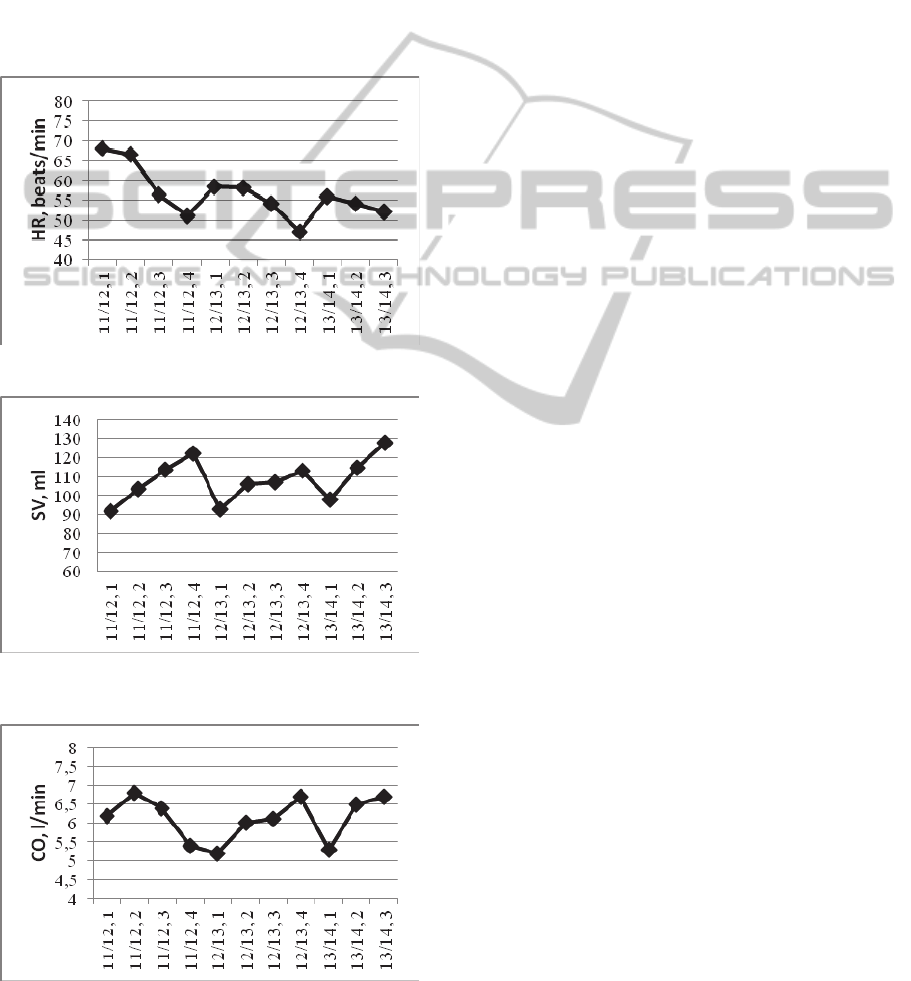
Age-average stroke volume and end diastolic
index of excellent sportsmen in our research are
shown in fig. 4.
Figure 4: Hemodynamics in excellent athletes of different
age. 1 – SV, ml; 2 – EDI, ml/m
2
.
It was proved that cardiac output was twice
lower in juvenile rats than in adults (106 +/- 5
ml/min), but cardiac (heart) index was not different
among groups (Delp, 1998). We found that in
human athletes the cardiac output may be equal in
child and adult, the average stroke volume increases
from childhood till the age of 22, then it smoothly
decreases (fig.4). But it stays higher than in
untrained people. End diastolic index (fig. 4) was
used to show the relative hemodynamics changes. In
rats and untrained people it stays constant with age.
Due to intensive sport activity EDI increases
significantly. Thus we can conclude that regular
sport training causes the adaptation changes in
athletes’ central hemodynamics.
It is possible to increase stroke volume and EDV
by special low intensive (HR=120±10) long lasting
training sessions (Seluyanov, 2002) within a month
or two or by high-intensity interval training. But due
to training growth of SV and EDV may be limited
and partly predetermined genetically. Determining
SV and EDV in youth allows predicting athletic
success and prospects for the sport.
Experiment 2
Since stroke volume is not a stable indicator (it
changes during physical load, stays higher
afterwards in recovery period and may be increased
as a result of training process) we organized the
experiment with the purpose to analyse the changes
in central hemodynamics of cross country skiers
during the macrocycle and in the process of long-
term training (3 macrocycles).
Participants and Methods. In the period from
May 2011 to August 2013 a group (n=28) of well-
trained cross country skiers aged from 14 to 20 years
was examined.
The measurements were provided 4 times per
year: 1 – off-season (May), 2 – the 1
st
part of
preparatory period (June – August), 3 – the 2
nd
part
icSPORTS2014-InternationalCongressonSportSciencesResearchandTechnologySupport
106
of preparatory period (September – November), 4 –
competition period (December – April).
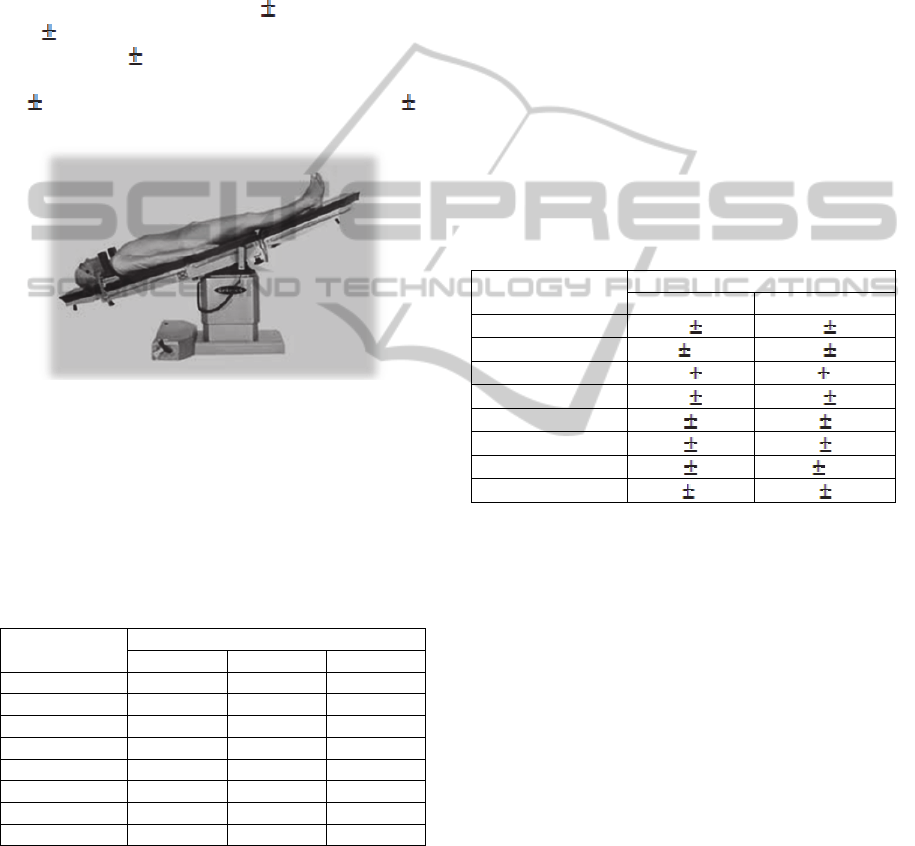
Results and discussion. The dynamics of heart
rate at rest of athletes in supine position during
macrocycle tend to significantly decrease from the
beginning of the off-season till the start of the
competitive period (fig. 5-7). Such dynamics had
place in each subsequent macrocycle in cross
country skiing. At the same time there were positive
dynamics for all indicators. Heart rate at rest for
three-year period has changed in the same period of
training (May) to 68 ± 4,4 to 52,2 ± 3,3 beats/min in
the group of cross country skiers (fig.5).
Figure 5: Heart rate dynamics during three macrocycles.
Figure 6: Stroke volume dynamics during three
macrocycles.
Figure 7: Cardiac output dynamics during three
macrocycles.
In the examined group of skiers SV dynamics for
three macrocycles had a stable growth trend. Within
three macrocycles there is a gradual increase of the
CO from 6,2 to 6,7 l/min on average in the group.
Thus, in the process of long-term training of
cross country skiers the central hemodynamics
indicators such as stroke volume, cardiac output and
cardiac index are rising but heart rate is
appropriately decreasing. This is due to increased
levels of fitness and adaptation to physical work.
The study also revealed SI, CO and CI increases and
decrease in heart rate within the macrocycle for all
periods except off-season time. There was an
increase in HR and a slight decrease in SV, leading
to lowering CO and SI. It proved the ineffectiveness
of the training process for cross country skiers in the
off-seasons.
Experiment 3A.
The aim of the study was to determine the
effects of athletes’ organism adaptation to the
environment and to physical activity.
Participants and Methods. 20 athletes (12
females and 8 males, cross country skiers) aged from
10 to 20 with different fitness levels were
undergoing an active orthoclinostatic test (supine
position1 during 3 min– standing during 3 min ̶
supine position2 during 3 min). All the above
mentioned indicators and indices were registered
automatically with the software of the
Hemodynamic monitor MARG 10-01 (beat-to-beat
record). Special attention was given to correlation
rhythmogram in different patients’ body position
and in transient periods (from supine1 to standing
and from standing to supine2 position).
Results and Discussion. Orthoclinostatic test
allows estimating participation of parasympathetic
and sympathetic system in heart rate regulation and
speed and quality of this regulation.
Quality of transition can be estimated by the
action of physiological systems regulation. The
regulation time and the maximum deviation of the
adjustable value from the initial value are the main
indicators of quality of regulation (Stickland, 2006).
The lower each of the mentioned hemodynamics
indicators is, the higher the quality of regulation in
transient.
Comparison of organism reactions during active
orthoclinostatic tests revealed that athletes with 1 or
2 years of sport experience demonstrate a strong
reaction of heart rate in transient into standing
position (table 1). After returning to supine position2
the heart rate of novices in sport was much higher
than in initial supine position1 at rest. Positive
HemodynamicsMonitoringinSport-UsingHemodynamicMonitorforSportTrainingPlanning
107

changes in adaptation as a rule appeared at the end
of the third year of regular sport training: the heart
rate in supine position2 (HR
3
) tended to HR
1
at rest
(table 1). The group of sportsmen with 4-7 years of
sport experience have an adequate adaptation
reaction in orthoclinostatic test similar to the
reaction to physical workload: the HR rise is
moderate.
Advanced athletes have professional sports
reaction in active orthoclinostatic test: HR
3
is even
lower than HR
1
. The correlation rhythmogram
proves and specifies HR reaction in the
orthoclinostatic test: the longer the experience in
sport is, the less R-R intervals dispersion at rest
(“cloud” and even “dot”) and in transient
(“bisectrix”) and the shorter the period of HR getting
stabilized.
Thus, according to athletes’ organism
orthoclinostatic test reaction indicators (HR changes
and “cloud” sizes in the correlation rhythmogram)
one can judge the fitness level of young sportsmen
and adjust the physical workload in correspondence
to athletes’ physiological readiness to train hard.
Experiment 3B
Antiorthostatic test is a test method of
diagnostics of the cardiovascular system and its
response to changes from the supine horizontal
position to the head-down tilt. Antiorthostatic test
allows estimating the athlete’s functional state with a
reliable validity because humans do not have
adaptive mechanisms for this position. This method
is mainly used in clinical medicine.
Materials and Methods. Examined group
(n=14) of female athletes (swimming) is aged 17-18.
All of them have intermediate sport level.
Antiorthostatic tests with passive body position
changes and hemodynamics measurements
recording was carried out in the following stages:
1. Supine (horizontal) position at rest during 3 min:
2. Passive (by the tilted table) transition to the
Trendelenburg position (fig.7) with a tilt angle of
30º.
Table 1: Athletes orthoclinostatic test peculiarities in dependence of sport experience.
Athletes’
experience
Supine position 1 Post transition period
1-2
Supine position 2 Heart rate dynamics
Novices with
1-2 years of
sport
experience
HR
1
= 65 HR
2
= 86 HR
3
= 70
Novices of
the third year
of sport
experience
HR
1
= 63 HR
2
= 80 HR
3
= 60
Intermediate
trainees
(4-7 years of
sport
experience)
HR
1
= 58 HR
2
= 70 HR
3
= 55
Advanced
athletes
HR
1
= 48 HR
2
= 62 HR
3
= 45
icSPORTS2014-InternationalCongressonSportSciencesResearchandTechnologySupport
108
3. The Trendelenburg position during 3 min.
4. Passive transition to supine position.
5. Supine (horizontal) position at rest during 3 min.
When carrying out the functional antiorthostatic
test background and transition and post transition
periods of test records were under special attention.
Results and Discussion. All indicators which
have a significant correlation with athlete’s result
were measured.
Heart rate increases from 62
6 beats/min at rest
to 65
7 beats/min during head-down tilt, and then it
decreases to 61
6 beats/min. Heart rate has higher
mean and standard deviation during transients
(71
10 beats/min in head-down tilting, 65 7
beats/min in returning).
Figure 8: Trendelenburg position.
Subjects are more sensitive to the beginning of
head-down tilt than to returning in primary position.
The change in heart rate may be attributed to a
decrease in stroke volume or increase of sympathetic
tone (Lucia, 2000)
Table 2: Dynamics of hemodynamic indicators in the main
position during antiorthostatic test.
Indicator
Mean±SD
1 3 5
HR, beats/min 61±6 67±9 64±8
SV, ml 102±16 101±19 98±18
SI, ml/m
2
60±5,6 60±6,4 60±6,1
EDV, ml 162±30 161±36 158±31
EDI ml/m
2
98±11 97±12 97±10
CO, l/min 6,4±1,4 6,8±1,6 6,3±1,4
CI, l/m
2
3,9±0,7 4±0,7 3,8±0,6
SILVA, 68±6,9 67±11 67±11,2
Stroke volume and end-diastolic volume (EDV)
do not significantly fall from the 1
st
position to the
head-down tilt and continue decreasing in transient
to supine position. At the same time indices (stroke
index (SI), end-diastolic index (EDI) and stroke
index of left ventricle activity (SILVA)) have
minimal changes or no changes.
Cardiac output (CO) enhances from 6,1±4 l/min at
rest to 6,8±1,7 l/min in antiorthostasis and decreases
to 6,3±1,5 l/min in supine position after head-up tilt.
During head-down tilting cardiac output is 6,6±1,6
l/min, and when returning it increases to 6,9±1,7
l/min. Magnitude of this indicator during test
depends on heart rate change and stroke volume.
Cardiac index is more sensible to position changes
than other indices.
If there is considerable difference between the 1
st
and the 5
th
position, the athlete doesn’t have a high
fitness level. Perhaps overtraining or disease come
into play. At the same time individual features
influence is not excluded.
The indicator value in the 3
rd
position shows
cardiovascular and neural response to antiorthostatic
load. If magnitudes exceed the normal value,
inadequate response to workload takes place.
Table 3: Dynamics of hemodynamic indicators in the
transients during antiorthostatic test.
Indicator
Mean±SD
2 4
HR, beats/min
71 9 67 8
SV, ml
97 19,5 100 22
SI, ml/m
2
58
7 60 7,6
EDV, ml
158
32 161 34
EDI ml/m
2
94
11 97 11
CO, l/min
6,8 1,5 6,7 1,5
CI, l/m
2
4,1 0,7 4 0,6
SILVA,
65 9,4 69 11
Hemodynamic indicators values have higher
amplitude excursion during transients than in supine
and head-up tilt because of adaptation to new body
position. Too high changes of hemodynamic
indicators point to inadequate response to workload
or overtraining. However, too weak change or its
absence shows adaptation problems which influence
negatively the training process and competition
results.
Thus hemodynamic response to antiorthostatic
tests shows not only the fitness level of athletes, but
the existence of diseases, overtraining and possible
adaptation problems.
4 CONCLUSIONS
The state of the cardiorespiratory system and
hemodynamics is an important criterion in achieving
success in sport performance. That is why sport
scientists should explore informative support
technologies of athletes’ functional diagnostics in
HemodynamicsMonitoringinSport-UsingHemodynamicMonitorforSportTrainingPlanning
109

order to supply sports practice with reliable
information useful for planning the training process.
The use of hemodynamics monitor with
impedance cardiography and spectrophotometry in
base and comparing the obtained athletes’
hemodynamics data with normal values of excellent
athletes enable to detect individual features of
athletes’ physical workability, functional reserves or
limiting factors of physical workability and predict
athletic success and prospects for the sport.
Regular monitoring of athletes’ hemodynamics
allows to estimate the effectiveness of the training
process, progress (or regress) of workability and
suggest proper methods for its correction.
REFERENCES
Cooke, G., Marshall, P., Al-Timman, J., Wright, D., Riley,
R., Hainsworth, R., Tan, L., 1998. Physiological
cardiac reserve: development of a non-invasive
method and first estimates in man. In Heart. Vol. 79,
no. 3. pp. 289-294
Critoph, C., Patel, V., Mist, B., Thomas, Martin D., Elliott,
P., 2013., Non-invasive assessment of cardiac output
at rest and during exercise by finger plethysmography.
In Clinical physiology and functional imaging. Vol.
33, no. 5. pp. 338-343
Delp, M., Evans, M., Duan, C., 1998. Effects of aging on
cardiac output, regional blood flow, and body
composition in Fischer-344 rats. In Journal of applied
physiology. Vol. 85, no.5. pp. 1813-1822
Donina, J.A., 2011. Intersystem relations of breathing and
blood circulation. In Human Physiology. Vol.37, no.2.
pp.117-128.
Lucia, A., Hoyos, J., Perez, M., Chicharro J.L., 2000.
Heart rate and performance parameters in elite
cyclists: a longitudinal study. In Med.Sci.Sports Exerc.
Vol.32. No.10, pp.1777-1782
Magder, S., 2014. Current tools for assessing heart
function and perfusion adequacy. In Current opinion
in critical care. Vol. 20, no.3. pp. 294-300
Newman, D., Callister, R., 1999. The non-invasive
assessment of stroke volume and cardiac output by
impedance cardiography: A review. In Aviation space
and environmental medicine. Vol. 70, no. 8. pp. 780-
789
Pinsky, M., 2014. Functional haemodynamic monitoring.
In Current opinion in critical care. Vol. 20, no. 3. pp.
288-293
Rowland, T., Lisowski, R., 2003. Determinants of
diastolic cardiac filling during exercise. In Journal of
Sports Medicine And Physical Fitness. Vol. 43, no. 3.
pp. 380-385
Scharhag, J., Schneider, G., Urhausen, A., et al., 2002.
Athlete's heart – Right and left ventricular mass and
function in male endurance athletes and untrained
individuals determined by magnetic resonance
imaging. In Journal of the American college of
cardiology. Vol. 40, no. 10. pp. 1856-1863
Seluyanov, V.N., 2002. Intuition is blind without
knowledge, In Skiing Sport, Vol. 23. pp.62-67.
Stickland, M.K., Welsh, R.C., Petersen S.R., 2006. Does
fitness level modulate the cardiovascular response to
exercise? In J Appl Physiol. Vol.100, pp. 1895-1901
icSPORTS2014-InternationalCongressonSportSciencesResearchandTechnologySupport
110
