
The Social Score
Determining the Relative Importance of Webpages Based on Online Social Signals
Marco Buijs and Marco Spruit
Department of Information and Computing Sciences, Utrecht University, Utrecht, The Netherlands
Keywords:
Social Score, PageRank, Web Search, Top-K Ranking, Quality Assessment, Data Analytics, Information
Extraction.
Abstract:
There are many ways to determine the importance of Webpages, the most successful one being the PageRank
algorithm. In this paper we describe an alternative ranking method that we call the Social Score method. The
Social Score of a Webpage is based on the number of likes, tweets, bookmarks and other sorts of intensified
information from Social Media platforms. By determining the importance of Webpages based on this kind of
information, ranking becomes based on a democratic system instead of a system in which only web authors
influence the ranking of results. Based on an experiment we conclude that the Social Score is a great alternative
to PageRank that could be used as an additional property to take into account in Web Search Engines.
1 INTRODUCTION
It has been proven that top-K ranking in Web Search
cannot be based only on matching queries to doc-
uments (Manning et al., 2008). Although many
techniques for ordering Webpages based on query-
document similarity are present, it is not sufficient
to get good results in Web Search. There are too
many resources that look too much alike to deter-
mine which documents are more relevant than oth-
ers. Search Engines turn to other factors to determine
the general importance of Webpages and take that into
account especially when many documents contain ap-
proximately the same content. What appears to work
best is to use query-document matching ranking tech-
niques in combination with query-independent rank-
ing techniques. This way, Search Engines are able
to determine what search results should be shown
on top, even when a query matches many docu-
ments more or less equally well. Important concepts
in query-document matching are Term Frequency-
Inverse Document Frequency (TF-IDF) ranking and
metadata extraction (Salton and McGill, 1983; Hu
et al., 2005). Those are then combined with query-
independent ranking techniques to gain better results.
One such factor to determine the general importance
of Webpages in which the match between a document
and the query is taken out of the equation is PageR-
ank (Brin and Page, 1998). With PageRank, the value
of pages is determined by the Link structure on the
Web. When a page is linked to from many impor-
tant Webpages, the page itself is also considered to
be important. Using a recursive algorithm, the rela-
tive value of every Webpage is calculated. This way
is based on how the value of scientific papers can also
be estimated: based on the number of times your pa-
per is cited by other papers that all also have their own
relative value in the community. PageRank has been
proven very successful and it is often referred to as
the algorithm that made Google gain its huge market
share in Web Search. Such a system in which Links
determine the value of Webpages is also referred to as
the Link Economy (Gerlitz and Helmond, 2013). In
the Link Economy, the power to influence the ranking
of search results is with the authors on the Web. Be-
fore the Link Economy, there was the Hit Economy,
in which the value of Webpages was mainly based on
the visit counters that were available on Webpages.
In the Hit Economy, the number of visits determined
the value of Webpages and the power to influence the
rankings was directly in the hands of all internet users.
We propose a method to give back the power to influ-
ence Web Search rankings directly to all internet users
instead of only web authors. The system is based
on the Like Economy, in which the value of Web-
pages is based on online Social Signals such as likes,
tweets, mentions, shares, bookmarks and pins. For
every Webpage we calculate a Social Score, which is
based on Social Signals from multiple Social Media
platforms.
71
Buijs M. and Spruit M..
The Social Score - Determining the Relative Importance of Webpages Based on Online Social Signals.
DOI: 10.5220/0005076400710077
In Proceedings of the International Conference on Knowledge Discovery and Information Retrieval (KDIR-2014), pages 71-77
ISBN: 978-989-758-048-2
Copyright
c
2014 SCITEPRESS (Science and Technology Publications, Lda.)

2 RELATED WORK
To our knowledge, not much research has been per-
formed to improve web search using explicit Social
Signals such as likes and tags. However, related work
has been performed in the field of the Semantic Web.
The Semantic Web aims at adding logic to the World
Wide Web. The idea behind this is that the Web be-
comes better readable for machines. This way, ma-
chines would be able to get a better understanding of
how pages are related to each other and where they
have to look for certain information. Furthermore,
the Semantic Web enables machines to aggregate data
from different pages and present this aggregated data
to users in a clear overview (Berners-Lee et al., 2001).
A truly personal approach to Information Re-
trieval on the WWW has been taken by Delicious.
On Delicious people can create an account, add book-
marks to it and retrieve those bookmarks later on
based on tags that can be assigned to bookmarks.
They can also befriend people and search in the book-
marks of their friends. Several studies were per-
formed on whether such an approach could improve
web search and the results differed (Heymann et al.,
2008; Yanbe et al., 2007; Noll and Meinel, 2007).
Bookmarking on Delicious is a form of collabo-
rative tagging. Golder and Huberman performed re-
search in this field of study and they define collabora-
tive tagging as
”the process by which many users add meta-
data in the form of keywords to shared con-
tent” (Golder and Huberman, 2006).
During their research they observed that people use
a great variety of tags, but also consensus is reached
in such a way that stable patterns emerge in tag pro-
portions with respect to tagged resources. They also
identify the main reason behind tagging, which is per-
sonal use. They conclude that the stable patterns in
tagging can be used to organise and describe how web
resources relate to each other. Tags can be seen as a
form of Social Signals that could be taken into ac-
count in determining the relative importance of Web-
pages. Not all Social Signals assign words to a re-
source. Social Signals can be less complex, such as a
like. A like only indicates positivity with respect to,
for example, a web resource.
In 2007, Bao, Wu, Fei, Xue, Su and Yu saw the
potential of social annotations to determine the value
of Webpages (Bao et al., 2007). Although they took
a different approach with their ranking method that
they call SocialPageRank, the idea is rather similar
to the Social Score method as proposed in this pa-
per. One differences between the approaches are that
SocialPageRank makes use of more complex mathe-
matical calculations whereas the Social Score makes
use of simpler math and is easier to understand. Fur-
thermore, the computational complexity of the So-
cial Score method to calculate the Social Score of
one Webpage is O(1) whereas in the SocialPageR-
ank method it is not possible to calculate any individ-
ual Score for a Webpage without calculating the other
scores for the other Webpages. This is because Social-
PageRank makes use of recursive Matrix multiplica-
tions just like PageRank does to converge to a stable
scoring model. In each iteration the computational
complexity is O(|U ||W | + |s||W | + |U||s|) where |U|
is the number of users U of the Social Media platform,
|W | is the number of Webpages W in a Corpus C and
|s| is the number of social annotations or Social Sig-
nals. The number of iterations determines the accu-
racy of the resulting scores for the Webpages. The last
and most important difference is that SocialPageRank
only makes use of data from one Social Media plat-
form what leaves more open space for bias. The So-
cial Score method is more generic and can take into
account as many Social Signals from as many Social
Media Platforms as desired.
3 SOCIAL SCORE
Just like PageRank, the Social Score is used next to
existing techniques like TF-IDF. That is what makes
the algorithm so similar to Pagerank: it calculates the
value of a Webpage, completely independent of any
query. Additional algorithms are required for both
PageRank and the Social Score to actually use this
information in search engines, because also the query
has to be taken into account. Only if algorithms such
as TF-IDF result in many hits, which is often the case
on the Web, the Social Score can be used to determine
which resources should be returned first. In oppo-
site to PageRank, the Social Score can be calculated
for every Webpage individually, without having to re-
compute all the other scores for all other resources.
An arbitrary number of Social Signals from different
Social Media Platforms can be taken into account. To
prevent bias towards a certain group of internet users
or a certain domain, it is good practice to take as many
signals from as many Social Media Platforms as pos-
sible into account. To calculate the Social Score S for
a Webpage W , we take into account n Social Signals
related to Webpage W . The Social Score takes into
account a list L of n Social Signal Scores s, where s
is the number of Social Signals from one Social Me-
dia Platform. For example, s could be the number of
shares of a Webpage W on Facebook or the number
of tweets about W on Twitter. Now the Social Score
KDIR2014-InternationalConferenceonKnowledgeDiscoveryandInformationRetrieval
72

S is calculated as defined in Equation 1.
S =
∑
n
i=1
log
10
(1 + L
i
)
n
(1)
An example of calculating the Social Score S for
a Webpage W only taking into account two Social
Media platforms is as follows: let’s say that the web-
site ”example.com” has 99 likes on Facebook and has
been mentioned in 9 tweets on Twitter. Then, L
1
= 99,
L
2
= 9 and n = 2. We calculate the sub scores per So-
cial Signal and divide by n. The sub score for likes on
Facebook is log
10
(1 + 99) = 2 and the sub score for
tweets on Twitter is log
10
(1 + 9) = 1). To calculate
Social Score S for Webpage W we take the average re-
sulting in S = 1.5. As you can see in this example, the
Social Score increases with the number of likes and
shares. Table 1 gives some more examples in which
three Social Signals are taken into account: the num-
ber of likes on Facebook, the number of tweets on
Twitter and the number of bookmarks on Delicious.
From this table we can infer that S is higher when
Social Signal Scores are in balance. When they are
out of balance, the same total number of likes, tweets
and bookmarks result in a lower Social Score S. This
happens because the log
10
is taken of every individ-
ual Social Signal score s and not after summing them
all up first. For example, only having 999 likes on
Facebook results in a Social Score of 1.00 whereas 99
likes, 99, tweets and 99 bookmarks result in a Social
Score of 2.00. Intuitively this makes sense because it
looks like in the first case there is a bias towards Face-
book and likes whereas in the second case there seems
to be a balance between the Social Media Platforms.
Although there were several reasons to choose
particularly for the log
10
in Equation 1, we did not
experiment with other logs and it could be that an-
other log would perform better in practice. What we
can say about the log, is that if you lower it, there will
be more room for bias and if you increase it there will
be less room for bias. That is because every individ-
ual Social Signal that is taken into account gets more
influence on S if a lower log is taken and gets less
influence on S when a higher log is taken. The first
reason we chose for log
10
is that it is relatively easy
to interpret for people. For example, a Social Score
S of 1.00 can be interpreted as 10 likes, 10 tweets
and 10 bookmarks assuming a balanced distribution
over the Social Media platforms. Assuming equally
distributed Social Signals over the Social Media plat-
forms, the Social Score can be explained as the order
of magnitude for the underlying Social Signal scores.
Furthermore, using the log
10
gives a quite good scale
for the Social Score. When a Webpage would have
one billion Social Signals per Social Media platform
that is taken into account, that page would have a
Social Score S of 9.00. Currently there are no such
Webpages present in the world that have that many
Social Signals related to them on any Social Media
platform. Therefore, we can safely assume that the
Social Score will always produce values between 0
and 9 disregarded which Social Media platforms are
used to calculate the Social Score.
Table 1: Examples of calculating Social Score S given three
Social Signal Scores s.
Likes Tweets Bookmarks Social Score S
0 0 0 0.00
999 0 0 1.00
99 99 99 2.00
333 333 333 2.52
10
8
10
7
10
6
7.00
The Social Score S of one specific web resource
can be calculated in O(1) time by making use of
the Application Programming Interfaces (APIs) of the
Social Media Platforms. Now let’s consider a Corpus
C consisting of indexed Webpages W. To determine
all the Social Scores of all Webpages W in C, this
would take O(|C|) time. Therefore, we can say that
computational complexity increases linearly with the
size of Corpus C. Notice that the Social Score S of a
Webpage W will generally change over time because
people keep interacting with the Webpage W via So-
cial Media Platforms.
4 EXPERIMENT
To be able to validate whether the Social Score S can
accurately determine the importance of Webpages, an
experiment was performed in which a Corpus C of
over 120 000 Webpages was gathered. The exper-
iment was part of a larger experiment about Social
Search engine quality in which a prototype was built
and tested.
Based on work from Evans and Chi (Evans and
Chi, 2008) and Golovchinsky , Pickens and Back
(Golovchinsky et al., 2009), we define asynchronous
Social Search as
”Information seeking supported by a net-
work of people where collaboration takes
place in a nonconcurrent way.”
Important concepts in asynchronous Social Search are
user-generated content and user feedback.
There were three ways in which results could be
added to the prototype. The first one was manually, by
filling in a URL, title, description and keywords. Fig-
ure 1 provides a screenshot of what this way looked
TheSocialScore-DeterminingtheRelativeImportanceofWebpagesBasedonOnlineSocialSignals
73

Figure 1: Screenshot of how a link could be added manu-
ally.
like in practice. The second was by adding a book-
marklet to your favourites in your web browser. When
a user had the bookmarklet in his favourites list in his
web browser and he visited a website, he could click
on the bookmarklet. This resulted in a popup of the
search engine with a form shown to add a result to the
search engine. In this form, the URL, title, descrip-
tion and keywords are already filled in based on the
page that the user is currently visiting. This second
way of adding Webpages to the search engine is less
time consuming than the first. An example is shown
in Figure 2. The third way to add search results to the
search engine was by installing an extension for the
Chrome web browser. By installing this extension, all
the websites that were visited by the user were added
to the search engine automatically. To guarantee a
decent corpus size, the API of bookmarking website
Delicious was also used to enrich the corpus with re-
sources tagged publicly on Delicious. Delicious was
launched in 2003 and enables people to tag Webpages
and discover them later on. In other words, Delicious
is an online bookmarking service (Golder and Hu-
berman, 2006). 29 215 resources were acquired via
the Delicious API. We also know that the rest of the
Corpus was mainly gathered by tracking the browse
behaviour of just over 20 participants that installed
the Chrome Extension. That means that every user
of the extension roughly attributed 4 500 resources to
the index during the experiment. Gathering resources
started in june 2013. First, this happened only man-
ually, then the bookmarklet was released and later on
also the Chrome extension was released in september
2013. The end of the measurement period for the ex-
periment was the seventh of january 2014.
For every page a Social Score S was calculated
based on Signal Scores s from seven Social Media
Platforms. The Social Media platforms used in the ex-
periment were Facebook, Twitter, Pinterest, Google+,
StumbleUpon, Delicious and LinkedIn. From Face-
book and LinkedIn, the number of times the URL
was shared was acquired. From Twitter the number
of tweets in which the URL was mentioned was ac-
quired. From Pinterest, the total number of times
that items were pinned on the Webpage was acquired.
From Google+, the number of people that +1’d a
URL was acquired. From StumbleUpon, the num-
ber of times a URL was stumbled upon was acquired.
Last, from Delicious, the total number of times a
URL had been bookmarked was retrieved. Two ex-
ample calculations are shown in Table 2. Here, two
Webpages from different conferences are rated and
it appears that http://www.kdd.org/ is more important
than http://www.kdir.ic3k.org/ according to their So-
cial Scores S. What is important is of course a sub-
jective matter. The Social Score takes the viewpoint
that websites are more important than others when
they receive more likes, preferably equally distributed
over the Social Media platforms that are taken into
account. When the Social Score would actually be
used in a search engine, first algorithms like TF-IDF
are used to find matching resources and only when
there are many results that match a query approxi-
mately equally well, the Social Score should be used
to identify the most important ones. Although the re-
sults of this experiment indicated a statistically signif-
icant improvement in ranking compared to the base-
line method, this particular experiment could unfor-
tunately not be used to prove that the Social Score
worked better than for example, PageRank. That is
because the baseline method also had other differ-
ences in the ranking algorithm than only the Social
Score. This does not mean that the results of that
experiment were useless, the experiment just had an-
other purpose: comparing two search methods. From
the Corpus a top 50 was assembled based on Social
Score S. Figure 4 provides an overview of the most
important websites worldwide according to the Social
Score S. Notice that there were ten duplicates in the
list, such as https://twitter.com and http://twitter.com
which both refer to the same content. Such duplicates
were removed from the list. In large extent the list
feels intuitively right. The most disturbing about the
list is that Wikipedia has been ranked only 31st. In a
PageRank algorithm Wikipedia would probably score
top five, but apparently Wikipedia is not a source that
many people frequently share or like via Social Me-
dia compared to the number of back Links created to
Wikipedia by authors on the Web. Another interest-
ing fact is that there are two Youtube videos in the
top 50. Both are very popular songs that went viral
via Social Media and therefore mainly scored high on
Facebook and Twitter. Theoretically there could be
sources missing that have never been indexed by the
search engine. That would be rather unlikely though,
because indexing is based mainly based on visits and
you would expect that the most popular Webpages on
the Web would have been visited at least once during
this study by one or more users. It could be the case
KDIR2014-InternationalConferenceonKnowledgeDiscoveryandInformationRetrieval
74
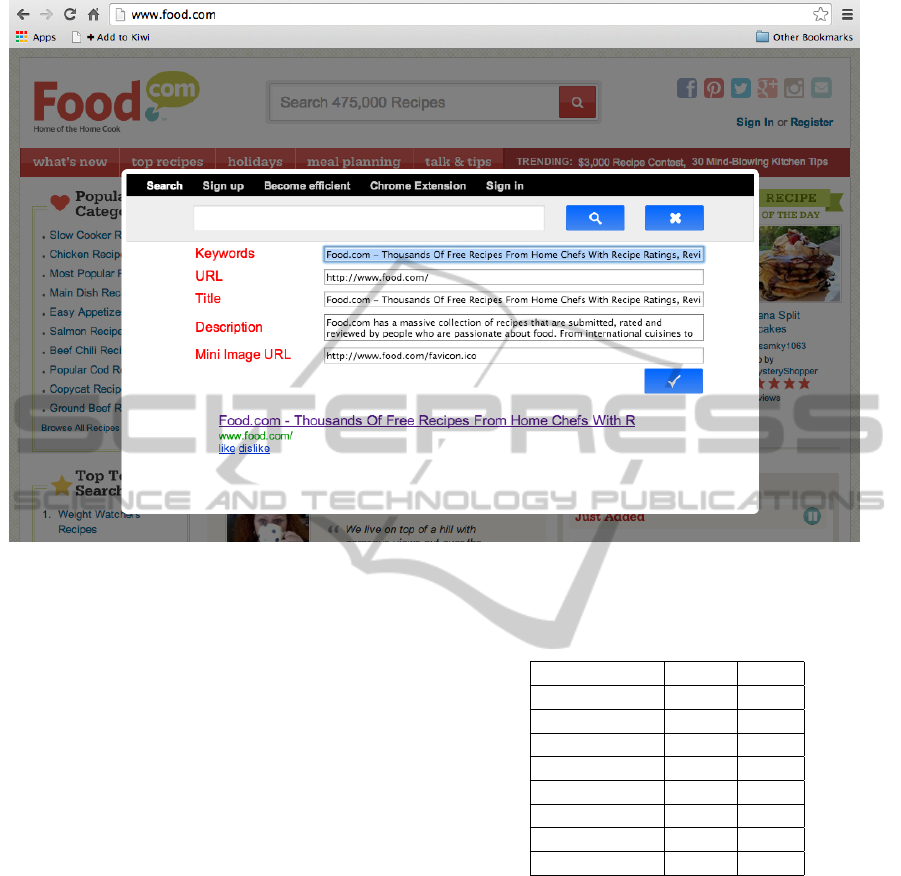
Figure 2: Example of how a Link could be added using the bookmarklet.
that there is a website in a large country or continent
of which no users participated in the experiment. Al-
though we do not have exact data on where people
came from that installed the extension that supported
automatic browse behaviour tracking, we do have data
about where the visitors of the search engine proto-
type came from. A map showing the distribution of
sessions over the world is shown in Figure 3. The sec-
ond biggest source of resources was Delicious. Deli-
cious is used by a way broader audience which also
decreases the chance that we are missing an impor-
tant URL in our Top 50 according to the Social Score.
Obviously, the ranking presented in Figure 4 changes
over time. With every like, share or other form of
Social Media interaction with respect to a Webpage,
the ranking of the resource changes. It was outside
the scope of this research to determine how often the
Social Score should be updated.
5 CONCLUSIONS
The proposed concept of a Social Score for every web
resource based on online Social Signals from Social
Media platforms such as likes and shares is a promis-
ing alternative to existing methods to determine the
query-independent importance of Webpages. We con-
clude that the proposed Social Score S is a good alter-
Table 2: Social Signal Scores and Social Scores of
http://www.kdir.ic3k.org/ and http://www.kdd.org/ based on
data acquired on the 23rd of april 2014.
KDIR KDD
Facebook 51 45
Twitter 1 11
Google+ 1 12
Pinterest 0 0
StumbleUpon 2 1
Delicious 8 39
LinkedIn 0 1
Social Score 0.54 0.87
native for the more computational expensive PageR-
ank and SocialPageRank methods in which iterative
matrix multiplications are required. The Social Score
of one Webpage W can be calculated in constant time
and calculating the Social Scores for all Webpages W
in a Corpus C would therefore be calculated in O(|W |)
time, so linear in the number of Webpages. Further-
more, contrary to PageRank and SocialPageRank, up-
dating one score of one Webpage is actually possible
using the Social Score method without any overhead.
The Social Score could be a complementary property
to take into account in existing search methods. By
making use of the Social Score a shift can be made
towards the Like Economy, away from the Link Econ-
omy. This way, all internet users will gain more direct
influence on the ranking of results. It would indicate
TheSocialScore-DeterminingtheRelativeImportanceofWebpagesBasedonOnlineSocialSignals
75
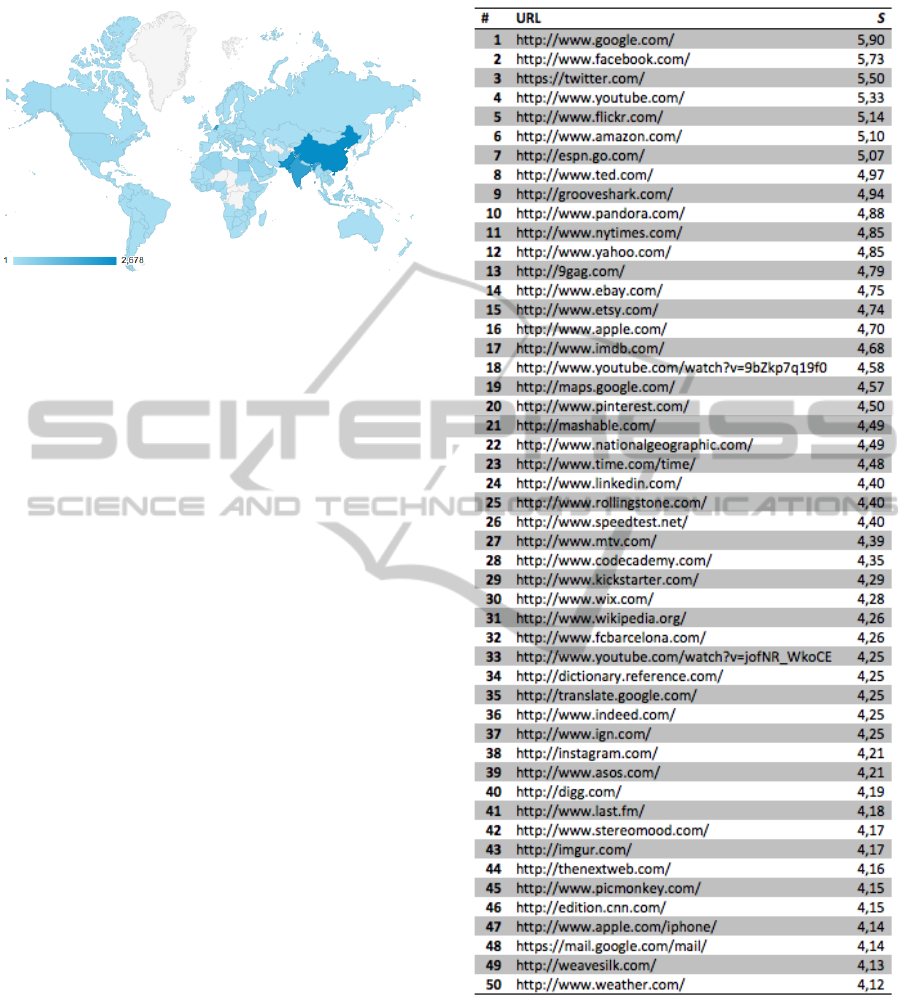
Figure 3: Distribution of sessions over the world measured
from the first of june 2013 till the seventh of january 2014.
Acquired using Google Analytics.
a shift from an Aristocracy in which the power is in
the hands of the technically skilled web authors and
developers to a direct democracy for Web Search.
More research should be performed to determine
the quantity of likes compared to the quantity of links
available on the Web. Also the quality of Social Sig-
nals with respect to links could be compared in an ex-
periment with a double blind test in which two identi-
cal search engines are used except one is using PageR-
ank and the other is using the Social Score. When a
user poses a query, both search methods are queried
and the results are mixed as described by Joachim
(Joachims, 2002). Based on which search engine re-
ceives the most number of clicks it can be determined
which search method is performing better. This way,
PageRank could be used as a baseline method to be
able to measure the performance of the Social Score.
The same kind of experiment could be performed to
compare the Social Search method with SocialPageR-
ank. It would also be interesting to experiment with
the effects of taking into account different numbers
of Social Signals from different numbers of Social
Media platforms. It could be investigated whether
Facebook Signals are from higher quality than Twit-
ter Signals and whether bias can actually be removed
by taking into account more Social Signals and Social
Media platforms. More traditional experiments could
also be performed to measure the impact on precision
and recall of the proposed Social Score.
A potential problem that might have impact on the
performance of search engines making use of the So-
cial Score could be a bias towards Social Media web-
sites, in particular the ones that are used to calculate
the Social Score. One could imagine that a Facebook
page on average receives significantly more Facebook
likes than a traditional Webpage. One solution could
be to take into account platforms such as Delicious,
which are all about traditional Webpages. Also, on
most Social Media platforms it is possible to share
Figure 4: Top 50 URLs worldwide according to Social
Score S on march 27th 2014.
traditional Webpages. A few examples are Twitter,
LinkedIn and Facebook. The effects on ranking could
be investigated in future research.
Also, the proneness of the Social Score to mali-
cious use and spam should be evaluated. Would it
be easier or harder to influence the ranking of results
when Likes are used instead of Links to determine
the value of Webpages? Research could be performed
KDIR2014-InternationalConferenceonKnowledgeDiscoveryandInformationRetrieval
76

to investigate how such malicious use of the Social
Score could be prevented effectively. One direction
for a solution might be to use many Social Media
Platforms to force spammers to spam many different
systems. One advantage of the Social Score is that
spam and malicious use is not only the problem of
the Search Engine, but also a direct problem for the
Social Media platforms at hand.
Last, the moments in time on which likes were as-
signed to resources could be taken into account. Fu-
ture research could be performed to measure the ben-
efits of such a change to the system. However, calcu-
lations would become more complex and most APIs
of Social Media platforms will not provide this infor-
mation. Therefore, in practice such a change to the
proposed algorithm would probably cost much effort
to achieve in practice and result in a less flexible and
less generally applicable concept.
REFERENCES
Bao, S., Xue, G., Wu, X., Yu, Y., Fei, B., and Su, Z. (2007).
Optimizing web search using social annotations. In
Proceedings of the 16th international conference on
World Wide Web, pages 501–510. ACM.
Berners-Lee, T., Hendler, J., Lassila, O., et al. (2001). The
semantic web. Scientific american, 284(5):28–37.
Brin, S. and Page, L. (1998). The anatomy of a large-scale
hypertextual web search engine. Computer networks
and ISDN systems, 30(1):107–117.
Evans, B. M. and Chi, E. H. (2008). Towards a model of un-
derstanding social search. In Proceedings of the 2008
ACM conference on Computer supported cooperative
work, pages 485–494. ACM.
Gerlitz, C. and Helmond, A. (2013). The like economy:
Social buttons and the data-intensive web. New Media
& Society, 15(8):1348–1365.
Golder, S. A. and Huberman, B. A. (2006). Usage patterns
of collaborative tagging systems. Journal of informa-
tion science, 32(2):198–208.
Golovchinsky, G., Pickens, J., and Back, M. (2009). A tax-
onomy of collaboration in online information seeking.
arXiv preprint arXiv:0908.0704.
Heymann, P., Koutrika, G., and Garcia-Molina, H. (2008).
Can social bookmarking improve web search? In
Proceedings of the international conference on Web
search and web data mining, pages 195–206. ACM.
Hu, Y., Xin, G., Song, R., Hu, G., Shi, S., Cao, Y., and Li,
H. (2005). extraction from bodies of html documents
and its application to web page retrieval. In Proceed-
ings of the 28th annual international ACM SIGIR con-
ference on Research and development in information
retrieval, pages 250–257. ACM.
Joachims, T. (2002). Unbiased evaluation of retrieval
quality using clickthrough data. In SIGIR Workshop
on Mathematical/Formal Methods in Information Re-
trieval, volume 354. Citeseer.
Manning, C. D., Raghavan, P., and Sch
¨
utze, H. (2008). In-
troduction to information retrieval, volume 1. Cam-
bridge University Press Cambridge.
Noll, M. G. and Meinel, C. (2007). Web search personal-
ization via social bookmarking and tagging. In The
Semantic Web, pages 367–380. Springer.
Salton, G. and McGill, M. J. (1983). Introduction to modern
information retrieval.
Yanbe, Y., Jatowt, A., Nakamura, S., and Tanaka, K. (2007).
Can social bookmarking enhance search in the web?
In Proceedings of the 7th ACM/IEEE-CS joint confer-
ence on Digital libraries, pages 107–116. ACM.
TheSocialScore-DeterminingtheRelativeImportanceofWebpagesBasedonOnlineSocialSignals
77
