
Robust Estimation of Load Performance of DC Motor using Genetic
Algorithm
Jong Kwang Lee, Byung Suk Park, Jonghui Han and Il-Je Cho
Nuclear Fuel Cycle Process Technology Development Division, Korea Atomic Energy Research Institute, Daejeon, Korea
Keywords: Load Performance, Multi-objective Optimization, Normalized Ratio of Errors.
Abstract: This paper presents a novel approach to estimate the load performance curves of DC motors whose
equations are represented as a function of the torque based on a steady-state model with constraints. Since a
simultaneous optimization of the curves forms a multi-objective optimization problem (MOP), we apply an
optimal curve fitting method based on a real-coded genetic algorithm (RGA). In the method, we introduce a
normalized ratio of errors to solve the MOP without the use of weighting factors and the nominal
parameters to automatically determine the searching bounds of the curve parameters. Compared to the
conventional least square fitting methods, the proposed scheme provides robust and accurate estimation
characteristics even when fewer measurements with a small range of torque loading are taken and used for a
data fitting.
1 INTRODUCTION
DC motors are widely used in applications ranging
from toys to automobiles. To fulfil the increasing
demands for quality and safety assurances, various
electrical tests including a performance test, a
durability test, a vibration or noise test, etc. are
being performed (Soukup, 1989). Among these tests,
the load performance test plays an important role in
verifying an agreement on the design properties and
evaluating the load performance of the motors.
Accordingly, the results of the test should have a
high reliability and repeatability.
To obtain the load performance curves or
characteristic values of DC motors, two methods
have been performed. Firstly, the steady-state test
was recommended by IEEE Std 113-1985 (1985)
and it is widely used in the industrial fields.
Readings of the current, voltage, speed, torque, and
temperatures should be obtained for six load points
equally spaced from 0.25 to 1.5 times the rated load.
During the load increases and decreases, two sets of
readings are taken at the specified load points, and
then their average value is usually chosen as a final
result. The main advantage of this method is that the
results are more accurate when compared with other
methods based on estimation. However, this method
has a disadvantage in that the time to accomplish all
the test procedures is excessive, causing the motors
to heat up severely owing to the necessity of a wide
range of torque loadings. Therefore, it is
recommended that temperatures such as the ambient
temperature, armature temperature, and field coil
temperature, should be measured to compensate for
the heating effects in the data.
Secondly, Nakamura, Kurosawa, Kurebayashi
and Ueha (1991) proposed the transient response
method to estimate the torque-speed characteristics
and the torque-efficiency characteristics of an
ultrasonic motor. It was assumed that the step
response of the speed has first order characteristics.
Its main advantage is that the torque-based
characteristic curves can be obtained from the
transient response of the speed without any
measurements of the torque. Therefore, all the
procedures can be accomplished within the transient
time of the motor, which can avoid the effects
arising from the temperature changes. In their
experiments, however, the maximum estimation
error was about 10%, which may prevent an accurate
estimation of the characteristic values.
Our research was motivated by the desire to find
a scheme that is faster than the steady-state test and
more accurate than the transient response test. To
accomplish the objectives, a new curve fitting
method based on a real-coded genetic algorithm
110
Lee J., Park B., Han J. and Cho I..
Robust Estimation of Load Performance of DC Motor using Genetic Algorithm.
DOI: 10.5220/0005008301100116
In Proceedings of the 4th International Conference on Simulation and Modeling Methodologies, Technologies and Applications (SIMULTECH-2014),
pages 110-116
ISBN: 978-989-758-038-3
Copyright
c
2014 SCITEPRESS (Science and Technology Publications, Lda.)

(RGA) was proposed and implemented by using the
steady-state measurements.
2 LOAD PERFORMANCE OF DC
MOTOR
The loop equation for the electrical circuit of a DC
motor is
a
aaab
dI
EL RIE
dt
(1)
where
, , ,
abaa
EEIR
, and
L
are the armature
voltage, back-electromagnetic force (EMF), current,
resistance, and inductance, respectively. The
electromagnetic torque
T
produced by the motor is
represented as
ata
TkI KI
(2)
where
and
t
K
are the magnetic flux and the
torque constant, respectively. The back-EMF is
proportional to the rotor speed
by the relation
bb
EK
(3)
where
b
K
is the back-EMF constant.
Under a steady-state operation condition,
substituting (2) into (1) for solving
T
gives
ttb
a
aa
KKK
TE
RR
. (4)
It can be rewritten as
12
T
. (5)
Assuming that the speed is zero at the stall torque,
s
T
, then the steady-state torque-speed equation can
be rewritten as
()
s
TT
(6)
where
is obtained by the constrained linear least
square regression of number of measurements as
1
2
1
()
()
n
isi
i
n
is
i
TT
TT
. (7)
The mechanical output power is defined by the
product of the torque and the speed. Since the speed,
as given in (5), is a linear function of the torque, the
power equation should be a quadratic form:
2
123
o
PT T T
(8)
Assuming that the power should be zero when
the torque or the speed is zero, then we could obtain
the following torque-power equation as
()
os
PTTT (9)
where
is determined by a constrained 2nd order
polynomial fitting based on a least square regression
of
n
number of measurements as
2
1
22
1
()
()
n
isii
i
n
isi
i
TTTP
TTT
(10)
The efficiency of a DC motor is the ratio between
the mechanical output power
o
P
and the electrical
input power
i
P
determined by the product of the
voltage and the current. Assuming that the electrical
input power is a linear function of the torque since
the input voltage to the motor is constant and the
current is proportional to the torque, then we obtain
the following torque-efficiency equation:
2
123
45
.
o
i
PcTcTc
T
PVI cTc
(11)
It can be rewritten as
3
12
4
.
T
T
(12)
Assuming that the efficiency should be zero when
the torque is zero:
3
4
2
(13)
and the efficiency should be zero at the stall torque:
2
12 2
3
1
,
s
T
(14)
then (12) is reduced to the following simplified form:
21 2
12
12
()
.
()
s
s
T
T
TT
(15)
Since the efficiency function in (15) is continuous
and differentiable, a nonlinear least square
regression could be applied to obtain a best-fit curve.
Figure 1 shows the load performance curves of a
DC motor, where the speed, current, power, and
efficiency equations are drawn as a function of the
torque. As previously mentioned, each curve in the
load performance curves can be obtained separately
based on the least square fitting methods (LSFMs).
RobustEstimationofLoadPerformanceofDCMotorusingGeneticAlgorithm
111

Note that the separately fitted load performance
curves are obtained by solving three single-objective
optimization problems. However, owing to the
existence of signal noises and the electromagnetic
changes of the motor in the test, the curves based on
the LSFMs do not exactly meet the physical
constraint where the speed, power, and the
efficiency should all be zero at the stall state. If the
stall torque is able to estimated first, then the
optimized curves can be easily determined by using
(7), (10), and (15). As preliminary experiments to do
this, we estimated the stall torque by using a linear
fitting of the torque-speed curve. However, this
method has a drawback in that the overall goodness-
of-fit is significantly affected by the speed
measurements. Therefore inaccurate results may be
obtained if noisy signals exist in the speed readings
and these may be increased if an insufficient range
of the measurements are taken.
In the load performance curves, three curves
should be optimized simultaneously while satisfying
the constraint. However, since no improvement on
the goodness-of-fit in any curve is possible without
sacrificing at least one of the other curves, the
estimation problem forms a multi-objective
optimization problem. In this work, we proposed and
implemented a GA based fitting method (GAFM) to
solve the MOP.
Figure 1: Typical load performance curves of a DC motor.
3 GA-BASED LOAD
PERFORMANCE ESTIMATION
A real-coded genetic algorithm (RGA) has been
applied to obtain the optimized load performance
curves of the DC motors. The RGA is known to
provide accurate solutions even when the system
model has a lack of information about the solution
and when it has complex constraints. These features
have enabled the genetic algorithm to be
successfully applied for a parameter identification of
induction motors (Nangsue, Pillay and Conry, 1999
and Huang, Wu and Turner, 2002) and a noise-free
curve fitting problem (Duliu-Barton and Worden,
2003).
3.1 Representation
Let
q
be a vector consisting of the characteristic
curve parameters, that is,
T
12
, , , ,
s
Tq
(16)
For a notational convenience, we rewrite
q
as,
T
12 5
, , , qq qq
(17)
where
12
, qq
, and
5
q
correspond to ,
, and
s
T
respectively. Searching bounds of the parameters are
set as
, ; 1,2, ,
LU
iii
qqq i n
(18)
where
L
i
q
and
U
i
q
denote the lower and upper
bounds of
i
q
, respectively.
In this work we select the bounds of the curve
parameters based on the nominal parameters which
were obtained by the results of three curve fittings
which were performed separately. Since the stall
torques estimated by each curve fitting may be
different, an average value of the three estimates is
used for a nominal parameter of the stall torque. The
searching bounds can be determined by setting the
i
k
in the range [0,1] as
0
0
(1 )
(1 )
L
iii
U
iii
qkq
qkq
(19)
where
0i
q is a ith nominal parameter and
i
k is a
scaling constant of the parameter bounds. In the
following, we represent the curve parameters as real
genes of RGA,
k
ij
q
, where
, ij
, and k mean the
chromosome, population and generation,
respectively.
3.2 Fitness Function
The simultaneous optimization of multiple
objectives is a challenging subject. In a single
Load Torque
Speed
Speed
b
a
K
E
S
T
M
T
True free rpm
Theoretical free rpm
Load Torque
Current
Current
t
K
1
S
T
M
T
Stall current
No load current
Load Torque
Output Power
Output Power
S
T
Load Torque
Efficiency
Efficiency
S
T
00
00
(a) Torque-Speed (b) Torque-Current
(c) Torque-Power (d) Torque-Efficiency
Load Torque
Speed
Speed
b
a
K
E
S
T
M
T
True free rpm
Theoretical free rpm
Load Torque
Current
Current
t
K
1
S
T
M
T
Stall current
No load current
Load Torque
Output Power
Output Power
S
T
Load Torque
Efficiency
Efficiency
S
T
00
00
(a) Torque-Speed (b) Torque-Current
(c) Torque-Power (d) Torque-Efficiency
SIMULTECH2014-4thInternationalConferenceonSimulationandModelingMethodologies,Technologiesand
Applications
112

objective case, we can obtain the best solution which
is absolutely superior to all the other alternatives.
However, in a multiple objectives case, there usually
exists a set of solutions, so-called Pareto optimal
solutions, which cannot be simply compared with
each other because of an incommensurability and
conflict among the objectives (Mitsuo and Runwei,
1990). A solution may be best for one objective but
the worst for other objectives and no improvement
in any objective function is possible without
sacrificing at least one of the other objective
functions. As a basic and the easiest approach, the
weighted-sum approach was used to simplify the
multi-objective optimization problem, which assigns
weights to each objective function and combines
them into a single objective function as
()
kk
k
Ffq
(20)
where
k
f
is one of the objective functions;
k
is a
weighting factor used to ensure that one objective
does not dominate the total fitness,
F
. However, it
is usually very difficult to determine a set of
appropriate weights for a given problem.
To apply a fitness function to the multi-objective
optimization problems without any use of weighting
factors, we introduced a normalized ratio of the
errors (NRE) derived from a summed square error.
A summed square error of the point-by-point
difference between the measured value
i
y and its
estimated value
i
y
was defined as
222 2
11 1 1 1
() 2
mm m m m
ri ii i iii
ii i i i
Se yy y yyy
(21)
Let a NRE,
R
, be a performance index of the
goodness-of-fit as
1
22
11
2
R
m
ii
i
mm
ii
ii
yy
yy
(22)
then the perfect fitting with
0
r
S
occurs at
R=1
.
Since the NRE is always less than or equal to 1, its
sum can be used to solve the multi-objective
optimization problem without the use of weighting
factors. We can obtain an optimal solution of the
curve parameters
q
through maximizing the fitness
function of the following form:
SPE
RRR
()
N
F q
(23)
where
SP
R, R
, and
E
R
are NREs related to the
speed, the power, and the efficiency curve,
respectively and
N
, the number of single objective
functions, is used to normalize the overall fitness
function
()F
q
.
3.3 Genetic Operators
In general, GAs include operations such as a
reproduction, crossover, and mutation. Selection for
a reproduction is a process to choose some
individuals of high fitness for breeding. The
commonly used roulette wheel selection is adopted
in this work. Let
()
i
F q
be a fitness function of an
individual,
i
q
, then the selection probability
i
p
of
i
p
is determined as
1
()
()
i
i
N
j
j
F
p
F
q
q
(24)
Because the selection method given in (24) is based
on a probabilistic selection, then the high fitness
chromosomes may not be selected in the next
generation. To solve this problem, the best
individual in the old population replaces the worst
one in the new population.
Crossover provides a mechanism for an
individual to exchange genetic information via a
probabilistic process. Let the parent,
(, )
kk
il jl
qq
,
denote two chromosomes selected randomly for a
crossover, then the children,
(, )
kk
il jl
qq
, are
determined by an arithmetic crossover (Mitsuo and
Runwei, 1990) based on a vector convex
combination as
(1 )
(1 )
kk k
il il jl
kk k
jl jl il
qq q
qq q
(25)
where
is a random number uniformly distributed
in the range [0,1].
Even though a selection and crossover operation
effectively search and recombine a possible solution,
occasionally they may lose potentially useful genetic
information. The role of a mutation operation is to
mutate to certain genes of the individuals and
recover the lost useful information. In this work, we
used the dynamic mutation operator [10] designed
for a fine-tuning with a high precision. If a real gene
k
ij
q
in a chromosome vector,
1
,,,,
kk k k
ii ij in
qqqq
is selected for a mutation, then the result of the
mutation operation is obtained as
RobustEstimationofLoadPerformanceofDCMotorusingGeneticAlgorithm
113

1
,, ,,
kk k k
ii ij in
qq qq
(26)
where
k
ij
q
is given by
(, ), 0
(, ), 1
kUk
ij j ij
k
ij
kkL
ij ij j
qkqqif
q
qkqqif
(27)
where
k
is the number of generations performed,
and
is the random number with 0 or 1.
(, )
ky
is
determined by
(1 / )
(, ) [1 ]
b
tT
ky y r
(28)
where
r
is the random number with the range of
[0,1],
T
is the number of preset maximum
generations,
b
is a preset constant for determining
the degree of a non-uniformity. The dynamic
mutation operator given in (27) makes it possible to
search the space uniformly with a small
k
and very
locally with
kT
.
4 EXPERIMENT
AND DISCUSSION
4.1 Measurement System
The proposed curves fitting method based on GA
has been verified by experimental studies. A
measurement system, shown in Figure 2, was
developed by using off-the-shelf components such
as hysteresis brakes, a torque transducer with an
inductive proximity sensor, a power analyzer, and
power supplies. Two serially connected hysteresis
brakes could produce a precise load torque up to
243kgf
cm, which is independent of the shaft speed.
The inductive proximity sensor produces an open-
collector speed output which is transformed into an
analog signal by a frequency to voltage converter
(FVC). A torque transducer TM210 manufactured
by Magtrol is able to measure a torque up to
Figure 2: Schematic of the measurement system.
490kgfcm. A power analyzer WT200 manufactured
by Yokokawa was used to measure the voltage, the
current, and the electric power. A data acquisition
board was installed in a PC to measure the analog
signals and it was also used to control the load
torque. The developed algorithm was implemented
by means of C++ language.
4.2 Results and Discussion
To evaluate the effectiveness of the proposed GA-
based fitting method (GAFM), we conducted load
performance tests on several DC operated electric
tools consisting of a permanent magnet DC motor, a
reduction gear, etc. Throughout the following
experiments, we used a population size of 100, a
maximum generation of 200, a crossover probability
of 0.9, and a mutation probability of 0.1 as control
parameters of the GA. Since the GA sets the initial
real genes in a random manner, it may seek out
different maxima depending on the initial conditions.
Therefore, we selected the final parameters as those
with the highest fitness value from 10 different runs.
It takes less than 1 second to execute all 200
generations.
We first investigated how various searching
bounds of the curve parameters affect the
performance of the proposed scheme. As previously
mentioned, the searching bounds were determined
by setting a
i
k
of (19) in the range of 0 to 1, which
indicates that the searching spaces cover the ±
i
k
100% range of the nominal parameter
0i
q
. Table 1
provides the nominal parameters and their estimated
values corresponding to 5 different
i
k
s. Even though
the searching bounds are considerably enlarged by
up to ±50% of the nominal parameters, the estimates
are converged to almost the same values. This shows
the fact that the GAFM can estimate curve
parameters with small errors without the need for
good initial estimates and that the enlarging
searching spaces have only a marginal impact on the
estimation accuracy.
Next, we investigated whether the number of
data sets used for a curve fitting affects the
goodness-of-fit. Figure 3 shows the load
performance curves obtained based on the
conventional least square fitting methods (LSFMs)
and GAFM. In the LSFMs, the curves are obtained
by solving three single curve (or objective)
optimization problems separately, while the GAFM
optimizes the multiple curves simultaneously.
Therefore, it is natural that the goodness-of-fit of
LSFMs outperforms that of the GAFM if we are
DC operated
electric tool
FAN
FAN
Rectifier
0~50VDC,
150A
DC power supply
Digital
power
meter
Data acquisition unit
Torque
transducer
Hysteresis
brakes
T
IE,
load control
FVC
DC operated
electric tool
FAN
FAN
Rectifier
0~50VDC,
150A
DC power supply
Digital
power
meter
Data acquisition unit
Torque
transducer
Hysteresis
brakes
T
IE,
load control
FVC
SIMULTECH2014-4thInternationalConferenceonSimulationandModelingMethodologies,Technologiesand
Applications
114
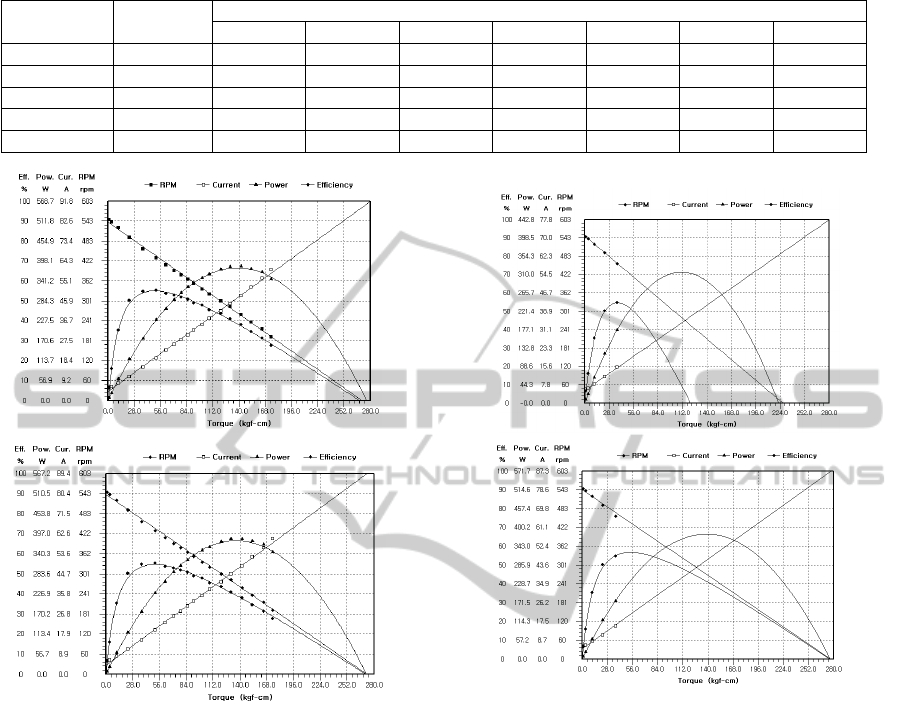
Table 1: Parameter estimation results corresponding to 5 different searching spaces.
Parameters
Nominal
values
Estimated values
k
i
= 0.1 k
i
= 0.2 k
i
= 0.3 k
i
= 0.4 k
i
= 0.5 mean Stdev.
α -2.0 -1.989 -1.987 -1.985 -1.988 -1.990 -1.988 1.924E-3
β -0.0198 -0.02039 -0.02036 -0.02034 -0.02038 -0.02040 -0.02037 2.408E-5
γ
1
-0.325 -0.3226 -0.3220 -0.3219 -0.3227 -0.3228 -0.3224 4.307E-4
γ
2
92.35 92.81 92.69 92.70 92.87 92.86 92.79 8.648E-2
T
s
272.3 272.3 272.5 272.7 272.4 272.3 272.5 0.1658
Figure 3: Load performance curves obtained with 19 data
sets based on LSFMs (top) and GAFM (bottom).
concerned about each curve separately. However,
owing to the existence of the signal noises and
electromagnetic changes of the motor in the test, the
curves based on LSFMs do not meet the physical
constraints in that the three curves meet in the stall
torque. Therefore a sufficient range of the
measurements is required to apply LSFMs to fit the
load performance curves. On the contrary, in the
case with 5 data sets, GAFM is superior to the
LSFMs from the aspect of the physical
characteristics and an accuracy. This is due to the
fact that the constraints of the curves in the GAFM
can help to improve the goodness-of-fit.
Furthermore, the curves shown in Figure 4 were
obtained by using the data sets whose maximum
load torque is about 13.4% of the stall torque, which
are almost the same results as shown in Figure 3
whose maximum load torque is about 62% of the
full load. This indicates that a sufficient accuracy
Figure 4: Load performance curves obtained with 5 data
sets based on LSFMs (top) and GAFM (bottom).
can be achieved with a small number of
measurements and/or a small range of torque
loadings in the GAFM.
5 CONCLUSIONS
In this paper, we solved the load performance
estimation problem of DC motors through an
optimal fitting of multiple curves with constraints.
Although the load performance curves could be
fitted separately by using the conventional least
square curve fitting methods, a wide range of
measurements is required to improve the goodness-
of-fit. As an alternative, we proposed a new curve
fitting method based on a genetic algorithm. In the
method, a normalized ratio of the errors was used to
optimize the multi-objective functions without the
use of weighting factors and the searching bounds of
RobustEstimationofLoadPerformanceofDCMotorusingGeneticAlgorithm
115

the curve parameters could be automatically
determined by using the nominal parameters. From
the experimental studies on several DC operated
electric tools, we concluded that the proposed and
implemented GAFM could be applied to obtain
robust and reliable load performance curves of DC
motors even when fewer measurements with a small
range of the torque loading are taken and used for a
data fitting.
ACKNOWLEDGEMENTS
This work was supported by Nuclear Research &
Development Program of National Research
Foundation of Korea (NRF).
REFERENCES
ANSI/IEEE Std. 113-1985. (1985). IEEE Guide: Test
Procedures for Direct-Current Machines. 1-39.
Duliu-Barton, J. M. and Worden, K. (2003). Genetic
identification of crack-tip parameters using
thermoelastic isopachics. Meas. Sci. Technol. 14. 176-
83.
Huang, K. S., Wu, Q. H., Turner, D. R. (2002). Effective
identification of induction motor parameters based on
fewer measurements. IEEE Trans. on Energy
Conversion. 17. 447-53.
Flynn, A. M. (1998). Performance of ultrasonic mini-
motors using design of experiments. Smart Mater.
Struct. 7. 286-94.
Michalewicz, Z. (1996). Genetic algorithm+data
structures= evolution programs. Berlin: Springer.
Mitsuo, G. and Runwei, C. (1990). Genetic algorithms and
engineering optimization. New Jersey: Prentis hall.
Nakamura, K., Kurosawa, M., Kurebayashi, H., Ueha, S.
(1991). An estimation of load characteristics of an
ultrasonic motor by measuring transient responses.
IEEE Trans. On Ultrasonics, Ferroelectrics, and
Frequency Control. 38. 481-5.
Nangsue, P., Pillay, P., Conry, S. E. (1999). Evolutionary
algorithms for induction motor parameter
determination. IEEE Trans. on Energy Conversion. 14
447-53.
Soukup, G. C. (1989). Determination of motor quality
through routine electrical tests. IEEE Trans. on
Industry Applications. 25. 873-880.
SIMULTECH2014-4thInternationalConferenceonSimulationandModelingMethodologies,Technologiesand
Applications
116
