
Kinematic Analysis in Official Soccer Matches: Preliminary Results
GPS Analysis in Soccer Matches
Gabriele Mascherini
1,2
, Andrea Cattozzo
1,2
, Giorgio Galanti
1
and Stefano Fiorini
2
1
Sports Medicine Center, University of Florence, largo Brambilla 3, Florence, Italy
2
Italian Football Athletic Trainers Association, via D’Annunzio, Florence, Italy
Keywords: GPS, Match Analysis, Soccer.
Abstract: Soccer match analysis was initially establish by coach to evaluate tactical aspects, after this approach was
used for physical effort. Previously this assessment has been done by video interpretation of the matches.
The aim of this study was to analyze the official matches in adults athletes for the first time with a wearable
device as GPS. Five official games of sixth division of Italian Football League were assessed with GPS
system. Parameters represented the volume of physical activity as Total Distance covered and Relative
Distance derived directly from the instrument, while the values of intensity as speed, acceleration and
deceleration have been indexed respect to the maximum individual of each athletes. Was also made a
tactical analysis respect the roles of players. Values of volume shows lower values than previous studies,
while the values of intensity confirm the data present in the literature. Tactical analysis shows
predominantly low speed for defenders, medium for midfielders and high speed for forward. Acceleration
not differ significantly between the roles. Decelerations are predominantly for midfielders. These are the
preliminary results of a larger study involved for the first time soccer official matches assessed with a
wearable system. In addition a new approach has been used in order to individualized threshold for speed,
acceleration and deceleration.
1 INTRODUCTION
Video analysis of matches was introduced into
soccer to check the roles assigned to each player and
the real tactics performance decided by the coach.
Soccer federal laws prevent players from wearing
any technological devices, therefore video analysis
is the only method allow to evaluate official
matches. This method was also used for physical
performance through parameters as “total distance
covered”, “speed” and “acceleration” (Mohr M,
2003; Bangsbo J., 1994).
Recently many studies were conducted in order
to find an uniform values on the metres covered by
athletes during a match. At present there are still
differences in “speed” and
“acceleration/deceleration” of soccer players in
official matches (Cummins C., 2013).
Respect “speed” values in a soccer match, the
researchers agreed to create six areas of intensity,
but the identification and the description of these is
still unclear.
At present there are few studies on the evaluation
of “acceleration” and these were made by sprint tests
during a training session (Castagna C, 2009; Bucheit
M, 2010).
Recent studies have introduced the use of the
Global Positioning System (GPS) as a tool for
analyzing the performance of athletes (Gray AJ,
2010).
Studies with GPS system in sports show a
growing attention to an individualized assessment.
One method is to identify the maximum value of
each athlete of team regard his performance of
“speed”, “acceleration” and “deceleration” (Abt G,
2009)
A second approach is to analyze tactical aspects
of each role in team sports (Di Salvo V, 2007).
The first aim of the study was to, for the first
time, report kinematic values of soccer performance
of five official matches with a wearable device. This
data will be compared with the ones present derived
from video match analysis.
The second aim was regard tactical aspects, in
order to verify any possible differences of physical
effort according to role of each soccer player.
205
Mascherini G., Cattozzo A., Galanti G. and Fiorini S..
Kinematic Analysis in Official Soccer Matches: Preliminary Results - GPS Analysis in Soccer Matches.
DOI: 10.5220/0004995402050209
In Proceedings of the 2nd International Congress on Sports Sciences Research and Technology Support (icSPORTS-2014), pages 205-209
ISBN: 978-989-758-057-4
Copyright
c
2014 SCITEPRESS (Science and Technology Publications, Lda.)

2 METHODS
Observational Study
An Italian Soccer team playing in Campionato di
Eccellenza (sixth division) was analyzed.
According with the Regional Committee of the
Italian Soccer Federation, players wear GPS devices
during all official matches of the regular season
2013/2014.
10 soccer players, (age 23.1±2.1 years, weight
73.7±5.3 kg, height 176.5±11.9 cm) wore under
their official shirts the GPS (K-Sport - Italy,
sampling frequency of 10 Hz), and kept on the
device on for the time they played during first five
matches of the season.
During the week before the first official match
tests were carried out to determine the maximum
value of speed, acceleration and deceleration of each
team member.
Every athletes, wearing the appropriate GPS
equipment, complete:
- three 50 m all out sprints to determine their
maximum speed,
- four 20 m all out shuttle sprints to determine their
maximum accelerations and maximum
decelerations.
Therefore during the regular season, at the end of
each match, GPS device was downloaded and the
data were analyzed, values were tabled and divided
into the following categories:
- time played (T, min);
- total distance covered (TD, m);
- relative distance - defined as the ratio between
total distance and time (RD, m/min).
In addition to these it tabled the values of speed,
deceleration and acceleration were divided into
zones:
- speed, divided into 6 zones (S1, S2, S3, S4, S5,
S6, m/sec);
- deceleration, divided into 4 zones (D1, D2, D3,
D4, m/sec
2
);
- acceleration, divided into 4 zones (A1, A2, A3,
A4, m/sec
2
).
Each division was estimated considering the
individual maximum value of speed, acceleration
and deceleration.
For the division of speed there is still no
consensus, however we chose the six zones present
in literature (Barbero Alvarez J, Hill-Haas SV,
2008), choosing the interval from 0% to 20% for S1
and then every 16% up to 100%, in order to have a
uniform percentage breakdown.
This is the first work with a threshold approach
for values of acceleration and deceleration, therefore
the four categories were chosen for every 25%.
The primary aim of the present study was to describe
the physical activity of soccer player for the first
time with the use of a wearable system, this being an
observational study no statistical analyses were
performed for this purpose.
The roles of the players for the tactical analysis
was decided to divide the 10 players in:
- 2 Full Back
- 2 Central Defender
- 3 Midfield
- 2 Lateral Forward
- 1 Forward
Averages and standard deviations were calculated
into a new subdivision, and then tested by the Anova
Test to establish any significant differences between
five different samples.
After five competitive games have been downloaded
from the GPS, 50 players who played at the start, we
eliminated from the statistics all the players replaced
during the match so that it does not interrupt the
minutes and the meters of complete match.
They were therefore excluded 10 athletes:
3 lateral defender, 2 central defender, 3 midfield, 1
lateral forward, 1 forward.
3 RESULTS
The average of maximum values obtained from tests
before the season are:
9.14±0.32 m/sec for speed
7.46±0.84 m/s
2
for acceleration
-8.06±0.95 m/s
2
for deceleration.
Therefore six zone of speed (S) are:
S1 = from 0 to 1.74±0.06 m/sec (6.3 km/h)
S2 = up to 3.13±0.11 m/sec (11.3 km/h)
S3 = up to 4.53±0.16 m/sec (16.3 km/h)
S4 = up to 5.92±0.21 m/sec (21.3 km/h)
S5 = up to 7.31±0.26 m/sec (26.3 km/h)
S6 = maximum is 9.15±0.32 m/sec (32.9 km/h)
The zone for acceleration (A) and deceleration (D)
are:
A1 = from 0 to 1.78±0.20 m/s
2
A2 = up to 3.55±0.40 m/s
2
A3 = up to 5.33±0.60 m/s
2
A4 = up to 7.46±0.84 m/s
2
D1 = from 0 to -1.92±0.23 m/s
2
D2 = up to -3.84±0.45 m/s
2
D3 = up to -5.76±0.68 m/s
2
D4 = up to -8.06±0.95 m/s
2
Results obtained during the matches are reported in
table 1.
icSPORTS2014-InternationalCongressonSportSciencesResearchandTechnologySupport
206
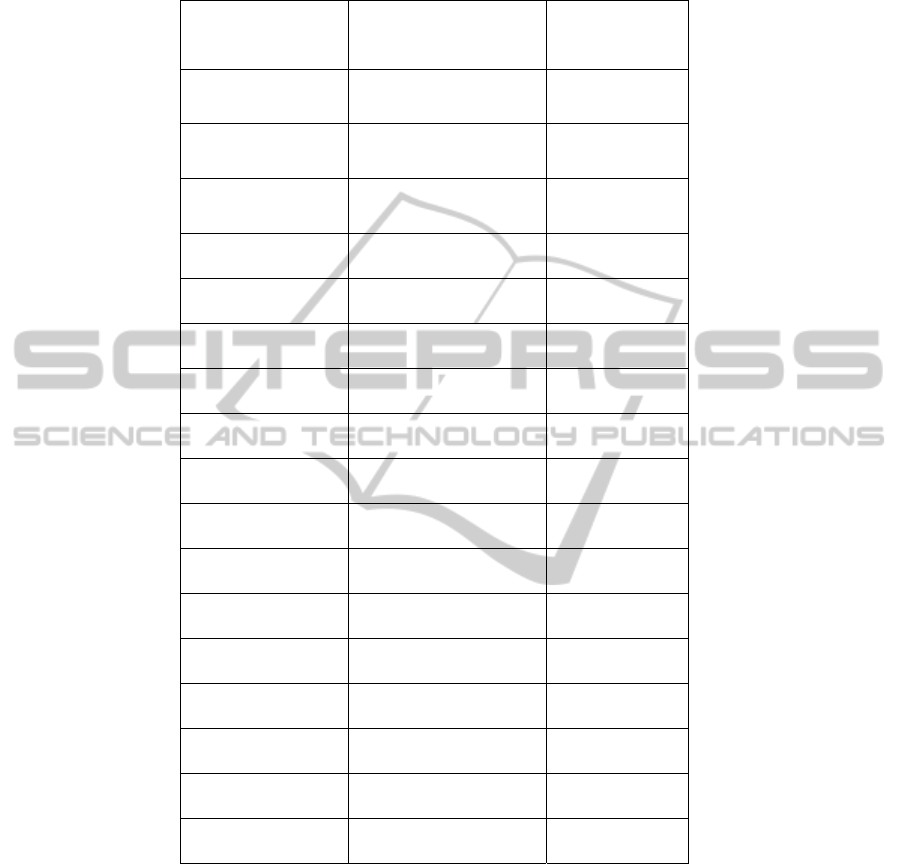
Table 1: values of “total distance covered” (TD), “relative distance” (RD) and “metres covered in different zones” of speed,
acceleration and deceleration during four official matches. The percentage in the right column is given by the ratio between
the different zones of T.
Mean ± SD % of TD
TD (m) 9591.9 ± 898.4
T (min:sec) 93:58
RD (m/min) 102.0 ± 7.9
S1 (m) 3552.2 ± 429.5 37.0
S2 (m) 2710.7 ± 392.7 28.2
S3 (m) 2188.3 ± 566.4 22.8
S4 (m) 828.2 ± 185.2 8.6
S5 (m) 262.3 ± 92.3 2.7
S6 (m) 50.2 ± 35.1 0.5
A1 (m) 4112.7 ± 455.2 42.8
A2 (m) 501.3 ± 69.3 5.2
A3 (m) 72.3 ± 14.9 0.7
A4 (m) 16.2 ± 4.3 0.2
D1 (m) 4089.1 ± 329.4 42.6
D2 (m) 422.1 ± 95.8 4.4
D3 (m) 65.8 ± 23.7 0.7
D4 (m) 11.2 ± 5.4 0.1
88% of total distance covered was below of
threshold of S3 corresponding at 16,3 km/h (52% of
maximum speed): only a small portion of the game
was played at high speeds.
95% of TD was ranged from -50% to 50% of speed
variation: therefore around 480 m was in
acceleration or in deceleration upper than 50% of
individual maximum.
The results reported for tactical aspects are
reported in table 2. The players who ran more meters
were midfielders (TD = 10102,1±629,1 m) and
lateral forwards (TD = 9759,3±889,6m).The speed
analysis shows that the majority of high speeds are
attributable to the forward, average speeds for
midfielders, and low speeds for defenders. The
evaluation of the acceleration showed no significant
differences in roles, while the deceleration show an
increased workload of midfielders at all intensities.
4 DISCUSSION
For a reliable data it is requires a larger number of
matches, in fact soccer has variables intrinsic in the
game such as opponents, pitch, match result,
weather and more.
KinematicAnalysisinOfficialSoccerMatches:PreliminaryResults-GPSAnalysisinSoccerMatches
207
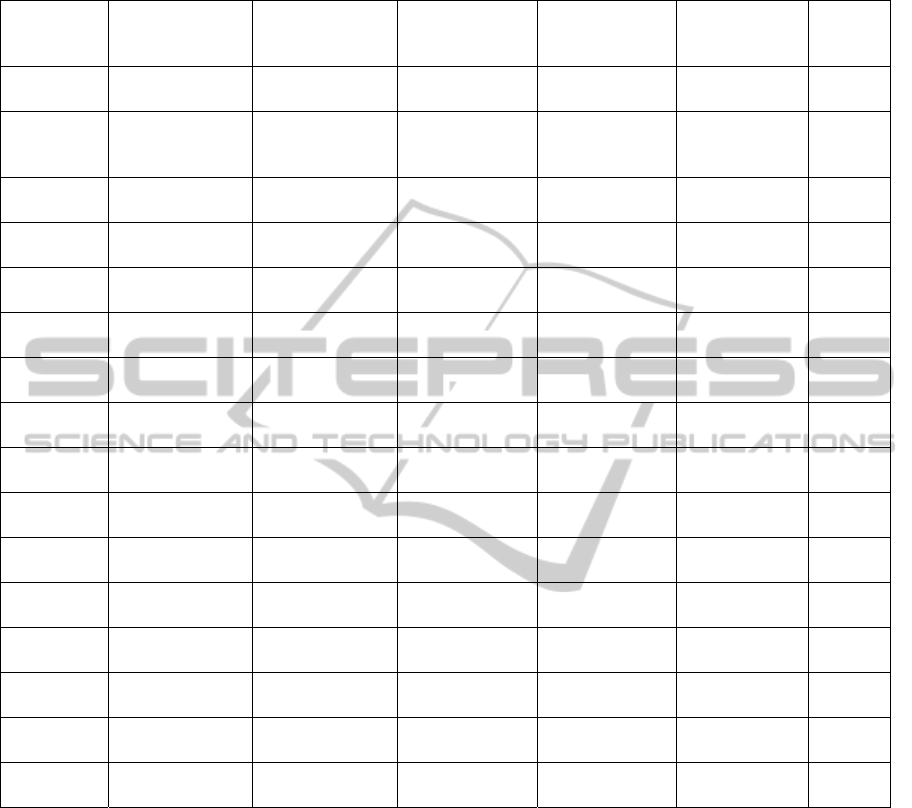
Table 2: values of “total distance covered” (TD). “relative distance” (RD) and “metres covered in different zones” of speed.
acceleration and deceleration during four official matches for each role.
ROLE Lateral
Defender
Central
Defender
Midfield Lateral
Forward
Forward Anova
TD (m) 9058.9±469.2 8571.2±635.5 10102.1±629.1 9759.3±889.6 9031.4±729.3 <0.01
RD
(m/min)
96.9±4.7 90.2±6.9 106.2±7.3 105.4±23.9 98.7±2.4 <0.001
S1 (m) 3251.1±348.4 3548.7±336.4 3227.8±318.1 3921.7±789.1 3537.2±521.1 <0.05
S2 (m) 2815.7±165.1 2332.4±161.0 2876.4±346.2 2551.1±774.8 2288.1±30.1 <0.05
S3 (m) 1985.1±168.8 1739.1±284.8 2754.7±362.1 2030.2±674.1 1754.7±286.2 <0.001
S4 (m) 769.1±117.1 699.3±128.7 977.1±185.9 888.7±287.1 912.4±103.7 <0.05
S5 (m) 223.2±50.1 215.2±80.1 210.6±53.1 325.1±110.1 421.3±111.7 <0.01
S6 (m) 20.9±10.8 51.7±41.4 25.2±22.1 65.3±30.1 118.7±86.9 <0.01
A1 (m) 3960.7 ±225.9 3710.1±332.1 4530.2±407.7 4270.3±579.2 3959.0±179.2 NS
A2 (m) 510.6±65.4 479.1±67.1 492.5±77.3 566.1±177.1 495.1±13.1 NS
A3 (m) 75.7±14.9 76.4±15.2 73.1±21.2 82.1±23.2 74.1±11.4 NS
A4 (m) 13.1±2.8 13.3±5.3 16.7±2.9 18.7±8.7 17.4±5.2 NS
D1 (m) 4074.2±224.5 3910.4±279.4 4365.8±288.7 4278.1±568.1 4131.7±443.1 <0.05
D2 (m) 384.7±76.5 352.7±42.4 506.9±94.1 464.1±121.1 320.1±30.9 <0.001
D3 (m) 51.1±20.1 52.70±8.8 87.1±28.7 85.7±21.4 37.2±7.7 <0.001
D4 (m) 7.1±3.2 7.4±2.1 13.7±6.1 13.2±3.2 2.4±2.1 <0.01
This study has the principal finding to investigate
the kinematic data as speed, acceleration and
deceleration in soccer players. Therefore the present
results are to be considered as preliminary results
that allow researchers to improve their evaluation of
larger series.
This is first study with data analysis directly
from GPS instrument in an official game of soccer
(Larsson P, 2003).
The approach to the analysis follows the trend of
recent major studies on sports match analysis: before
to evaluate the matches were performed test in order
to establish maximum values of speed, acceleration
and deceleration. Setting the maximum values of
speed, acceleration and deceleration is limited to
recording artefacts due to too high values for a given
athlete (Abt G, 2009).
The zones of percentage of speed, acceleration
and deceleration have been set according a scale for
each athlete: a standardized values cannot represent
the real intensity of the individual player.
A limitation of the present study is the
comparison of the parameters related to the
performance of athletes of Italian sixth division, and
the international top level generally found in
previous studies.
The results obtained from tests completed before
the start of the regular season showed high values of
maximum speed, but the data regarding the
maximum values of acceleration and deceleration
was the most interesting: the maximum values of
acceleration and deceleration are similar and very
icSPORTS2014-InternationalCongressonSportSciencesResearchandTechnologySupport
208

high. These maximum values are reached during the
games in fact only for negligible periods of time
within the ninety minutes.
Tactical analysis shown how the speed is specific
for different areas of the field, defenders and
forwards must therefore have high speed abilities to
be able to meet the demands of the game.
In addition particular attention is for the
deceleration in midfielders.
5 CONCLUSIONS
Sports science in soccer is constantly changing as
well as the methods used during the training in this
sport (Randers M, 2010). Initially in match analysis,
the most common
parameters were “total distance”
and “relative distance”: the first one only provides
information about the volume of physical effort; the
second one can be considered a simple parameter
estimating the intensity of physical activity.
The presence of ball in sports game influences
the physical engagement with sudden accelerations
and decelerations, recent studies show these as the
main parameters to be evaluated the intensity in
team sport, leaving at relative distance less value in
this particular evaluation (Di Salvo, 2009).
Video match analysis can considered a risk
factor in the estimation of athletes movements in
order to assess speed, acceleration and deceleration
only indirectly: the use of tools such as wearable
GPS in this evaluation should lead to a reduction of
estimation error.
If it compare the results between this study with
a wearable systems in sixth division and studies
reported with video analysis of top level athletes,
you may notice a greater volume of workload at high
levels (9591.9 ± 898.4 m versus 10950±1044 m), but
the characteristics of intensity is comparable
(Osgnach C., 2010).
On average every player:
runs approximately 1140 m with a speed
above 21.3 km/h,
along 88 m above the acceleration 3.5 m/s
2
,
along 77 m below the -3.84 m/s
2
.
The study of the physical effort following a tactic
division by roles can provide interesting ideas on
how to improve training methods according to the
different natures of physical demand in sport games
such as soccer.
ACKNOWLEDGEMENTS
The authors did not receive any financial support for
doing this analysis and presenting it in this report.
REFERENCES
Abt G, Lovell R, 2009. The use of individualized speed
and intensity thresholds for determining the distance
run at high-intensity in professional soccer. J Sports
Sci.;27(9):893–8.
Bangsbo J., 1994. Energy demands in competitive soccer.
J Sports Sci. Summer;12 Spec No:S5-12.
Barbero Alvarez J, Lopez M, Barbero Alvarez V, et
al.2008. Heart rate and activity profile for young
female soccer players. J Hum Sport Exerc;3(2):1–11.
Bucheit M, Mendez-Villanueva A, Simpson BM, et al.,
2010. Match running performance and fitness in youth
soccer. Int J Sports Med.;31(11):818–25.
Castagna C, Impellizzeri F, Cecchini E, et al. 2009.
Effects of intermittent-endurance fitness on match
performance in young male soccer players. J Strength
Cond Res.;23(7):1954–9.
Cummins C., R. Orr, H. O’Connor, C. West, 2013. Global
Positioning Systems (GPS) and Microtechnology
Sensors in Team Sports: A Systematic Review Sports
Med.;43(10):1025-42. doi: 10.1007/s40279-013-0069-
2.
Di Salvo V, Baron R, Tschan H, et al., 2007.Performance
characteristics according to playing position in elite
soccer. Int J Sports Med.;28(3):222-7.
Di Salvo V, Gregson W, Atkinson G, et al., 2009.
Analysis of high intensity activity in Premier League
soccer. Int J Sports Med.;30(3):205-12. doi:
10.1055/s-0028-1105950.
Gray AJ, Jenkins D, Andrews MH, et al. 2010. Validity
and reliability of GPS for measuring distance travelled
in field-based team sports. J Sports Sci.;28(12):1319–
25.
Hill-Haas SV, Coutts AJ, Rowsell GJ, et al., 2008.
Variability of acute physiological responses and
performance profiles of youth soccer players in small-
sided games. J Sci Med Sport;11(5):487–90.
Larsson P. 2003. Global positioning system and sport-
specific testing. Sports Med.;33(15):1093–101.
Mohr M, Krustrup P, Bangsbo J. 2003. Match
performance of high-standard soccer players with
special reference to development of fatigue. J Sports
Sci.;21(7):519-28.
Osgnach C, Poser S, Bernardini R, et al,. 2010. Energy
cost and metabolic power in elite soccer: a new match
analysis approach. Med Sci Sports Exerc.;42(1):170-8.
doi: 10.1249/MSS.0b013e3181ae5cfd.
Randers M, Mujikab I, Hewitt A, et al. 2010. Application
of four different soccer match analysis systems: a
comparative study. J Sports Sci.;28(2):171–82.
KinematicAnalysisinOfficialSoccerMatches:PreliminaryResults-GPSAnalysisinSoccerMatches
209
