
Multiclass Multiserver Service Differentiation in Optical Flow
Switched Networks
Ujjwal Arora
1
, Ejaz Aslam Lodhi
2
and Akash Tayal
2
1
Electronics and Communication Department,
USIT, GGSIPU, New Delhi, India
2
Electronics and Communication Department, IGDTUW, New Delhi, India
Key Words: Multiclass, Multiserver, M/G/W
u
, Non-Preemptive, Optical Flow Switching (OFS).
Abstract: In this paper we wish to analyze the scheduling policy of Optical Flow Switching (OFS) network w.r.t the
multiclass priority queue. OFS is an exciting new switching technique which can transfer Terabytes of data
in a fraction of seconds, The exquisiteness of OFS is that no buffering and processing is involved at any
intermediate routes. Using priority queuing, the flow w.r.t multiclass for multiserver QoS is implemented.
We develop the Multiclass priority model with non-pre-emptive model (with no forced termination) to
evaluate the performance of the Multiclass Multiserver supported OFS network using the multiclass priority
queue. This work presents an entirely new dimension to the Queuing at Access Nodes. Extensive results
obtained show the significant change in total and average waiting time as the number of servers is increased.
On the other hand, as the priority of the class decreases, the average waiting time also increases.
1 INTRODUCTION
Nowadays processing cost at network nodes plays a
major role in determining the Network cost. Optical
networking technology has the potential for
exponential rise in data rates (~3 times the current
magnitude) in the coming decade. This calls for
network architecture to harness its current potential.
The OFS concept was conceived in 1989 at the
inception of the All-Optical-Network [(AON)
Consortium] (Chan,2012). These networks must not
only be capable of supporting different kinds of
operations for different kinds of user requirements,
but also be able to do it economically. This paper
evaluates the effects of the multiclass operations.
Current networks using DWDM systems have bit
rates up to 10 Gb/s for a single channel to network
primary switching centers, and the industry is on the
verge of deploying 40-Gb/s systems, with a potential
to increase up to 160 Gb/s (Mahony,2006).The
above premise is supported by the factors such as the
cost, need to support advanced functions for future
networks, reduction in the port count for increased
bit rates for all optical networks (Mahony,2006).
The above table presents the bit rates required for
the future optical networks. Flow Switching
Architecture is a perfect candidate for high data rate,
Table 1: Residential Bandwidth Requirements
(Mahony,2006).
Application Downstream
Requirement
Upstream
Requirement
HDTV 60 Mbit/s <1Mbit/s
Online Gaming 2-20 Mbit/s 2-20 Mbit/s
VoIP Telephone 0.3Mbit/s 0.3 Mbit/s
Data/E-Mail 10 Mbit/s 10 Mbit/s
DVD Download 14 Mbit/s <1 Mbit/s
Total ~100 Mbit/s ~30 Mbit/s
bursty transactions. Optimum configuration has to
be established between the three network parameters
(blocking probability, delay and wavelength
utilization) for enhanced performance. Statistical
Multiplexing of different flows in a scheduled
fashion from different users has to be achieved for
efficient utilization of the network. Thus, high
network utilization can be achieved if the users are
willing to wait for service according to a schedule.
Schedule (incurring delay) or accept high blocking
probability upon request for service (Chan, 2010).
Variety of scheduling algorithms have been analyzed
for application in the OFS networks, FCFS
(Weichenberg, 2009). Priority applications using
two classes (Khayata, 2012) and Entropy based
Scheduling (Zhang, 2010).
25
Arora U., Lodhi E. and Tayal A..
Multiclass Multiserver Service Differentiation in Optical Flow Switched Networks.
DOI: 10.5220/0004988200250030
In Proceedings of the 5th International Conference on Optical Communication Systems (OPTICS-2014), pages 25-30
ISBN: 978-989-758-044-4
Copyright
c
2014 SCITEPRESS (Science and Technology Publications, Lda.)

2 ARCHITECTURAL OVERVIEW
OF OPTICAL FLOW
SWITCHING
OFS is an end to end transport service from source
to destination, in which user connects through an all
optical path via the access networks available to
him, unlike the OPS and the OBS, the buffering of
data takes place at the source and the destination
OXC’s, the user is allotted bandwidth via a
scheduling algorithm which may be FCFS or
Priority. OFS is envisioned as an all optical data
plane which is supplemented by an electrical control
plane (responsible for routing).The transaction
between the source and the destination may take
place in Terabits and the connection is established
and held for hundreds of milliseconds.
OFS is proposed as a large transaction operation
in which the routing takes place via an all-electronic
plane and data transmission takes place via the all
optical plane. This form of switching can be easily
implemented on the existing fiber architectures
Optical Packet Switching and Optical Burst
Switching and also serves to lower the access cost to
all the users for the large transaction operations. The
lower traffic transactions can be served by
Generalized Multiprotocol Label Switching
(GMPLS) or the Electronic Packet Switching (EPS)
switching technique because using the OFS
operation for such small bandwidth transactions is
not economically viable. The access to the resources
(bandwidth) is subjected to an end to end scheduling
algorithm. The buffering of the data takes place at
the source and the destination OXC’s, thus rendering
unnecessary the need for any buffering at the
network core, and also allowing for the data to be
routed as an indivisible entity in a single flow, hence
the name.
2.1 OFS Topology
Figure 1: OFS topology ( Khayata , 2012).
The network consists of N
1
Metropolitan Area
Networks (MAN) connected by a single Wide Area
Network (WAN). An OFS MAN node comprises an
Optical Cross Connect (OXC) with direct
connections to adjacent MAN nodes as well as one
or more access networks based on Distributed Node
(DN) architectures. We let “N
d
” denote the total
number of such DNs per MAN. The bidirectional
links forming these connections are actually
implemented with two fiber links, carrying a signal
in opposite directions.
It may be the case that the mesh topologies
underlying such MANs may be random, we can
assume that they are based on Moore Graphs
(Weichenberg, 2009) (such Graphs are chosen
because of their cost effectiveness) inter-MAN OFS
traffic could coexist on the same fiber in the
embedded tree. Assuming that there exist a total of
W
a
wavelengths available for a fiber Q
1
to transmit
data and W
u
represent the wavelengths available
between Q
1
and any fiber Q
2
of the other N
1
-1
MANs (Weichenberg, 2009), W
u
is a subset of W
a
.
2.2 OFS Communication
Figure 2: OFS MAN (Weichenberg,2009).
The end to end sequential reservation takes place in
two steps, (i) Reservation of resources between
source WAN and destination WAN. (ii) Reservation
between the Distribution node and the scheduling
node at the source and destination, respectively.
Consider a source S present in MAN M
1
which tries
to perform an end to end transaction with the
destination D in MAN M
2
.A Flow is generated at the
source DN D
1
in MAN M
1
to the destination DN in
MAN M
2
(This is explained in detail in the next
section).We will consider the case of two fibers in
the numerical analysis because of the simpler
calculations; however, these calculations can be
easily scaled to consider 2f fibers as well.
OPTICS2014-InternationalConferenceonOpticalCommunicationSystems
26

At a MAN’s scheduling node, there exist N
1
−1
first-work resources (Weichenberg, 2009).
W
u
=
∗
(1)
3 SCHEDULING ALGORITHM
Consider a flow that is generated at an end user (S)
residing in DN D
1
within MAN M
1
and that is
destined for an end user (D) residing in DN D
2
within MAN M
2
. As soon as this flow is ready for
transmission, the source end user sends a primary
request r
1
to the scheduling node associated with M
1
,
requesting an end-to-end all- optical path for its flow
transmission.
At a MAN’s scheduling node, there exist N
1
−1
FIFO queues, one queue corresponding to every
possible MAN destination. Each queue can be
thought of as the queue for an M/G/W
u
queuing
system, in that the W
u
wavelength channels
dedicated to transmission from M
1
to M
2
eventually
serve the primary requests waiting in it. After the
primary request arrives at the head of the queue, the
secondary request is sent for the reservation of
wavelength between the DN DN
1
and the S as well
as the DN
2
and D, by their respective Scheduling
Nodes. When the request is served, wavelength is
allotted to the user and transmission can take place.
3.1 The Model
We have considered a multi-class, multi-server
problem with more than two classes, to provide the
service differentiation. This model is a non pre-
emptive model in which K customer classes and N
parallel servers are considered (The numbers of
servers represent the available wavelengths W
u
). We
will use the notation i to depict the customer classes
and j to depict the number of servers where
i=1,2,3,4,…K and j=1,2,3,4,….N. The customers of
class i arrives at the server j with a rate λ
,where
total rate of arrival λ=
∑
λ
,
and the normalized
traffic being λ
= λ/w
u
.
Each customer is routed to a server j independent
of the others with a probability [p
,
]
1<i<K,1<j<N
. The
rate of customer arrivals to server j is therefore given
by λ
,
∑
λ
*
p
,
. The service time of a class i
customer when executed on server j has a general
distribution F
(i,j)
(.).We assume the servers are
identical in every respect and the speed of a server is
denoted by ‘s’. We analyze only the base time server
distribution’s first and the second moment which are
represented by ‘
’ and ‘
’. Therefore first and
second moments of service time distribution of class
i on server j are
,
and
,
. Let ρ
=λ
*
be the
traffic intensity of class i (Sethuraman,1999).
Figure 3: Multiclass Queueing with single server
(Plambeck,2001).
3.2 Sequencing
If the cost associated with a particular server j is C
j
and T
i
denotes the effective response time of class i
customers then in a K- class non pre-emptive M/G/1
queue priority is given to the class i customers over
class j customers if c
i
/x
i
>c
j
/x
j
minimizes
∑
c
i
*
*T
i.
(Sethuraman,1999).
Assuming
,
and
refer to the First, Second
and Third moments of the flow transmission time L
respectively, ’f’ refers to the number of fibers and N
d
refers to the number of DNs per MAN
(Weichenberg, 2009).The first and second moment
of the service time distribution are defined by:
≈ +
∗
∗
∗
∗
(2)
≈
∗
∗
∗
+2
∗
∗
∗
∗
+
∗
∗
∗
∗
(3)
3.2.1 Single Server Operation
In our model, the average waiting time for a class k
is denoted by
W
k
=
∑
∗
∑
∑
(4)
And the total waiting time is denoted by
T
k
= W
k
+
k
(5)
Where
k
denotes the first moment of the service
time distribution of class k.
MulticlassMultiserverServiceDifferentiationinOpticalFlowSwitchedNetworks
27

3.2.2 Multiserver Operation
Average waiting time for class i on a server j (W
i,j
)is
given by:
W
i,j
=
∑
*
,
*
*‐
∑
,:
*‐
∑
,:
(6)
Where ρ
,
= λ
,
∗p
,
*
,
And the average waiting time (W
i
) for class i
operation is,
W
i
=
∑
p
,
* W
(i,j)
(7)
And total time (T
i
) for multi-server applications is
given by
T
i
=
∑
,
∗p
,
+W
i
(8)
The above results have been obtained directly from
(Sethuraman,1999).
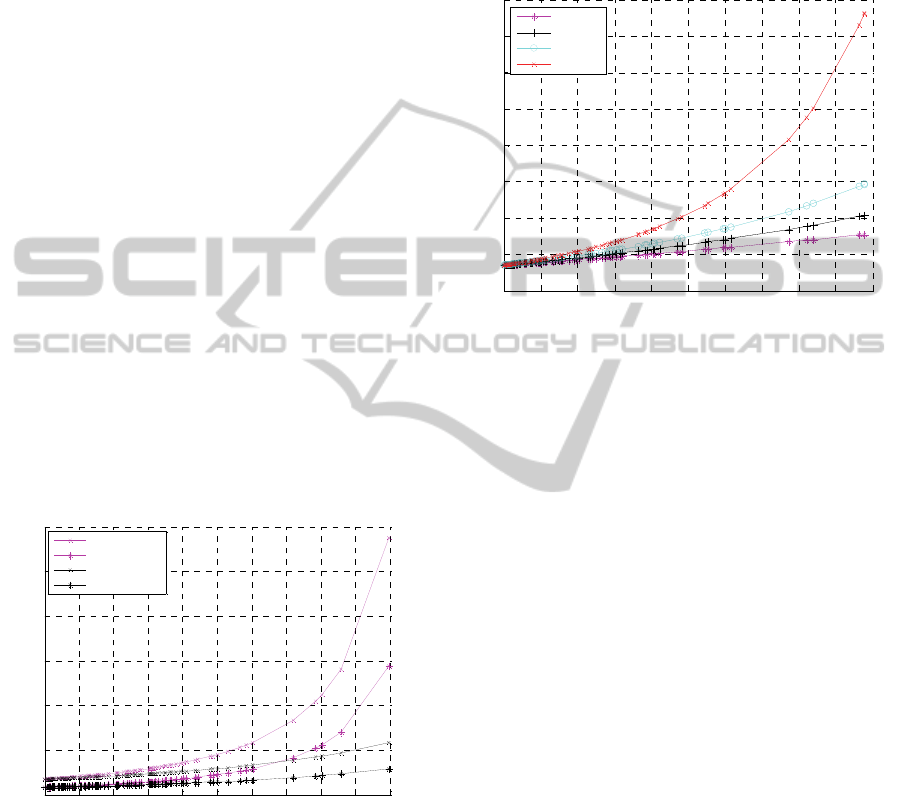
4 ANALYTICAL RESULTS
We have considered a 10-class operation with L=1
sec. Class-1 is the most delay constrained and the
class-10 is the best effort class. The plots for average
and total waiting time are as shown in the Figure 4
and Figure 5.We observe that for constant input
parameters the peak waiting time for the Figure 5
drops by ~50% between 2-server to 3-server, where
each point signifies an individual class for that
particular server.
Figure 4: Average Waiting Time (sec) versus Traffic
Intensity (rho) for 2, 3, 4, 5 servers with exponential flow.
We observe that for constant input parameters the
peak waiting time for the Figure 5 drops by ~50%
between 2-server to 3-server, where each point
signifies an individual class for that particular server.
Figure 5: Total Waiting Time (sec) versus Traffic Intensity
(rho) for 2, 3, 4, 5 servers with exponential flow.
It also shows a peak drop of ~63% between plots for
2- server and 5-server operations. For average
waiting time, we observe that Peak drop is between
2-server and 5-server operation (~88%) and the least
drop is between 4-server and 5-server operation
(~27%) and the peak inter-server drop is between 2-
server and 3-server operation (~69%). We observe
that the difference between the peak waiting time for
the least priority operation for subsequent classes
decreases as the number of server increases. It can
be concluded that the waiting times of all the classes
of a particular server operation become constant, as
the number of servers increases and approaches the
number of classes under consideration.
Figure 6: Average Waiting Time (sec) versus Traffic Intensity
(rho) for 4, 6, 9 class operation with exponential flow.
0.1 0.2 0.3 0.4 0.5 0.6 0.7 0.8 0.9 1
0
0.005
0.01
0.015
0.02
0.025
0.03
0.035
0.04
0.045
Rho
Average Waiting Time
2 Server
3 Server
4 Server
5 Server
0.1 0.2 0.3 0.4 0.5 0.6 0.7 0.8 0.9 1
0.015
0.02
0.025
0.03
0.035
0.04
0.045
0.05
0.055
0.06
0.065
Rho
Total Waiting Time
2 Server
3 Server
4 Server
5 Server
0 0.1 0.2 0.3 0.4 0.5 0.6 0.7 0.8 0.9 1
0
0.01
0.02
0.03
0.04
0.05
0.06
0.07
0.08
0.09
0.1
rho
Average Waiting Time
Class 4 operation(exponential flow)
Class 6 operation(exp flow)
Class 9 operation(exp flow)
OPTICS2014-InternationalConferenceonOpticalCommunicationSystems
28
In Figure 6., we have considered the operation
for a fixed number of server and plotted the average
waiting time for exponential flow, we observe that
as the priority decreases, the waiting time increases
and the peak waiting time also increases at a much
faster rate. We have considered the 4-class,6-class,9-
class operation. We observe that the peak waiting
time drops ~70% between 9-class and 6-class and
~83% between 9-class and 4-class operation.
Through this data, we can theorize that as the
priority of the class increases, the waiting times
becomes constant for lower and higher traffic input;
hence the effect of increase of the traffic is highest
on the lowest of priority inputs and lowest on
highest of priority inputs. Thus, for the constant
traffic input, the increase of the volume of traffic has
a cascading effect on the lower priority classes, the
waiting time increase is the severest in the lowest of
priority classes, and thus the network has an upper
limit on the number of operations that can be
sustained economically. We also observe that when
the utilization of the server is the highest and the
traffic of the system approaches the peak value (~1
Erlang) the lowest of priority operations may have
such high waiting time that it may become un-
economical for the user. We must either reduce the
number of operations that can be supported or
increase the number of wavelengths that are allotted
to the MAN network.
Figure 7: Average Waiting Time (sec) versus Traffic
Intensity (rho) for 5 class for 2 and 4 server and 8 class for
2 and 4 server operation with exponential flow.
For Figure 7, we have considered the particular class
of operation, viz class 8 and class 5, for 2-server and
4-server operation. We observe that the drop in the
peak waiting time, observed across higher traffic is
approximately 49% when the number of servers is
increased, in class-8 case, whereas the effect over
the lower class (class-5) is (~50-60%). We also
observe that for lower amount of traffic (0-65%) of
peak traffic, class-8, 4-server operation performs
better than the class-5, 2-server operation. The above
operation highlight the importance of increasing the
number of servers, although their effect may vary as
the priority of the operation is increased.
Figure 8: Average Waiting Time (sec) versus Class 3
Waiting Time for 4, 5, 6, 9 class operation with
exponential flow.
The Figure 8 also proves that only a finite number of
operations can be supported on the network, here the
waiting times of class 4,5,6,9 are plotted against the
class 3 waiting traffic for a fixed number of servers.
The premise of such exercise is to find out the
effects on increase of traffic on lower and higher
traffic as well as their interdependence. We observe
that with the increase of waiting time of a lower
class traffic (class-3 in this case), there is a
cascading effect on the higher classes (for lowest of
priority operations) i.e. their waiting time increases
exponentially on the increase of traffic and thus, for
the least priority of classes, the waiting time may
become so high that the cost becomes unsustainable.
Thus, only a finite amount of classes can be
supported by the OFS network, for a fixed number
of servers.
We have observed in the above conclusion that
the difference in the peak waiting time decreases as
we increase the number of servers, so, we have to
arrive at an optimum parameter which balances the
economic consideration as well as the waiting time
of the server.
0 0.1 0.2 0.3 0.4 0.5 0.6 0.7 0.8 0.9 1
0
0.02
0.04
0.06
0.08
0.1
0.12
Rho
Average Waiting time
8-class,2 server
8-class,4 server
5-class,2 server
5-class,4 server
7 7.5 8 8.5 9 9.5 10 10.5 11 11.5 12
x 10
-3
0
0.01
0.02
0.03
0.04
0.05
0.06
0.07
0.08
Class 3 Waiting Time
Average Waiting time of other classes
4th Class
5th Class
6th Class
9th Class
MulticlassMultiserverServiceDifferentiationinOpticalFlowSwitchedNetworks
29

5 CONCLUSION
This paper proposes QoS–based Service
Differentiation in OFS Network using priority
queuing. We have considered more than one class
(multiclass) for many server (multiserver) problems
to justify the paramount ability of OFS network
usage to support different kind of operations. We
develop an analytical model to evaluate the
performance of the Multiclass Multiserver supported
OFS network using the multiclass priority queue.
Our proposed mechanism shows the efficacy of the
proposed mechanism in OFS for various kind of
operation. Results obtained clearly show the
efficiency of the QoS based Multiclass Multiserver
problem and its importance in increasing the number
of server and its effect as the priority of the
operation increases, which validates our results as in
(Balter,2005). The result obtained also calls for an
optimum balance to be found between the cost
operation and the efficiency of the network, the
number of operations it can support economically,
we will analyze the optimum configuration in our
future works.
REFERENCES
Chan, V.W.S, 2012,Optical Flow Switching, Vol. 100, No.
5,Proceedings of the IEEE
Mahony, M, Politi, C, Klonidis, D, Nejabati, R &
Simeonidou, D 2006, Future Optical Networks,
Journal of Lightwave Technology, Vol. 24, No. 12, pp.
4684-4696
Chan, Vincent W. S., 2010, Optical Flow switching,
OSA/OFC/NFOEC.
Weichenberg, Guy , Chan,Vincent W.S., Médard,
Muriel,2009, Design and analysis of Optical Flow
Switched Networks, Journal of optical communication
networks.
Khayata, Iyas & Elbiaze, Halima 2012,Service
differentiation in OFS networks: Performance
analysis, IEEE International Conference on
Computing, Networking and Communications, Optical
and Grid Networking Symposium.
Zhang,Lei, Chan,Vincent, 2010,Fast Scheduling in Optical
Flow switched Networks, IEEE Globecom.
Sethuraman, Jay, Squillante, Mark.S, Optimal Stochastic
Scheduling in Multiclass parallel
queues,Sigmetrics’99
Plambeck,Erica,Kumar, Sunil, Harrison, Micheal J. ,2001,
A Multiclass Queue in Heavy Traffic with Throughput
Time Constraints: Asymptotically Optimal Dynamic
Controls, Queuing Systems 39,Pg 23-54.
Balter,M, Osagami,Takayuki,Scheller-Wolf, Alan,
Wierman, Adam, 2005,Multi-server queueing systems
with multiple priority classes,Queueing Systems
51,Pg(331-60),Springer Science.
OPTICS2014-InternationalConferenceonOpticalCommunicationSystems
30
