
A Study on Reliability Assessment for Offshore Wind Farm
Configurations
Je-Seok Shin
1
, Wook-Won Kim
1
, In-Su Bae
2
and Jin-O Kim
1
1
Department of Electrical Engineering, Hanyang University, Seoul, Korea
2
Department of Electrical Engineering, Kangwon University, Samcheok, Korea
Keywords: Reliability Assessment, Offshore Wind Farm, Cost/Reliability Analysis, PNDR (Power Not Delivered
Ratio), EEND (Expected Energy Not Delivered).
Abstract: Due to environment concern, fossil resource exhaustion issue and so forth, an attention on the use of
renewable energy is being increased sustainably and various types of renewable energy are being developed.
In particular, wind power plant is one of the most used resources among them. The recent trend in
development of wind power is the large-scale offshore wind farm. However, the burden of investment for
offshore wind power is still considerable so that comprehensive evaluation must be performed in the
planning stage. For the evaluation, this paper introduces the concept and method to assess offshore wind
farm according to their configurations, in the reliability aspect.
1 INTRODUCTION
Wind energy is one of the most used renewable
energy resources. The related technology has
advanced and a penetration of wind power has being
increased sustainably. Furthermore, an installation
capacity of a wind power plant has being increased.
There are two types of wind power developments
according to the size. One is used as a small scale
distributed generator, and the other is a large-scale
wind farm. In addition, wind power plant can be
developed at onshore or offshore. The recent trend is
the offshore wind farm (OWF) which can gather
more wind energy and avoid several problems that
occur at onshore, such as noise pollution, destruction
of the environment and concerns related with
construction. However, compared with onshore,
OWF has crucial disadvantages which are the more
expensive investment and maintenance costs, and
the fault effects lasted for a longer time due to a
difficulty of geographical access. Therefore, OWF
operator has a considerable burden on investment for
OWF, so OWF operator has to determine a
configuration and design for OWF comprehensively,
in order to achieve the economic feasibility. The
second one of disadvantages is evaluated by a cost
through a reliability assessment, and the reliability
and economic analysis can be performed using the
result of the reliability assessment. For this, the
following indices are redefined in order to represent
the results of reliability assessment. PNDR is the
power not delivered ratio, EEND is the expected
energy not delivered. EENDC is the cost on EEND.
The rest of the paper is organized as follows; In
section 2, basic compositions of OWF are described.
In section 3, a method to evaluate a reliability of
OWF according to wind power configurations is
introduced. In section 4, brief case studies are
performed in order to demonstrate the introduced
method. Finally, section 5 contains a conclusion of
this paper.
2 OFFSHORE WIND FARM
Basic composition of large scale offshore wind farm
is represented in Fig.1, which consists of wind
turbines, inner grid, offshore substations and
external grid.
Figure 1: Basic Composition of OWF.
198
Shin J., Kim W., Bae I. and Kim J..
A Study on Reliability Assessment for Offshore Wind Farm Configurations.
DOI: 10.5220/0004960801980202
In Proceedings of the 3rd International Conference on Smart Grids and Green IT Systems (SMARTGREENS-2014), pages 198-202
ISBN: 978-989-758-025-3
Copyright
c
2014 SCITEPRESS (Science and Technology Publications, Lda.)

An electrical energy produced at wind turbines is
aggregated thorough inner grid. And then, a voltage
of the energy is made higher in order to transfer
efficiently toward onshore at transformers in
offshore substation. Finally, the energy is delivered
toward onshore through external grid.
At the planning stage for OWF, the locations of
wind turbines and offshore substations are
preferentially decided considering a geographical
condition, in order to gather more wind energy. And
then, the design and configuration for inner grid,
offshore substation and external grid are decided.
There are diverse alternatives based on how to
connect wind turbines and how to configure
substation and external grid. Each alternative of
OWF has had different performance on any failure
in the OWF and it is indicated as the difference in
results of reliability evaluation. When the planning
for OWF is performed, considerations for each
component are as follows.
In case of designing inner grid, there are the
following considerations;
- the voltage of inner grid
- transfer capacity of cables
- the number of feeders(wind turbines per feeder)
- the layout for inner grid: the radial, star and ring
types;
Figure 2: Layout of radial structure.
Figure 3: Layout of star structure.
Figure 4: Layout of ring structure.
In case of offshore substation, the following
factors are considered.
- the number of transformers
- a capacity of each transformer
In case of external grid, the factors to be considered
are same with case of offshore substation.
- the number of transmission lines
- the capacity of each transmission lines
3 RELIABILITY ASSESSMENT
ON OFFSHORE WIND FARM
In this paper, a quantitative reliability assessment is
performed in viewpoint of OWF operator. Therefore,
the goal of reliability assessment is to quantitate how
much an expected energy is delivered to onshore
from wind turbines considering interruptions in
OWF. For this, the following indices are redefined.
PNDR is defined as the ratio of a power not
delivered by any failure to a power in non-failure
state. EEND means the expected value of energy
which is not delivered, reflecting all failure states
defined at each component. At this time, the failures
that may occur at any component, affect to the next
component consecutively, so that failure states at
any component should contain the failure states
defined at the previous component. This fact is
represented in Fig. 5.
Figure 5: Failure States at each component.
3.1 PNDR at Wind Turbine
Although wind turbines are not related directly to
the ability to transfer energy toward onshore, faulted
wind turbines affect the transfer ability at next
component. Therefore, ratio of energy not produced
at wind turbine due to failure of wind turbines can
be evaluated like PNDR at wind turbine. PNDR at
wind turbine can be calculated as ratio of the number
of faulted wind turbines to the total wind turbines.
AStudyonReliabilityAssessmentforOffshoreWindFarmConfigurations
199

3.2 PNDR at Inner Grid
PNDR at inner grid is influenced by sum of the
number of faulted wind turbines and disconnected
wind turbines according to locations where cable
faults occur. Because of cable failure with a very
low probability, two or more cable failures are
ignored in this paper.
There are two different approaches to calculate
PNDR at inner grid based on the layouts. In case of
a layout of radial structure, PNDR is calculated by
ratio of the net disconnected wind turbines to the
total wind turbines, the net disconnected wind
turbines mean the union set consisting of the faulted
wind turbines and the disconnected ones. However,
in case of a layout of ring structure which has the
redundant cables, a more complex approach is
applied. When a failure occurs at one among feeders
composing a ring structure, power disconnected by
the cable failure would detour through the other
feeders in the ring structure. All the remained wind
turbines in the ring structure, except for wind
turbines connected normally toward offshore
substation in the faulted feeder may be limited
according to wind speed. If power to be delivered
through non-faulted feeders is higher than their total
rated capacity, the rated power of the wind turbines
is restricted as shown in Fig. 6.
Figure 6: Normal/Restricted Output Characteristic of WT.
Therefore, in case of layout of ring structure,
relationship between power delivered through non-
faulted feeders and their total rated power is
considered as well as the net number of
disconnected wind turbines. Equation related to the
limited rated power of wind turbine is represented
by Eq (1).
,
_
__
()
if)
.()
()
() ()
if)
.() .()
IG
IG IG
OS EG
rr
WT WT
rNew OS EG
OS EG OS EG
r
WT WT WT WT
ACap
N
ACap ACap
NN
f
PP
nn f
Pf
ff
P
nn f nn f
(1)
where,
OS EG
f
means failure state at offshore
substation and external grid and contains failure
factors at formal components,
_
()
OS EG
ACapf
is total
capacity of non-faulted feeders in a ring structure,
r
P
is the rated power of wind turbine,
WT
N
is the
number of wind turbines and
.
WT
nn
is the number of
the net disconnected wind turbines.
3.3 PNDR at Offshore Substation and
External Grid
Failure factors considered at two components affect
to PNDR of each component equally. Therefore,
Failure factors at two components are handled
together. Containing formal failure factors, failure
states can be defined by combination of faulted
transformers and external lines. If failures occur at
transformers and/or external lines, all wind turbines
may reduce their rated power only when power to be
delivered toward onshore from inner grid is higher
than the available capacity of offshore substation
and external grid. This process for determining the
limited rated power is same with case at inner grid
composed by ring structure.
After obtaining all PNDR under predefined
failure state at all components, an expected value of
PNDR is calculated by multiplying each PNDR and
the corresponding probability of failure state. And
then, an expected PNDR is used in order to evaluate
EEND. EEND is obtained by multiplying EPNDR
and an expected energy produced by the entire OWF
in non-failure state. This process is shown in Eq (2).
()Pr()
OS EG
OS EG OS EG
f
OWF
PNDR f f
EEND EE EPNDR
EENDC EEND asp
EPNDR
(2)
where,
Pr( )
OS EG
f
is probability of that the failure state,
OS EG
f
occurs.
OWF
EE
means an expected annual
energy of OWF in non-failure state and
asp
is an
average settlement price of electrical energy
generated by wind turbine.
4 CASE STUDY
In the section, brief case studies are performed in
order to demonstrate the proposed method. OWF is
composed by 28 identical 5MW-wind turbines.
Wind speed model is applied identically by
historical data model obtained at the southwest coast
in Korea. The expected annual energy of the entire
OWF is 367,159.6MWh considering no failures.
Basic alternatives based on layouts of inner grid
are represented by Fig. 7-9.
SMARTGREENS2014-3rdInternationalConferenceonSmartGridsandGreenITSystems
200
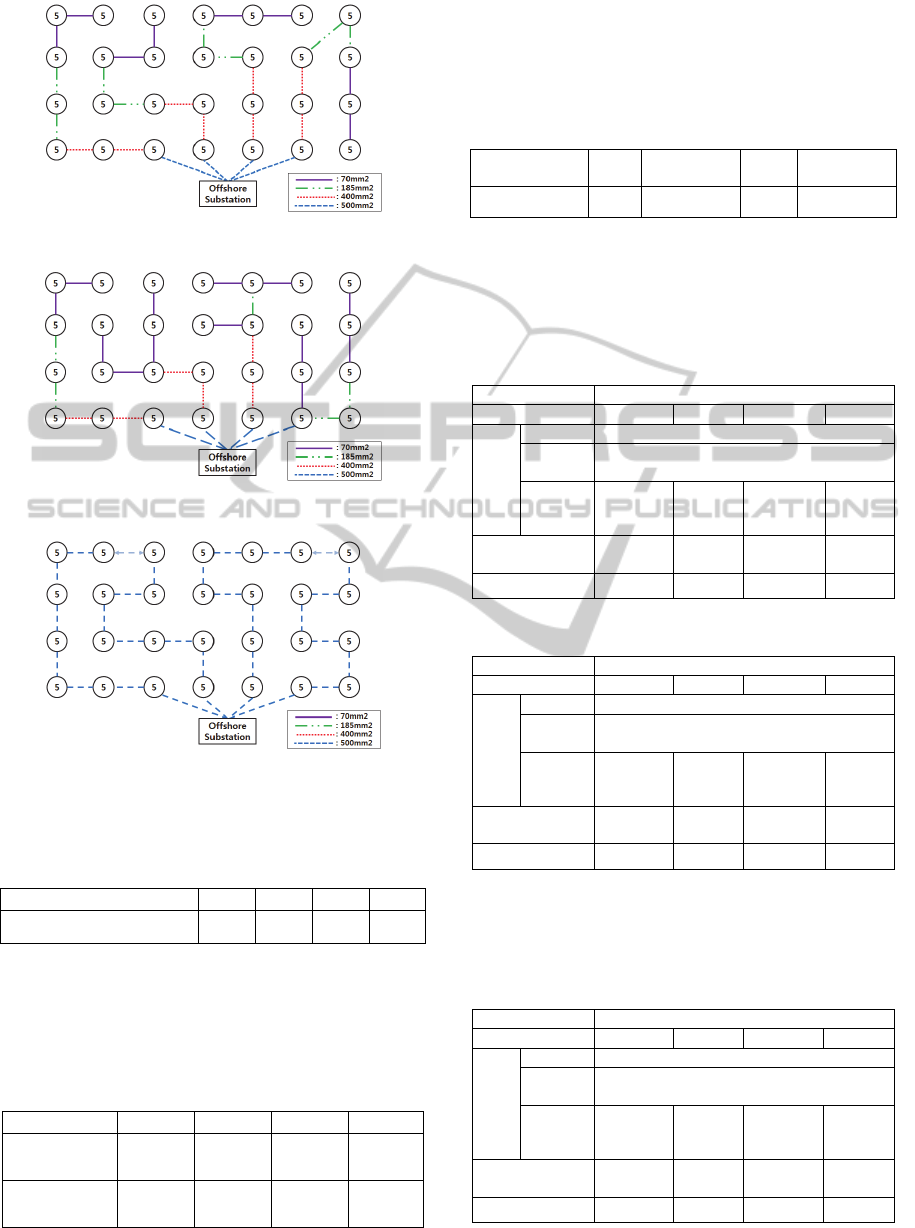
Figure 7: Basic Case 1.
Figure 8: Base Case2.
Figure 9: Base Case3.
Cable data in inner grid are represented in Table 1.
Table 1: Data for Cable in Inner Grid.
Cable type[mm2] 70 185 400 500
Available Capacity [MW] 13.0 21.5 31.5 35.5
Individual basic cases are also separated into the
four sub-cases according to the number and capacity
of transformers and external grid cables, as shown in
Table 2.
Table 2: Data for sub cases.
No. Sub Case -1 -2 -3 -4
Transformer
150MW
x1
75MW
x2
150MW
x1
75MW
x2
External
Grid Cable
150MW
x1
150MW
x1
75MW
x2
75MW
x2
For the simplicity, it is assumed that reliability
data for each component (Inner/External Cable,
Transformer) is identical. The reliability data for
individual components are shown in Table 3.
Table 3.
Components WT Inner Cable Trans.
External
Cable
Unavailability 0.016 0.00025 0.016 0.0025
The results for all cases are represented as the
following Table 4-6, where 0.2$/kWh is applied as
average settlement price of wind energy in order to
calculate EENDC.
Table 4: Result of Case 1.
Case 1
No.Sub- -1 -2 -3 -4
E
P
N
D
R
[%]
WT 1.60
Inner
Grid
1.70
OWF
3.51 2.17 3.30 1.95
EEND_OWF
[MWh]
12,887.3 7,967.4 12,116.3 7,159.6
EENDC [
6
10
$]
2.58 1.59 2.42 1.43
Table 5: Result of Case 2.
Case 2
No.Sub- -1 -2 -3 -4
E
P
N
D
R
[%]
WT 1.60
Inner
Grid
1.68
OWF
3.50 2.15 3.29 1.94
EEND_OWF
[MWh]
12,850.6 7,893.9 12,079.6 7,122.9
EENDC [
6
10
$]
2.57 1.58 2.41 1.42
Compared with Case 1, Case 2 has less value of
EPNDR and EENDC, respectively, due to a modified
radial structure.
Table 6: Result of Case 3.
Case 3
No.Sub- -1 -2 -3 -4
E
P
N
D
R
[%]
WT 1.60
Inner
Grid
1.60
OWF
3.41 2.06 3.20 1.85
EEND_OWF
[MWh]
12,520.1 7,563.5 11,749.1 6,792.5
EENDC [
6
10
$]
2.50 1.51 2.35 1.36
AStudyonReliabilityAssessmentforOffshoreWindFarmConfigurations
201

As shown in Table4-6, Case3-4 which has a
layout of ring structure for inner grid and two
transformers and external cables is the best
alternative in terms of reliability aspect. On the other
hand, Case 1-1 with a layout of typical radial
structure and one transformer and external cable is
the worst alternative. However, in particular, there is
more investment cost for constructing inner grid
which has ring structure. Therefore, the best
alternative for offshore wind farm has to be
determined considering not only reliability
assessment, but also economic assessment.
5 CONCLUSIONS
In this paper, a method to perform the reliability
analysis for offshore wind farm has been introduced.
Basic components of offshore wind farm are divided
into four components which are wind turbines, inner
grid, offshore substation and external grid.
According to a design or configuration for each
component, there are diverse alternatives for
offshore wind farm. The proposed method can
evaluate reliability at each component level step by
step, and then the results can be used for reliability
and economic assessment to determine the best
alternative for offshore wind farm.
As for future work, it is expected to study on
how to design optimally inner grid using the
suggested method in offshore wind farm.
ACKNOWLEDGEMENTS
This work was supported by the National Research
Foundation of Korea (NRF) grant funded by the
Korea government (MEST) (No. 2011-0017064).
REFERENCES
Roy Billinton, Ronald N. Allan.: Reliability Evaluation of
Engineering Systems, 2nd ed. New York; Plenum
Press,c, 1996.
Roy Billinton, Ronald N. Allan.: Reliability Evaluation of
Power Systems, 2nd ed. New York; Plenum Press,c,
1996.
T. Ackermann.: Wind Power in Power Systems, 1st ed.
New York: Wiley, 2005.
Leon Freris, David Infield.: Renewable Energy in Power
System, 1st ed. New York: Wiley, 2008.
Lundberg, S.: Evaluation of wind farm layouts, Epe
journal, vol. 16, 2006.
Predrag Djapic, Goran Strbac.: Cost Benefit Methodology
for optimal Design of offshore Transmission system,
Centre for Sustainable Electricity and Distributed
Generation, 2008.
Je Seok Shin, Seung Tae Cah, Qiuwei Wu, Jin-o Kim,
"Reliability Evaluation Considering Structures of a
Large Scale Wind Farm”, Proceedings of the EPE
Joint Wind Energy and T&D Chapters Seminar, june,
2012.
Je-Seok Shin, Wook-Won Kim, In-Su Bae and Jin-O Kim,
“Reliability Evaluation on Offshore Wind Farm”,
Conference on International Conference on Power &
Energy Systems, 2013, Kathmandu, Nepal.
SMARTGREENS2014-3rdInternationalConferenceonSmartGridsandGreenITSystems
202
