
Tear Film Maps based on the Lipid Interference Patterns
Beatriz Remeseiro
1
, Antonio Mosquera
2
, Manuel G. Penedo
1
and Carlos Garc´ıa-Res´ua
3
1
Department of Computer Science, University of A Coru˜na, Campus de Elvi˜na s/n, 15071 A Coru˜na, Spain
2
Department of Electronics and Computer Science, University of Santiago de Compostela,
Campus Universitario Sur, 15782 Santiago de Compostela, Spain
3
Faculty of Optics and Optometry, University of Santiago de Compostela,
Campus Universitario Sur, 15782 Santiago de Compostela, Spain
Keywords:
Tear Film, Interference Patterns, Color Texture Analysis, Image Segmentation, Machine Learning.
Abstract:
Dry eye syndrome is characterized by symptoms of discomfort, ocular surface damage, reduced tear film sta-
bility, and tear hyperosmolarity. These features can be identified by several types of diagnostic tests, although
there may not be a direct correlation between the severity of symptoms and the degree of damage. One of
the most used clinical tests is the analysis of the lipid interference patterns, which can be observed on the tear
film, and their classification into the Guillon categories. Our previous researches have demonstrated that the
interference patterns can be characterized as color texture patterns. Thus, the manual test done by experts can
be performed through an automatic process which saves time for experts and provides unbiased results. Nev-
ertheless, the heterogeneity of the tear film makes the classification of a patient’s image into a single category
impossible. For this reason, this paper presents a methodology to create tear film maps based on the lipid
interference patterns. In this way, the output image represents the distribution and prevalence of the Guillon
categories on the tear film. The adequacy of the proposed methodology was demonstrated since it achieves
reliable results in comparison with the annotations done by experts.
1 INTRODUCTION
Dry eye is a multifactorial disease of the tears and
ocular surface. It is a common complaint among
middle-aged and older adults, and affects a wide
range of population (DEWS, 2007): between 10%
and 20% of the population, although in Asian pop-
ulations this percentage may be raised up to 33%.
This disease worsens with age and so its prevalence
may increase in the future (Brewitt and Sistani, 2001).
Moreover, it can be a cause of great discomfort and
frustration, and symptoms may be modulated by envi-
ronmental factors such as air conditioning and work-
ing at video display terminals. Sufferers will re-
quire treatment with a significant potential cost, thus
an early diagnosis and the monitoring of the disease
are significantly important factors to ensure patients’
quality of life (Bron, 2001).
Diagnosis of dry eye is a difficult task due to its
multifactorial etiology, the need for a comprehensive
definition, and the use of tests that are limited and
variable in their assessment of the tears and ocular
surface. Thus, there is no uniform concept for di-
agnosis or treatment. However, the evaluation of the
lipid interference patterns of the tear film lipid layer
facilitates the diagnosis of the cause of dry eye symp-
toms. In this sense, Guillon invented the Tearscope
plus as an instrument for rapid assessment of lipid
layer thickness (Guillon, 1998), which was classified
from open meshwork (very thin) to color fringe (very
thick). This grading scale is composed of five cate-
gories, with two discriminant features: color and in-
terference patterns. The classification into these five
grades is a difficult clinical task, especially with thin-
ner lipid layers which lack color and/or morphologi-
cal features. The subjective interpretation of the ex-
perts via visual inspection may affect the classifica-
tion, and so a high degree of inter- and also intra-
observer variability can be produced (Garc´ıa-Res´ua
et al., 2013).
The development of a systematic and objective
computerized method for analysis and classification
is highly desirable, allowing for homogeneous di-
agnosis and relieving experts from this tedious and
time-consuming task. As a consequence, previous re-
searches (Remeseiro et al., 2011; Remeseiro et al.,
2013a) have demonstrated that the interference phe-
nomena can be characterized as a color texture pat-
732
Remeseiro B., Mosquera A., G. Penedo M. and García-Resúa C..
Tear Film Maps based on the Lipid Interference Patterns.
DOI: 10.5220/0004926307320739
In Proceedings of the 6th International Conference on Agents and Artificial Intelligence (ICAART-2014), pages 732-739
ISBN: 978-989-758-015-4
Copyright
c
2014 SCITEPRESS (Science and Technology Publications, Lda.)
tern. Thus, the classification task can be automatized
with a classification accuracy over 95% using the co-
occurrence features method for texture extraction and
the Lab color space.
On the other hand, the spatial heterogeneity of the
tear film lipid layer makes the classification of a pa-
tient’s image into a single category, as previous ap-
proaches do, not always possible. In fact, performing
local analysis of the images in order to detect mul-
tiple categories per patient would be more accurate.
Furthermore, this kind of analysis would be useful to
discern different local states, and so different tear film
distribution maps. Accordingly, a first attempt to seg-
ment tear film images into the Guillon categories was
proposed in (Remeseiro et al., 2013b). This prelimi-
nary approach includes the application of previously
proposed techniques for color texture analysis and a
decision voting system for the final result. Up to the
knowledge of the authors, there are no more attempts
in the literature to automatically segment lipid inter-
ference patterns on tear film images acquired with the
Tearscope plus.
The main problem with the approach proposed in
(Remeseiro et al., 2013b) is that it uses the so-called
background category,in addition to the five categories
defined by Guillon. This category represents the ar-
eas of an image where there is no interference pat-
tern. Since the samples of this unreal category have
a high level of variability, they cannot be defined by
uniform texture color features and so the accuracy of
a classifier may be affected. Furthermore, it uses the
class predicted by the machine learning algorithm to
segment the images, regardless of the probability of
the prediction. Thus, the proposed methodology will
provide segmented images by means of a weighted
voting system which takes into account the multiclass
probability, and a minimum threshold to distinguish
the background from the Guillon patterns without in-
cluding any unreal category.
The outline of the paper is as follows: Section
2 describes a methodology to create tear film maps
based on the lipid interference patterns, Section 3
presents the materials and methods employed in this
paper, Section 4 shows the experimental results, and
Section 5 includes the conclusions and future lines of
research.
2 RESEARCH METHODOLOGY
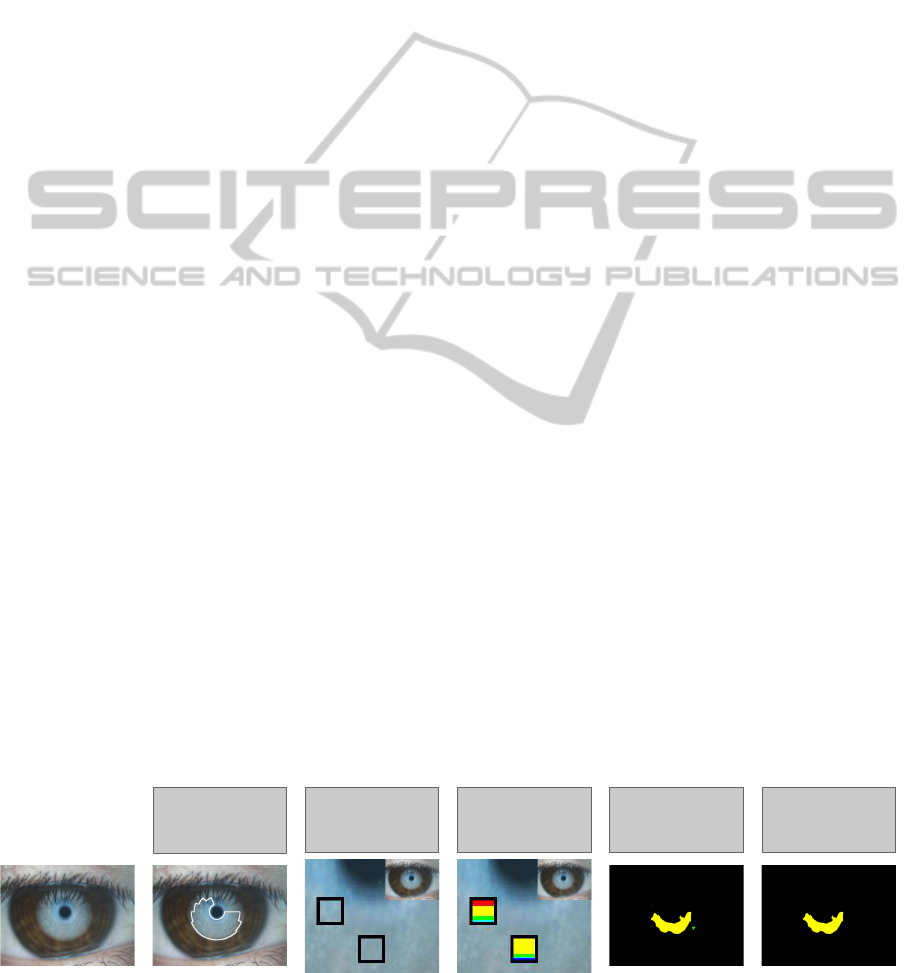
The research methodology to create tear film maps
based on the lipid interference patterns consists of five
stages (see Figure 1). The input data is a tear film im-
age acquired with the Tearscope plus, and the output
data is a labeled image based on the interference pat-
terns defined by Guillon. First, the region of interest
(ROI), in which the analysis will take place, is de-
tected. Next, using a specified window size, each win-
dow located at the ROI of the input image is analyzed
in terms of color and texture features, and its class-
membership probabilities are calculated by soft clas-
sification. After that, the segmentation is performed
with the weighted voting system and a tear film map
is obtained, represented as a labeled image. And fi-
nally, the tear film map is post-processed in order to
eliminate the small regions. The whole process de-
scribed in this section can be seen in Algorithm 1. In
what follows, each stage will be explained in depth.
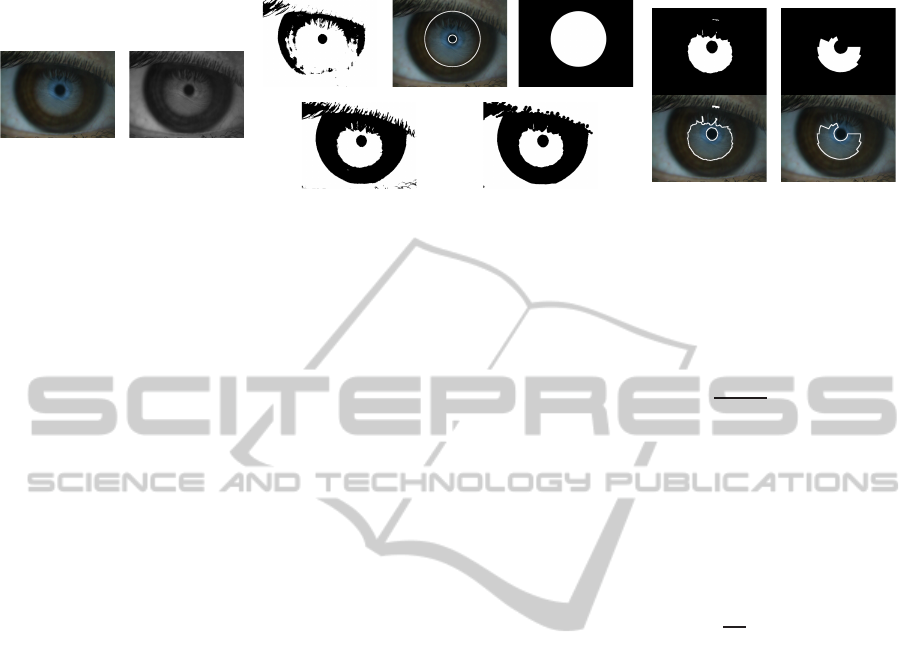
2.1 Location of the Region of Interest
Input images acquired with the Tearscope plus in-
clude irrelevant areas for tear film segmentation, such
as the sclera or the eyelids. Previous works (Reme-
seiro et al., 2011; Remeseiro et al., 2013a) located the
region of interest (ROI) as a rectangle in the bottom
part of the iris. A set or ring-shaped templates that de-
fine different ROI shapes and the template matching
technique were used. Nonetheless, in this research the
analysis is taken over the whole tear film and so a new
process to locate the ROI is presented.
The tear film can be perceived with the best con-
trast in the green channel of the input image in RGB,
so only this single channel will be considered in this
stage. First, the green channel is thresholded using
its histogram. Then, the normalized cross-correlation
Elimination of
small regions
Location of
the region
of interest
Feature
extraction
Soft
classification
Weighted
voting system
Figure 1: Steps of the research methodology, where the colors depict the Guillon categories. Note that the images of the steps
“feature extraction” and “soft classification” correspond to the input image zoom, where the squares represent the windows.
TearFilmMapsbasedontheLipidInterferencePatterns
733

(Russ, 1999) is applied to the thresholded image, us-
ing circles of different sizes as templates. Thus, the
circle with the maximum cross-correlation value al-
lows to locate the pupil of the image. Next, a new
circle with the same center than the previous one and
a radius n times larger is created. This this new circle
is used as a first approach to the ROI (see Figure 2).
On the other hand, the area in which the tear film
can be perceived is lighter than the iris and the pupil
which surrounded it. In this way, a second approach
to the ROI can be determined by finding those pixels
whose gray level is greater than a threshold:
th = µ− p × σ (1)
where µ is the mean value of the gray levels of the
image, σ is its standard deviation and p is a weight
factor empirically determined.
Since some images can include irrelevant regions,
such as eyelashes or shadows cast by them, the mor-
phological operator of erosion (Gonzalez and Woods,
2008) is applied in order to eliminate them from this
second approach to the ROI (see Figure 2) . Finally,
the logical AND operator between the two approaches
is calculated. This region is likely to be free of irrele-
vant features and so, in most cases, could be the final
ROI. Despite that, the length of the eyelashes in some
cases and specially the irregularshape of this ROImo-
tivate a final adjustment: the biggest circle concentric
to the pupil is “divided” in sixteen quadrants and, in
each one, the minimum radius is considered in order
to simplify the final ROI. See Figure 2 as an exam-
ple of the whole process. Note that this step of the
methodology corresponds to the line 1 of the Algo-
rithm 1.
2.2 Feature Extraction
Once the ROI is located, all the windows with a spec-
ified size inside it are analyzed and a descriptor per
window is obtained as can be seen in the line 5 of the
Algorithm 1. This descriptor is a quantitative vector
composed of 23 features proposed in (Bol´on-Canedo
et al., 2012), and obtained as follows:
1. Color analysis. The Lab color space (McLaren,
1976) is used to extract color information, since
its use is appropriate in combination with texture
analysis according to (Remeseiro et al., 2011).
This color space is a 3D model where L repre-
sent the lightness of the color, and a and b are the
chromatic components. The color analysis step
consists in transforming the input image in RGB
to the Lab color space in order to subsequently
analyze the texture of its three channels.
Algorithm 1: Pseudo-code of the weighted voting
system for image segmentation
Data: input image I, number of classes n, weights
ω
1
, ω
2
, threshold th, minimum perimeter m
Result: output image O (its labels ∈ [0, n] indicate
the classes, where 0 is the background)
1 ROI := locate
roi(I)
2 initialize matrix of votes V := 0
3 initialize vector of maximum votes V
max
:= 0
4 for each window w ∈ ROI do
5 feats := compute features(w)
6 CP := classify( feats)
7 for each pixel p ∈ w do
8 d := distance(p, center(w))
9 for k ← 1 to n do
10 v = ω
1
·CP[k] +
ω
2
·CP[k]
d
11 V[p][k]+ = v
end
12 v
max
= ω
1
+
ω
2
d
13 V
max
[p]+ = v
max
end
end
14 initialize output image O := 0
15 for each pixel p ∈ ROI do
16 v := max(V[p])
17 i := index(max(V[p]))
18 if (v ≥ th · V
max
[p]) then
19 O[p] := i
end
end
20 C := find
contours(O)
21 for each contour c ∈ C do
22 if perimeter(c) < m) then
23 remove(c)
end
end
2. Texture analysis. The co-occurrence features
technique (Haralick et al., 1973) is used to ex-
tract texture information, since it is the most ap-
propriate method at the problem at hand accord-
ing to (Remeseiro et al., 2011). This method de-
scribes texture in terms of statistical measures,
and it is based on the computation of the condi-
tional joint probabilities of all pairwise combina-
tions of gray levels. It generates a set of gray level
co-occurrence matrices and extracts several statis-
tical measures from their elements. Specifically,
a set of 14 statistics proposed by Haralick et al.
(Haralick et al., 1973) are computed from each
matrix. Next, the mean and the range of these
14 statistics are calculated across matrices in or-
ICAART2014-InternationalConferenceonAgentsandArtificialIntelligence
734
Original image
Green channel
AND image
ROI
First approach to the ROI
Second approach to the ROI
Figure 2: Steps for the location of the region of interest (ROI) over a representative image.
der to obtain a texture descriptor. Note that these
statistics represent features such as contrast or ho-
mogeneity.
3. Feature selection. The correlation-based feature
selection (CFS) method (Hall, 1999) was used for
feature selection in order to reduce the number
of features and, thus, the computational (memory
and time) requirements. It is a simple filter al-
gorithm which ranks feature subsets according to
a correlation based heuristic evaluation function.
The bias of the evaluation function is toward sub-
sets that contain features that are highly correlated
with the class and uncorrelated with each other.
An ad hoc feature selection process based on this
filter was used for dimensionality reduction, so
the descriptor with color texture features was re-
duced, from 588 to 23 features, with no degrada-
tion in performance according to (Bol´on-Canedo
et al., 2012).
2.3 Soft Classification
Once the descriptor of each window located in
the ROI is obtained, a support vector machine
(SVM) (Burges, 1998) is used to compute its class-
membership probabilities as can be seen in the line 6
of the Algorithm 1. Notice that partial class member-
ships are used in soft classification to model uncertain
labeling and mixtures of classes. In this way, the vot-
ing system subsequently presented can vote for each
class according to its probability, instead of voting for
the class with the highest probability. The selection of
the SVM as the machine learning algorithm is based
on the results presented in (Remeseiro et al., 2012).
2.4 Weighted Voting System
The weighted voting system is presented in this paper
for tear film segmentation, although it can be adapted
to any image segmentation problem where the classes
can be represented by a set of features and classified
by a soft classifier. In the problem at hand, the method
considers the class-membership probabilities of each
window of the ROI, and every pixel in this window
receives a vote associated to each class c:
v
c
= ω
1
· p
c
+
ω
2
· p
c
d
(2)
where p
c
is the probability to belong to the class c,
d is the distance from the pixel to the center of the
window, and ω
1
and ω
2
weight the probability and
the distance, respectively.
On the other hand, the maximum vote that every
pixel in this window can receive, assuming maximum
probability, is also calculated:
v
max
= ω
1
+
ω
2
d
(3)
As windows are overlapped and each pixel be-
longs to several windows, the votes received from
each category are added up. Thus, each pixel will
have a set of final votes corresponding to each class
and the maximum final votes. First, only the final
votes of the classes are considered in order to select
the most voted class. Then, the pixel is assigned to
this class only if its final number of votes is higher
than the maximum number of votes weighted by a
threshold th. Note that this threshold is used to dis-
tinguish the real classes from the background. This
main step of the research methodology corresponds
to the lines from 2 to 19 of the Algorithm 1.
2.5 Elimination of Small Regions
Once the previous step is performed, a labeled image
which represents a tear film map is obtained. This la-
bels corresponds to one of the Guillon categories or
represents the background of the image. Small re-
gions may appear in the distribution map, which can
correspond to false positives or noisy areas. Thus, a
post-processing step is performed in order to elimi-
nate them. This steps consists in extracting the con-
tour of each region and calculating its perimeter. In
TearFilmMapsbasedontheLipidInterferencePatterns
735

this way, the regions whose perimeter is less than
a minimum perimeter m previously established are
eliminated. Note that this final step appears in the
lines from 20 to 23 of the Algorithm 1.
3 MATERIALS AND METHODS
The aim of this work is to create tear film maps based
on the lipid interference patterns, using the proposed
methodology. The materials and methods used in this
research are described in this section.
3.1 Image Data-set
Guillon defined five main grades of lipid layer inter-
ference patterns, which in increasing thickness are:
open meshwork, closed meshwork, wave, amorphous
and color fringe. These patterns can be observed with
the Tearscope plus (Tearscope plus, 1997), a hand-
held instrument to view the tear film non-invasively.
It was designed by Guillon (Guillon, 1998) to eval-
uate lipid layer thickness by interference fringe bio-
microscopy, and uses a cold light source to minimize
any drying of the tear film during the examination.
In this research, the image acquisition was carried
out with the Tearscope plus attached to a Topcon SL-
D4 slit lamp (Topcon SL-D4, nd) to gain more mag-
nification. Thus, the interference patterns were ob-
served through this slit-lamp microscope with magni-
fication set at 200X. Since the lipid tear film is not
static between blinks, a video was recorded and an-
alyzed by an optometrist in order to select the best
images for processing. The interference phenomena
was recorded with a Topcon DV-3 digital video cam-
era (Topcon DV-3, nd) and stored via the Topcon
IMAGEnet i-base (Topcon IMAGEnet, nd) at a spa-
tial resolution of 1024× 768 pixels per frame in the
RGB color space. Finally, images were selected to go
through the processing step only when the tear film
lipid layer was completely expanded after eye blink.
A bank of images acquired from healthy patients
with ages ranges from 19 to 33 years was available.
All images in this bank have been annotated from
three different optometrists from the Faculty of Op-
tics and Optometry, University of Santiago de Com-
postela. These annotations consist of delimited re-
gions in the images associated with the Guillon cat-
egories. It contains 44 images in which the experts
have annotated an average of 87 regions each one.
These regions includes samples of the five categories
considered.
3.2 Experimental Procedure
The experimental procedure is detailed as follows:
1. Train a SVM with radial basis kernel and au-
tomatic parameter estimation with representative
samples of the five categories considered. Note
that, for this task, the samples correspond to areas
in which the three optometrists marked the same
category.
2. Locate the ROI of each image in the data-set.
3. Apply the feature extraction methods to the bank
of images, in order to obtain the quantitative vec-
tors of the windows located in their ROIs.
4. Calculate the class-membership probabilities of
the quantitative vectors using the SVM previously
trained.
5. Apply the weighted voting system using different
configurations of parameters (ω
1
, ω
2
and th).
6. Eliminate the regions whose contour has a
perimeter less than a threshold m.
7. Evaluate the effectiveness of the proposed
methodology in terms of the similarity between
the system and the three experts considered.
4 EXPERIMENTAL RESULTS
In this section, the results obtained with the image
data-set will be compared with the annotations made
by three experienced practitioners. First of all, it
should be highlighted that different parameter config-
urations were considered in the weighted voting sys-
tem as can be seen in Section 3.2. However, the rest
of the parameters were empirically established in or-
der to carry out the experimentation presented in this
section. In this sense, the threshold m used to elimi-
nate the small regions was set to 110 pixels based on
the minimum perimeter size of the regions marked by
the optometrists. Note also that the window size for
segmentation is 32 × 32 pixels, since it is the mini-
mum window size which allows a precise segmenta-
tion and maintains the texture well-defined according
to (Remeseiro et al., 2013b).
First, the research methodology was applied over
the data-set of 44 images and so the segmentation pro-
cess was performed on their ROIs. In this manner,
the output of the process is a labeled image, so-called
tear film map, in which each label is represented by a
color. Notice that each color is associated to a Guil-
lon category in this way: red means open meshwork,
yellow means closed meshwork, green means wave,
cyan means amorphous, and blue means color fringe.
ICAART2014-InternationalConferenceonAgentsandArtificialIntelligence
736

Additionally, the background of the output image is
represented by black.
Figure 3 illustrates a tear film map obtained with
the proposed methodology over an input image from
the data-set. As it can be seen, there are regions of
the image in which the experts agree with the Guillon
category, whereas there are other regions in which the
agreement is non-existent. The same situation hap-
pens if the output map is compared with the experts’
annotations.
The validation process consists in dealing with the
system as it was another expert, and so a comparison
between the “four hypothetical” experts was carried
out. In this manner, the regions marked by a refer-
ence expert are compared with the regions annotated
by the other three experts. In this comparison, the
number of pixels of the reference expert that coincide
with other experts are counted and graphically rep-
resented. Thus, in a comparison of a reference expert
versus the rest of the experts, there will be a number of
pixels which agree with 0, 1, 2 or 3 experts. Note that
the agreement with 3 experts means a total agreement
between the four experts considered, and an agree-
ment with 0 experts represents the pixels marked only
by the reference expert. The idea is to perform this
comparison between the experts in such a way that
each expert is the reference expert once, and so a total
of four comparisons are obtained for a single param-
eter configuration.
The parameter values analyzed in this section are
in the range [0, 1], with a 0.1 step, for the three param-
eters considered. It should be highlighted that at least
one of the weights, ω
1
and ω
2
, has to have a non-zero
value. Also, if the threshold th = 1, the output image
contains no information and all the pixels belong to
the background. The reason is that a so high thresh-
old implies that most of the class-membership prob-
abilities have to have the maximum value. Among
all the combinations of the three parameters, three
of them have been selected to show the validation
of the proposed methodology: (i) [ω
1
= 1, ω
1
= 0],
which only considers the first part of the Equation 2,
(ii) [ω
1
= 0, ω
2
= 1], which only considers the sec-
ond part of the Equation 2, and (iii) [ω
1
= 1, ω
2
= 1],
which equally considers both parts of the Equation 2.
In these three cases, the threshold value is th = 0.9.
Figures 4, 5 and 6 illustrates through bar plots these
three configurations, respectively. If the three config-
urations are compared, no significant differences can
be appreciated which means that considering or not
one of the two terms of the Equation 2 is not too rele-
vant. The main reason is that in both terms, the class-
membership probabilities of the SVM are taken into
account and so their values are important enough to
be the key of the weighted voting system.
On the other hand, if the bar graphs of each ex-
pert are analyzed, interesting differences can be ob-
served. For example, if we focus on the plots “system
vs all”, it can be seen that there are a little number
of pixels which match with 0, 1 and 2 experts. This
fact means that the system has a conservative behav-
ior. In contrast, the graphs “expert3 vs all” show how
the expert3 has a completely different behavior since
it tends to mark bigger regions. And finally, in the
middle of both extremes, the other two graphs “ex-
pert1 vs all” and “expert2 vs all”, demonstrate that
both expert1 and expert2 have intermediate positions
with a really similar plot tendency.
After this analysis focus on the weights ω
1
and
ω
2
, the aim now is to explore the impact of the thresh-
old th. Consequently, only one of the above three pa-
rameter configurations is considered but with a lower
threshold th = 0.8. As can be seen in Figure 7, the
number of pixels in which the agreement is total has
increased. Thus, the bigger regions obtained by low-
ing the threshold still match with regions marked by
the three optometrists. However, the number of dis-
agreements has also increased as expected, and now
the tendency is more similar to the tendencies of the
expert1 and expert2. Finally, two noticeable aspects
of the graphs should be highlighted: (i) the system
produces some tear film maps in which there are re-
gions associated to the wave pattern that do not match
with any expert, (ii) the expert3 marked some regions
of the color fringe pattern that do not match with any
expert. Not only does this anomalous behavior ap-
pear in the images obtained by the system, but also
in some of the ones marked by the experts. Thus, it
could be said that the system behaves like the experts
in a greater or lesser degree depending on the param-
eter configurations.
5 CONCLUSIONS AND FUTURE
RESEARCH
An automatic methodology for tear film lipid layer
segmentation is proposed in this paper. From an in-
put image acquired with the Tearscope plus, a dis-
tribution map of the tear film is obtained as a result.
This methodology includes the application of color
texture analysis techniques, soft classification and a
weighted voting system focus on two variables (prob-
abilities and distances). It improves a previous ap-
proach by eliminating the “unreal” background class,
characterized by a high degree of variability, and con-
sidering class-membership probabilities. Results ob-
tained with this methodology demonstrate that the
TearFilmMapsbasedontheLipidInterferencePatterns
737
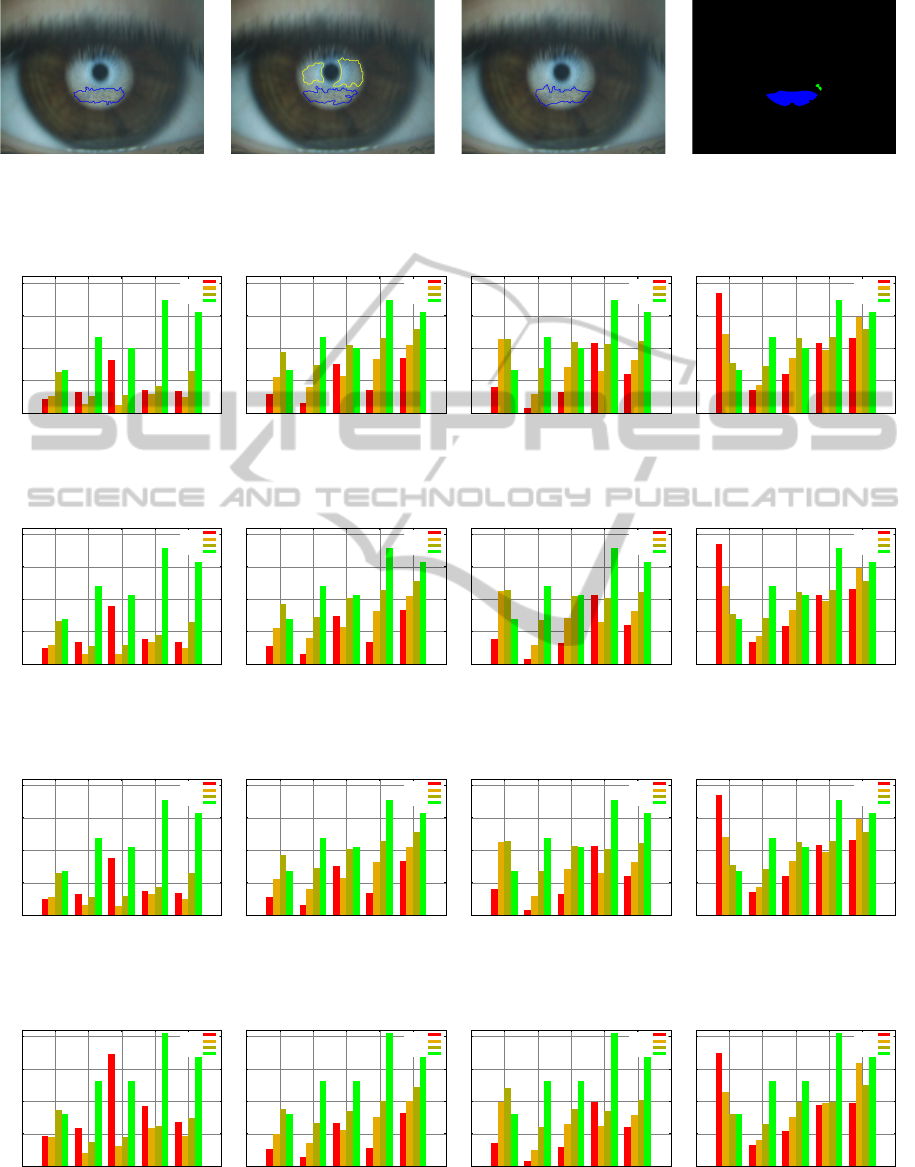
(a) (b) (c) (d)
Figure 3: A representative example of tear film map: from (a) to (c) images annotated by the expert1, expert2, and expert3,
respectively; (d) tear film map obtained with the proposed methodology. Note that the relation between colors and categories
is: red - open meshwork, yellow - closed meshwork, green - wave, cyan - amorphous, and blue - color fringe.
(a) (b) (c) (d)
50K
100K
150K
200K
CO
AM
WA
CM
OM
number of pixels
lipid interference patterns
0experts
1expert
2experts
3experts
50K
100K
150K
200K
CO
AM
WA
CM
OM
number of pixels
lipid interference patterns
0experts
1expert
2experts
3experts
50K
100K
150K
200K
CO
AM
WA
CM
OM
number of pixels
lipid interference patterns
0experts
1expert
2experts
3experts
50K
100K
150K
200K
CO
AM
WA
CM
OM
number of pixels
lipid interference patterns
0experts
1expert
2experts
3experts
Figure 4: Comparisons between experts when [ω
1
= 1, ω
2
= 0, th = 0.9]: (a) system vs all, (b) expert1 vs all, (c) expert2 vs
all, (d) expert3 vs all.
(a) (b) (c) (d)
50K
100K
150K
200K
CO
AM
WA
CM
OM
number of pixels
lipid interference patterns
0experts
1expert
2experts
3experts
50K
100K
150K
200K
CO
AM
WA
CM
OM
number of pixels
lipid interference patterns
0experts
1expert
2experts
3experts
50K
100K
150K
200K
CO
AM
WA
CM
OM
number of pixels
lipid interference patterns
0experts
1expert
2experts
3experts
50K
100K
150K
200K
CO
AM
WA
CM
OM
number of pixels
lipid interference patterns
0experts
1expert
2experts
3experts
Figure 5: Comparisons between experts when [ω
1
= 0, ω
2
= 1, th = 0.9]: (a) system vs all, (b) expert1 vs all, (c) expert2 vs
all, (d) expert3 vs all.
(a) (b) (c) (d)
50K
100K
150K
200K
CO
AM
WA
CM
OM
number of pixels
lipid interference patterns
0experts
1expert
2experts
3experts
50K
100K
150K
200K
CO
AM
WA
CM
OM
number of pixels
lipid interference patterns
0experts
1expert
2experts
3experts
50K
100K
150K
200K
CO
AM
WA
CM
OM
number of pixels
lipid interference patterns
0experts
1expert
2experts
3experts
50K
100K
150K
200K
CO
AM
WA
CM
OM
number of pixels
lipid interference patterns
0experts
1expert
2experts
3experts
Figure 6: Comparisons between experts when [ω
1
= 1, ω
2
= 1, th = 0.9]: (a) system vs all, (b) expert1 vs all, (c) expert2 vs
all, (d) expert3 vs all.
(a) (b) (c) (d)
50K
100K
150K
200K
CO
AM
WA
CM
OM
number of pixels
lipid interference patterns
0experts
1expert
2experts
3experts
50K
100K
150K
200K
CO
AM
WA
CM
OM
number of pixels
lipid interference patterns
0experts
1expert
2experts
3experts
50K
100K
150K
200K
CO
AM
WA
CM
OM
number of pixels
lipid interference patterns
0experts
1expert
2experts
3experts
50K
100K
150K
200K
CO
AM
WA
CM
OM
number of pixels
lipid interference patterns
0experts
1expert
2experts
3experts
Figure 7: Comparisons between experts when [ω
1
= 1, ω
2
= 1, th = 0.8]: (a) system vs all, (b) expert1 vs all, (c) expert2 vs
all, (d) expert3 vs all.
ICAART2014-InternationalConferenceonAgentsandArtificialIntelligence
738

tear film maps provided by the developed system are
similar to the annotations done by three experienced
optometrists. In clinical terms, the manual process
done by experts can be automated with the benefits of
being unaffected by subjectivefactors and providing a
detailed distribution of the interference patterns over
the whole tear film lipid layer.
In this research, the proposed methodology pro-
cesses the whole set of windows inside the region of
interest. Although the feature extraction time over
one single window is almost negligible (under 1 sec-
ond), processing the whole set takes too long. There-
fore, as future research, we plan to develop an opti-
mization of the proposed methodology focus on the
reduction of the processing time. In addition, our fu-
ture research will also involve proposing new algo-
rithms for tear film segmentation based, for example,
on other classical algorithms such as seeded region
growing.
ACKNOWLEDGEMENTS
This research has been partially funded by the Sec-
retar´ıa de Estado de Investigaci´on of the Spanish
Government and FEDER funds of the European
Union through the research projects PI10/00578 and
TIN2011-25476. Beatriz Remeseiro acknowledges
the support of Xunta de Galicia under Plan I2C Grant
Program.
REFERENCES
Bol´on-Canedo, V., Peteiro-Barral, D., Remeseiro, B.,
Alonso-Betanzos, A., Guijarro-Berdi˜nas, B., Mos-
quera, A., Penedo, M., and S´anchez-Maro˜no, N.
(2012). Interferential Tear Film Lipid Layer Classifi-
cation: an Automatic Dry Eye Test. In IEEE Interna-
tional Conference on Tools with Artificial Intelligence
(ICTAI), pages 359–366, Athens, Greece.
Brewitt, H. and Sistani, F. (2001). Dry Eye Disease: The
Scale of the Problem. Survey of Ophthalmology,
45(2):199–202.
Bron, A. J. (2001). Diagnosis of Dry Eye. Survey of Oph-
thalmology, 45(2).
Burges, C. J. C. (1998). A Tutorial on Support Vector
Machines for Pattern Recognition. Data Mining and
Knowledge Discovery, 2:121–167.
DEWS (2007). The 2007 Report of the Internacional Dry
Eye workshop (DEWS). The ocular surface, 5(2):65–
204.
Garc´ıa-Res´ua, C., Gir´aldez-Fern´andez, M., Penedo, M.,
Calvo, D., Penas, M., and Yebra-Pimentel, E. (2013).
New software application for clarifying tear film lipid
layer patterns. Cornea, 32(4):538–546.
Gonzalez, R. and Woods, R. (2008). Digital image process-
ing. Pearson/Prentice Hall.
Guillon, J. (1998). Non-invasive tearscope plus routine for
contact lens fitting. Cont Lens Anterior Eye, 21 Suppl
1.
Hall, M. (1999). Correlation-based feature selection for
machine learning. PhD thesis, The University of
Waikato.
Haralick, R. M., Shanmugam, K., and Dinstein, I. (1973).
Texture Features for Image Classification. IEEE
Transactions on Systems, Man, and Cybernetics In
Systems, Man and Cybernetics, 3:610–621.
McLaren, K. (1976). The development of the CIE 1976
(L*a*b) uniform colour-space and colour-difference
formula. Journal of the Society of Dyers and
Colourists, 92(9):338–341.
Remeseiro, B., Penas, M., Barreira, N., Mosquera, A.,
Novo, J., and Garc´ıa-Res´ua, C. (2013a). Automatic
classification of the interferential tear film lipid layer
using colour texture analysis. Computer Methods and
Programs in Biomedicine, 111:93–103.
Remeseiro, B., Penas, M., Mosquera, A., Novo, J., Penedo,
M. G., and Yebra-Pimentel, E. (2012). Statistical com-
parison of classifiers applied to the interferential tear
film lipid layer automatic classification. Computa-
tional and Mathematical Methods in Medicine, 2012
(art. 207315):1–10.
Remeseiro, B., Ramos, L., Barreira, N., Mosquera, A., and
Yebra-Pimentel, E. (2013b). Colour texture segmenta-
tion of tear film lipid layer images. In Eurocast 2013,
pages 260–261.
Remeseiro, B., Ramos, L., Penas, M., Mart´ınez, E., Penedo,
M., and Mosquera, A. (2011). Colour texture anal-
ysis for classifying the tear film lipid layer: a com-
parative study. In International Conference on Dig-
ital Image Computing: Techniques and Applications
(DICTA), pages 268–273, Noosa, Australia.
Russ, J. (1999). The image processing handbook (3rd ed.).
Boca Raton, FL, USA: CRC Press, Inc.
Tearscope plus (1997). Tearscope plus clinical hand book
and tearscope plus instructions. Keeler Ltd. Windsor,
Berkshire, Keeler Inc, Broomall, PA.
Topcon DV-3 (n.d.). Topcon DV-3 digital video camera.
Topcon Medical Systems, Oakland, NJ, USA.
Topcon IMAGEnet (n.d.). Topcon IMAGEnet i-base. Top-
con Medical Systems, Oakland, NJ, USA.
Topcon SL-D4 (n.d.). Topcon SL-D4 slit lamp. Topcon
Medical Systems, Oakland, NJ, USA.
TearFilmMapsbasedontheLipidInterferencePatterns
739
