
Automatic Identification of Motor Patterns Leading to Freezing of
Gait in Parkinson’s Disease
An Exploratory Study
Luca Palmerini
1
, Laura Rocchi
1
, Jeffrey M. Hausdorff
2
and Lorenzo Chiari
1
1
Department of Electrical, Electronic and Information Engineering “Guglielmo Marconi”, University of Bologna,
Bologna, Italy
2
Laboratory for Gait & Neurodynamics, Movement Disorders Unit, Department of Neurology,
Tel-Aviv Sourasky Medical Center, Tel-Aviv, Israel
Keywords: Freezing, Parkinson’s Disease, Symbolic Aggregate Approximation, Acceleration, Wearable Sensors.
Abstract: Freezing of gait (FOG) is a common and disabling gait disturbance among patients with advanced
Parkinson’s Disease (PD). FOG episodes are often overcome using attention or cues from the environment.
Hence, identification of events prior to FOG may be very effective to improve mobility in PD patients.
Previous work has suggested that there are changes in the gait pattern just prior to freezing. Nonetheless,
little work has been done to explore the possibility of identifying motor patterns that are characteristic of the
pre-FOG phase (few seconds before the FOG). We analysed the acceleration signals from sensors worn on
the ankle, thigh, and trunk of eight patients with PD who experienced freezing. We translated windows of
the raw signals in symbols by using Symbolic Aggregate approXimation. The aim was to discriminate the
patterns of symbols characterizing pre-FOG from the ones characterizing normal activity (standing and
walking with no FOG). Sensitivity over 50% and Specificity over 70% were obtained by using a classifier
on symbolic data, with different combinations of sensor position/sampling/windows duration. These
preliminary findings demonstrate that it is possible to automatically identify (some of) the motor patterns
that eventually lead to FOG events before they occur by using wearable sensors.
1 INTRODUCTION
Freezing of gait (FOG) is a disabling gait
disturbance that is common among patients with
advanced Parkinson’s Disease (PD). FOG can
manifest as an impairment of the initiation and
termination of gait and as a sudden interruption of
walking (Nieuwboer, 2004). During the FOG
episode the patients feel as if their feet are glued to
the ground and cannot resume walking. Recent work
has focused on using wearable motion sensors to
detect freezing of gait (FOG) as soon as it starts
(Bächlin, 2010); (Moore, 2013); (Mazilu, 2013),
obtaining satisfactory accuracies. Although previous
work has suggested that there are changes in the gait
pattern just prior to freezing (Nieuwboer, 2004),
only one work has recently explored the possibility
of identifying motor patterns that are characteristic
of the pre-FOG phase (i.e., a few seconds before the
FOG happens) (Mazilu, 2013). FOG episodes are
often overcome using attention or cues; hence,
identification of events prior to FOG may be very
effective to improve mobility in PD patients by
producing an auditory cue just before the FOG
starts. This is why in the current study we focused
on identification of the pre-FOG phase: we analyzed
the acceleration signals from sensors worn on the
ankle, thigh, and trunk of eight patients with
Parkinson’s disease who experienced freezing
(Bächlin, 2010). We translated windows of the raw
signals in sequences of symbols by using SAX
(Symbolic Aggregate approXimation) (Lin, 2002;
2003). A previous work applied this technique to
study gait symmetry in patients with PD (Sant’Anna,
2011). The aim of the current study was to
discriminate the patterns of symbols characterizing
pre-FOG from the ones characterizing normal
activity (i.e., standing and walking with no FOG).
730
Palmerini L., Rocchi L., M. Hausdorff J. and Chiari L..
Automatic Identification of Motor Patterns Leading to Freezing of Gait in Parkinson’s Disease - An Exploratory Study.
DOI: 10.5220/0004912107300734
In Proceedings of the 3rd International Conference on Pattern Recognition Applications and Methods (ICPRAM-2014), pages 730-734
ISBN: 978-989-758-018-5
Copyright
c
2014 SCITEPRESS (Science and Technology Publications, Lda.)

Figure 1: Acceleration signal converted in symbols.
2 METHODS
Symbolic data analysis was applied on the Daphnet
Database, which was described in (Bächlin, 2010).,
and which stores acceleration signals from
acceleration sensors positioned monolaterally on the
ankle, thigh and trunk of 8 patients with PD who
experienced freezing (the two patients who did not
experience freezing were not considered in this
study). The acceleration signals available for each
sensor were: Antero-Posterior (forward), Medio-
Lateral (horizontal), and Vertical. We chose to
consider the norm of the three acceleration signals
for the following analysis.
Parts of signal which did not correspond to the
experiment part (as explained in the Daphnet
documentation) were deleted. Resulting signals were
normalized (z-score).
As exemplified in Fig. 1, we divided the signals
in a No-Event part (i.e., standing and walking with
no FOG), followed by a pre-FOG window (i.e., few
seconds before the FOG happened), followed by a
FOG part (i.e. during FOG).
The FOG part was not considered in this
exploratory analysis, since we were interested in
identifying the difference between normal activity
and pre-FOG.
The pre-FOG window was defined as a period of
1, 2, or 3 seconds before the FOG. Correspondingly,
the “No-Event” part of the signal was divided in
consecutive No-Event windows of the same duration
as the pre-FOG windows.
Since the No-Event part of the signal was
generally much longer than the pre-FOG window,
the No-Event windows were much more than the
pre-FOG windows, resulting in an unbalanced
dataset (Table 1): later in this section, this issue will
be dealt with.
The different windows duration were considered
in order to see if there was a duration which could
allow a better identification of the pre-FOG patterns.
When the time between two following FOG
events was less than 3 seconds, no pre-FOG window
was considered, for any window durations.
This was done for two reasons:
- In order to obtain a fair comparison between
different window durations: in fact in this way
the number of pre-FOG windows is the same for
all the different durations (see Table 1).
- In order to avoid that the pre-FOG window
would partly capture patterns of the previous
FOG.
Table 1: Mean and std values of the number of pre-FOG
and No-Event windows across all subjects.
Win Duration
num. pre-FOG
windows
num. No-Event
windows
1 25.75±14.2 1427±409
2 25.75±14.2 693±203
3 25.75±14.2 448±134
AutomaticIdentificationofMotorPatternsLeadingtoFreezingofGaitinParkinson'sDisease-AnExploratoryStudy
731
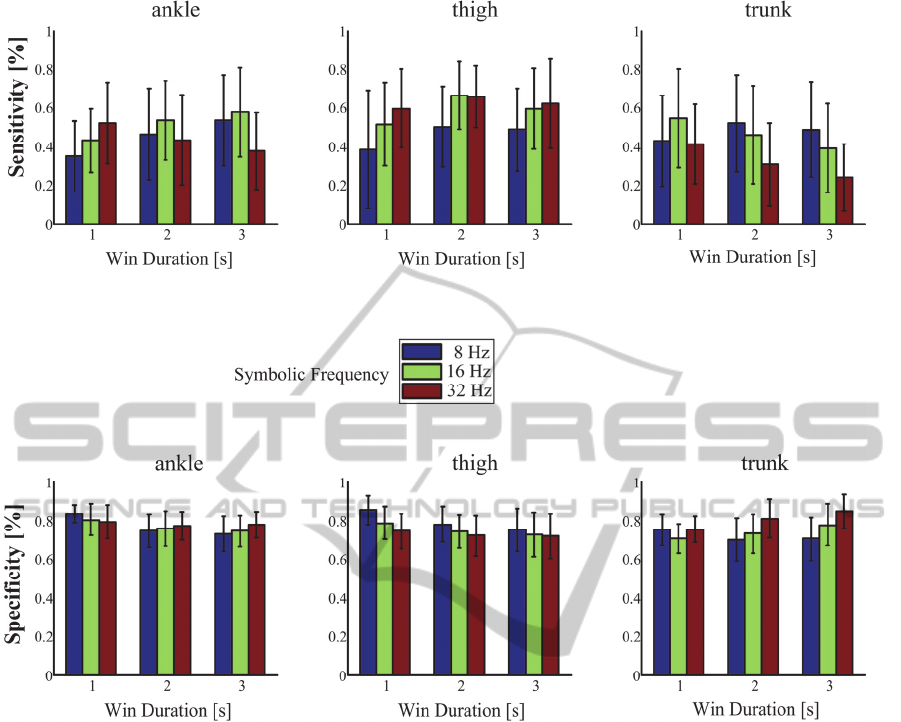
Figure 2: Results of sensitivity (± STD) and specificity (± STD) as function of different combinations of observation
window duration, symbolic frequency, and sensor position.
The obtained windows were translated into
sequences of symbols by using the SAX algorithm
(Lin, 2003). Symbols can be considered as letters
from an alphabet (we arbitrarily considered a 10
symbols alphabet) that represent the considered
window instead of the raw acceleration values (as
shown in Fig. 1).
In SAX, a single symbol represents consecutive
samples of the raw signals in the considered
window, thus automatically performing
dimensionality reduction. Therefore the symbolic
data will have a new (lower) sampling frequency.
The original sampling frequency of acceleration
signals was 64 Hz: in order to choose the optimal
symbolic sampling frequency (how many symbols in
one second), we considered different options: 8, 16,
and 32 Hz, corresponding to translate 8, 4, 2 original
samples in one symbol respectively.
In order to find patterns of symbols which are
characteristic of the pre-FOG window (Fig. 1), and
to discriminate them from the No-Event windows,
we used the K-nearest neighbour’s classifier (with
k=1). Instead of the Euclidean distance, we used the
symbolic distance between sequences of symbols,
which is defined in (Lin, 2002; 2003).
In order to obtain a method that would be as
generalizable as possible and that would perform
well regardless of the different patients considered,
we used a leave-one-subject-out cross validation to
determine the accuracy of the proposed approach. In
the leave-one-subject-out cross validation the data of
one patient (all his/her signal segments) is classified
by using the data captured from the rest of patients.
The results will be presented in terms of
sensitivity (proportion of pre-FOG windows which
are correctly identified) and specificity (proportion
of No-Event windows which are correctly
identified).
Since the dataset is highly unbalanced between
the two classes (see Table 1), a random under-
ICPRAM2014-InternationalConferenceonPatternRecognitionApplicationsandMethods
732

sampling of the majority class (No-Event) was
performed in the training phase of the classifier. This
was done in order to have the same number of Pre-
FOG and No Event windows to train the classifier
with. If no under-sampling had been performed, the
classifier would have “learned” mostly No-Event
patterns thus leading to high specificity but very
poor sensitivity.
In order to test the significance of results, a
random classifier was made, which randomly
assigned “No-Event” or “pre-FOG” classes based on
the proportion of classes in the under-sampled
training set. One would expect such a classifier to
perform with sensitivity and specificity around 50%.
3 RESULTS AND DISCUSSION
Results are reported in Fig. 2.
The best obtained result, in terms of trade-off
between sensitivity and specificity (arithmetic
mean), was
- Sensitivity: 66.5 %
- Specificity: 73.9 %,
In the following, the details of all the parameters of
the data analysis corresponding to this result are
listed:
- Thigh sensor
- Norm of the signal
- Symbolic Frequency of 16 Hz
- Duration of the windows of 2 seconds
- Alphabet size of 10
Both sensitivity and specificity of this combination
resulted significantly better than the ones of the
random classifier (Fig. 3), which performed, as
expected, with sensitivity and specificity around
50%.
Figure 3: Comparison between the performance of the best
classifier and of the random classifier.
From results in Fig. 2 it can be noted that
different combinations of sensors/signals/ frequency
can lead to higher specificity or higher sensitivity
(but not to both).
From results in Fig. 2 it can also be noted that
thigh sensor seems to perform generally better than
ankle and trunk sensors in sensitivity, and
comparably in specificity.
Also, sensitivity estimates tend to be less
consistent (higher variability of performance across
subjects) than specificity estimates.
Although the best result is obtained with a 2-
seconds window, it seems that there is not a clear
difference or pattern in considering windows of
different durations.
Finally, considering different symbolic
frequencies leads to different combinations of
sensitivity and specificity but no consistent pattern
can be observed (e.g. higher symbolic frequency
always leads to better sensitivity/specificity).
Interestingly, the sensitivity in discriminating
between pre-FOG patterns and normal activity is
comparable to the sensitivity in discriminating
between FOG patterns and normal activities
obtained by previous studies (73.1% in Bächlin
2010, 66.3% in Mazilu 2012, 68.5% in Mazilu
2013).
On the other hand, specificity is lower than the
ones obtained in those studies (81.6% in Bächlin
2010, 95.4% in Mazilu 2012, 86.8% in Mazilu
2013).
However, an overall lower performance was
expected because the task of discriminating the
patterns before the event occurs is generally more
complex than detecting the event after it has
happened.
These preliminary findings demonstrate that it is
possible to identify (some of) the motor patterns that
eventually lead to FOG events before they occur,
support the idea that the gait pattern changes prior to
freezing, and suggest that this pre-event period can
be automatically identified by using wearable
sensors.
As a limitation of this study, the algorithm
presented in this study was not optimized for speed;
in future work, a real-time implementation should be
done.
Moreover, the use of different classifiers and the
fusion of decisions made from different
combinations of sensors, time windows and
frequencies, could possibly permit to improve the
obtained results.
AutomaticIdentificationofMotorPatternsLeadingtoFreezingofGaitinParkinson'sDisease-AnExploratoryStudy
733

ACKNOWLEDGEMENTS
The research leading to these results has received
funding from the European Union - Seventh
Framework Programme (FP7/2007-2013) under
grant agreement n°288516 (CuPiD project).
REFERENCES
Bächlin M., Plotnik M., Roggen D., Maidan I., Hausdorff
J. M., Giladi N., Tröster G., Wearable Assistant for
Parkinson’s Disease Patients With the Freezing of Gait
Symptom, IEEE Trans on Information Technology in
Biomedicine, 14(2), March 2010, pages 436-446.
Lin J., Keogh E., Patel P., Lonardi S., Finding Motifs in
Time Series, proceedings of the 2nd Workshop on
Temporal Data Mining, 8th ACM SIGKDD
International Conference on Knowledge Discovery
and Data Mining. Edmonton, Alberta, Canada. July
23-26, 2002
Lin J., Keogh E., Lonardi S., Chiu B., A Symbolic
Representation of Time Series, with Implications for
Streaming Algorithms, proceedings of the 8th ACM
SIGMOD Workshop on Research Issues in Data
Mining and Knowledge Discovery. San Diego, CA.
June 13, 2003.
Mazilu S., Hardegger M., Zhu Z., Roggen D., Tröster G.,
Plotnik M. and Hausdorff J. M., Online Detection of
Freezing of Gait with Smartphones and Machine
Learning Techniques, 6th International Conference on
Pervasive Computing Technologies for Healthcare
(PervasiveHealth), 2012
Mazilu S., Calatroni A., Gazit E., Roggen D., Hausdorff J.
M., and Tröster G., Feature Learning for Detection and
Prediction of Freezing of Gait in Parkinson’s Disease,
MLDM, Lecture Notes in Computer Science (LNCS),
Springer 2013.
Moore S. T., Yungher D. A., Morris T. R., Dilda V.,
MacDougall H. G., Shine J. M., Naismith S. L., Lewis
S. J., Autonomous identification of freezing of gait in
Parkinson’s disease from lower-body segmental
accelerometry. Journal of neuroengineering and
rehabilitation, 10(1), 19. 2013
Nieuwboer A., Dom R., De Weerdt W., Desloovere K.,
Janssens L., Stijn V., Electromyographic profiles of
gait prior to onset of freezing episodes in patients with
Parkinson's disease. Brain. 2004 Jul;127(Pt 7):1650-
60.
Sant’Anna et al., “A new measure of movement symmetry
in early Parkinson’s disease patients using symbolic
processing of inertial sensor data.,” IEEE trans on bio-
medical engineering, vol. 58, no. 7, pp. 2127–35, Jul.
2011.
ICPRAM2014-InternationalConferenceonPatternRecognitionApplicationsandMethods
734
