
Spatial Distribution of Wireless Sensor Nodes in the Urban
Environment
Vendula Hejlová
Department of Geoinformatics, Palacký University Olomouc, 17. listopadu 50, Olomouc, Czech Republic
Keywords: Wireless Sensor Node, Distribution of Nodes, Graph Theory.
Abstract: Wireless sensor nodes are an important part of every wireless sensor network. If wireless sensor nodes have
implemented or connected sensors, then they can be used for different types of measurements. These
measurements can be carried out either in internal or external environment. Spatial distribution of sensor
nodes in the urban environment is a crucial decision because on its basis the selected elements will be
measured in the suggested places. It is necessary to choose localities where these measurements have the
long term significance. Distribution of sensor nodes in the urban environment is determined by a lot of
factors. These factors are related to technical parameters of nodes, terrain characteristics and parameters of
measured elements. Distribution of sensor nodes is made on the basis of distribution algorithms or the
sensor nodes are randomly spread to the area of interest. The graph theory is usually the background of
distribution algorithms. This theory primarily does not take into account the characteristics of terrain and
measured elements. This paper describes factors that influence the distribution of sensor nodes. The graphs
that are used in the wireless sensor networks are described and the most suitable solution for
implementing terrain characteristics is selected.
1 INTRODUCTION
Spatial distribution of wireless sensor nodes in the
urban environment is a crucial decision because on
its basis the selected elements will be measured in
the suggested places. Measurements of chosen
elements will be realized in the long term so that it is
necessary to choose the localities where the
measurements of selected elements will have long-
term significance. Distribution methods are used to
solve this task but these methods can be effectively
used only in the indoor conditions because it takes
into account only technical parameters and
possibilities of the sensor nodes. The background of
these algorithms is in the most cases based on the
graph theory. A lot of factors influence the
distribution of wireless sensor nodes in the urban
environment so that the effective distribution of
nodes is more complicated. Till now nobody paid
the attention to the terrain characteristics which play
an important role in the distribution process. These
characteristics are very important in the case that the
sensor nodes are situated in the urban environment
so that they should be included in the distribution
methods.
The author solves the problem of distribution of
wireless sensor nodes in the urban environment on
the basis of suggested factors. These factors contain
not only technical requirements for nodes but they
also include terrain factors and parameters of
measured elements. The main objective of this paper
is to analyze graphs which are used in the wireless
sensor networks and select the most suitable one.
The spatial distribution of sensor nodes in the urban
environment could be carried out on the basis of the
selected graph. The crucial requirement for the
graph is to involve technical and terrain factors to its
construction. If terrain factors were included in the
distribution problem then the deployment of wireless
sensor nodes in the outdoor environment could be
effectively solved.
2 STAGE OF RESEARCH
This research has been ending its theoretical part.
The literature, the articles and the distribution
algorithms were studied in this part. The reasearch is
now starting its practical part. The parameters which
influence the distribution of sensor nodes in the
3
Hejlová V..
Spatial Distribution of Wireless Sensor Nodes in the Urban Environment.
Copyright
c
2014 SCITEPRESS (Science and Technology Publications, Lda.)

urban environment were defined. The graph which is
the most suitable for implementing of terrain
parameters was scouted out. The method which will
take into account not only technical parameters but it
will solve the problem of distribution of sensor
nodes more complex will be proposed in the future
work.
3 OUTLINE OF OBJECTIVES
The objectives of this paper are to:
define factors that influence the distribution of
sensor nodes in the urban environment,
scouted out graphs that can be used in the
wireless sensor networks,
select the most suitable graph for implementing
terrain factors,
suggest the way how the terrain factors can be
implemented to the graph.
Till now no attention has been paid to the
implementation of terrain factors into the
distribution methods. These factors are very
important in the case that the sensor nodes are
distributed in the urban environment so that their
inclusion in the distribution methods is necessary.
4 RESEARCH PROBLEM
The first problem of this research is to situate sensor
nodes in the urban environment. Nodes placed in
external conditions have to be protected against
external influences. Their localization is influenced
by other factors like technical characteristics of the
node, terrain characteristics of the area of interest
and parameters of measured elements. It is important
to suggest method which will involve all factors that
influence the distribution of sensor nodes in the
external environment.
4.1 Factors that Influence the
Distribution of Sensor Nodes
Basic factors influencing distribution of sensor
nodes that have to be determined at the beginning
are:
area covered by nodes (size, type),
count of nodes that will be situated in this area,
density - factor which deals with the number of
nodes and the size of selected area (there have to
be situated enough nodes but not to many of
them because the redundant data could be
obtained).
Other factors influencing the distribution of nodes
can be divided into two groups – technical and
terrain. Terrain factors include demands on
characteristics of measured elements (Table 1).
Table. 1: Factors that influence the distribution of nodes.
Number of
group
Technical factors Terrain factors
1 Battery life Landcover (type)
2 Communication range
Obstacles (visibility,
quality of signal)
3
Balanced number of node
neighbours
Characteristics of
measured elements
(recording interval)
4
Back up communication
paths
Security
5 Property conditions
4.1.1 Technical Factors
Technical factors influencing spatial distribution of
sensor nodes in the area of interest are related to the
technical equipment and technical possibilities of
sensor nodes.
Battery life is the most important technical
parameter. Battery is not used equally in all nodes
because some nodes are used more for
communication than the others so that their battery
is more depleted. It is important to ensure that the
battery consumption in all nodes is as equal as
possible. There could be a power cut in overloaded
nodes and measured data could be lost. Routers are
usually more loaded with the communication so that
they should be charged up with better type of
batteries or equipped by the solar panel. Battery is
discharged with the second power of communication
distance. The better solution is if the nodes
communicate for shorter distances than the longer
ones.
Communication distance shows the maximal
distance that enables the communication among
nodes. Communication distance depends on the used
protocol and terrain characteristics.
Every node should have balanced number of
neighbours. One sensor node should not be
overloaded with communication and the other sensor
nodes should not be used only rarely. Balanced
communication deals with energy consumption of
nodes which are participating in the wireless sensor
network.
Back up communication paths in the graph are
necessary in the case of the power cut of one sensor
SENSORNETS2014-DoctoralConsortium
4

node. Data that are sent through this node can not be
directed to the gateway so that they can be lost.
4.1.2 Terrain Factors
Terrain factors include the demands on measured
elements. The major terrain factors that influence
spatial distribution of sensor nodes are composited
of landcover, characteristics of measured elements
and property conditions.
Landcover shows the different types of the land
surface. A lot of types of landcover that influence
values of measured elements are situated in the
urban environment. Nodes have to cover all types of
landcover in the area of interest. Every type of
landcover has different characteristics which depend
on heat absorption and reflection. It is necessary to
involve these facts to obtain comparable data from
different types of landcover. All types of landcover
have to be covered by at least one node. Another aim
of spatial distribution of sensor nodes in the urban
environment is to locate nodes to more and less
polluted parts of the area of interest (depend on the
distance from the source of air pollutants). The
comparison of data obtained in the different parts of
area with different level of air pollutants is useful for
predicting and modelling of different types of
pollutants dispersion scenarios.
Terrain obstacle is an object in the
communication path which can affect
communication among two nodes. Obstacles can be
natural or human made. Different kinds of obstacles
can influence signal transmission in the various
ways. It depends on their structure and angle of
arrival of the transmitting wave. It is suggested to
avoid any obstacles that are situated between two
nodes which are communicating with each other.
Demand on direct visibility between two
communicating nodes comes from terrain obstacles.
Quality of signal depends on the degree of visibility
between nodes which communicate with each other.
If these nodes are located in the area without
obstacles, signal is only slightly influenced by
dispersion and noise. Quality of signal can be
influenced by another device which transmits in the
same range as the sensor nodes.
Every measured element has defined the
standardized height above surface, degree of shading
and time of recording of measurement. Interval of
recording is a parameter which points out the time
step of data recording and it depends on the
measured elements. Basic meteorological elements
are recorded in the climatologic determined times.
Three basic climatologic terms are defined (7 am, 2
pm, 9 pm). Detailed measurements can be recorded
in more detailed climatologic terms. Own intervals
for measurement can be determined but they have to
be the same for all nodes to obtain comparable data.
It is appropriate to select an interval which does not
yield redundant data. The interval does not have to
be too large because some differences in values of
selected elements can appear in short time periods.
Security is a demand which is very complicated
to fulfil. It is necessary to situate nodes into “safe”
area to protect them against vandals. It can be used
some tricks which can increase the probability that
the nodes will not be stolen. These arrangements can
involve the placement of nodes in:
higher positions
less visible places
places with low human movement
hardly accessible places
fenced places
Property conditions are important factor if the nodes
are situated in the private properties because the
owner has to agree with their placement on his
property.
5 STATE OF ART
A lot of studies deal with the application of graph
theory in wireless sensor networks because the
communication among nodes can be easily
described by this theory. Wireless sensor nodes are
represented by nodes in the graph and
communication paths are depicted with edges. The
aim of lower number of studies is to search the most
suitable localization for wireless sensor nodes. These
studies do not involve terrain characteristics and
parameters of measured elements in the proposed
algorithms. The obstacles which influence signal
transmitting are included only in the elementary
basis because graph theory does not primarily count
with the usage of nodes in the external conditions.
The most frequently solved factors which influence
distribution of wireless sensor nodes are battery life
and communication distance.
Mizera (2011) dealt with the proposition of
wireless sensor network which was applied to the
monitoring of potential forest fires in the selected
area which was situated in the eastern part of the
Czech Republic. Mesh topology was used for this
kind of monitoring. This type of topology allows to
use more communication paths among nodes. The
nodes were situated in squares. The distance
SpatialDistributionofWirelessSensorNodesintheUrbanEnvironment
5

between two neighbour nodes was 200 meters.
Terrain obstacles were only mentioned and they
were not involved in the calculation but they could
be expressed as weights in the graph. Sarioz (2012)
aimed his dissertation thesis at data transmitting in
wireless sensor networks. The communication
among nodes was described by graph theory. His
attention was concentrated on obstacles and their
distribution in the communication paths. He tested
which deployment of obstacles influences more the
transmitting wave and which modifies the wave only
subtly. Kawagashi (2005) presented a model which
uses percolation, a kind of random graph where the
edges are formed and the communication is
performed only among the nearest nodes. He has
commented that the jump effect of the phase
transition appears sharply by synergistic effect with
radio wave attenuation as the distance between the
transmitter and the receiver increases. The distance
between the nodes should be in effective range. Yan
(2008) has dealt with multilevel clustering as a
mechanism for prolonging the lifetime of wireless
sensor network node. Root tree with the
performances of the minimal relay set and the
maximal weight according to graph theory was
declared. Energy-aware multilevel algorithm was
proposed. This algorithm is able to reduce the
number of relays used for data transmission and it
enables to load energy evenly among all sensors in
the network. Jorio (2013) proposed a new algorithm
which concentrates on the energy issue in the
wireless sensor nodes. K-Way Special Clustering
Algorithm in wireless sensor network was proposed.
This algorithm is based on spectral classification.
The aim of this algorithm is to find the ideal
distribution of wireless sensor nodes and their
cluster heads in the area of interests. Classification
method determines similar nodes before identifying
cluster heads. Residual energy is taken into account
when the cluster head is scouted out. Nodes and
communication links are represented by the graph
theory. Results show that this method ensures lower
energy consumption in nodes. Ding (2008) aimed
the attention at limited energy source in wireless
sensor nodes. He proposed a new two dimensional
model with percolations using random graph which
connects only neighbour nodes. Connectivity and
energy consumption was investigated. The energy
consumption was analyzed by Markov process and
all the results were investigated in the simulation
process. The energy consumption in nodes is solved
in the other studies like the one from Lu (2005). This
study deals with the question of providing periodic
energy-efficient radio sleep cycles while minimize
the end to end communication delays. He aimed his
attention at communication latency because every
sensor node has a duty to be awake for given time
slots and data do not have to be obtained in this
given time. He formulated a graph theoretical
abstraction of the problem. The data transmitting
which is displayed with graph theory is described in
the study from Baranidharan (2012). This study
deals with a design of energy efficient protocol for
clustered wireless sensor networks. First of all the
cluster head is selected. Data are collected in all
clusters and they are sent to the head of their cluster.
The algorithm which is based on the graph theory is
proposed. The shortest path from the selected node
to the cluster head is searched. Silva (2009)
proposed a model that protects against the overflow
of communication channel. This overflow can cause
the lost of transmitted packets. Two types of
congestion can appear in the wireless sensor
networks – node level (caused by buffer overflow)
or link level (caused by sharing wireless channels).
Link overflows are studied in this paper. The
measurement of congestion is the inverse value of
the greatest eigenvalue of the adjacency matrix in
the random graph. This measure gives an
approximation of the average quantity of wireless
links of a certain length in the network. The
congestion number is linked to the number of
connected paths of given length. Haghpanahi (2012)
solved the problem of connectivity in large scale
wireless sensor networks. The desired path of traffic
flow is displayed with the flow vector. The known
count of flows from one node leads to the known
number of edges which originate in every sensor
node. The existence of enough paths connecting the
source and the destination node is guaranteed. The
density of wireless sensor network is known. Kar
(2008) aimed his work at design of wireless sensor
network topology. This paper studies the problem of
designing the topology assigning the probabilities of
communication among nodes to maximalize the rate
of convergence of average consensus. The failtures
that can appear in wireless communication among
nodes are taken into account. The network is
modelled as a Bernoulli random topology. It is
shown that the topology design with random link
failtures, link communications costs and
communication constraint is a convex optimization
problem that can be solved by semidefinite
programming techniques.
The articles about distribution algorithms,
implementation of graphs in the wireless sensor
networks or application of wireless sensor networks
can be found. Only a few studies implement
SENSORNETS2014-DoctoralConsortium
6

distribution algorithms to the distribution process.
The sensor nodes are in the most cases distributed
randomly in the selected area. Nobody tried to
include terrain characteristics in the distribution
process.
6 METHODOLOGY
The suggested methodology for the distribution of
wireless sensor nodes in the area of interest is graph
theory because the wireless sensor network
communication can be easily described by graph.
Nodes of wireless sensor network are represented by
nodes in graph and communication paths are
depicted with edges.
6.1 Graph Theory in Wireless Sensor
Networks
Graph theory is very commonly used in wireless
sensor networks for solving problems with
communication paths among nodes. The usage of
graph theory in wireless sensor networks can
decrease energy consumption and increase the
effectiveness of the system. Following graphs are
considered to be localized structures for topology
construction and they are used in wireless sensor
networks:
Unit Disk Graph,
Minimum Spanning Tree, Localized Spanning
Tree
Gabriel Graph,
Yao Graph,
Relative Neighbourhood Graph,
Delaunay Triangulation (this triangulation is a
basis for Thiesson Polygons) (Stojmenović,
2005).
6.1.1 Unit Disk Graph
The wireless sensor network is consisted of known
number of sensors and known communication
distance which is the same for all nodes. It is
possible to determine the broadcast area for all the
nodes and to determine the nodes which
communicate with each other. If the position of
nodes is unknown it is necessary to select possible
localities of their occurrence. Nodes which
communicate with each other are neighbours
(Stojmenović, 2005). This graph enables to suppress
the communication range and reduce the energy
consumption. If the position of nodes is known it is
necessary to choose the unit which will be the same
for all nodes. This unit is either communication
range or average count of nodes for one node. Figure
1 shows the spatial distribution of nodes in the Unit
Disk Graph without the basemap and with the
basemap which gives the spatial base to the sensor
nodes distribution. The unit is the communication
range.
Figure 1: Unit graph for 8 nodes.
This type of graph can be used only with limits
in the distribution process of sensor nodes in the
urban environment. The highest attention is paid to
the communication range. This graph solves from
the above mentioned factors all technical ones.
Terrain factors can be expressed indirectly by using
weight values but the weights can be primarily used
only for one factor and not for all of them. The
average weight for all factors could be determined.
The property conditions, type of landcover and
security can be easily expressed manually.
6.1.2 Minimum Spanning Tree and
Localized Tree
Minimum spanning tree is a subgraph of Unit Disk
Graph which is continuous, contains all nodes and
the sum of all lengths in graph is minimal. This
graph is edge-weight depend (Stojmenović, 2005).
Minimum spanning tree can be localized – it means
that every node collects positions of its single-hop
neighbours.
This type of graph can be used for observing the
length of edges and their weight evaluations which
determine edge preferences. Obstacles can be
displayed by edge preferences. This type of graph
can not primarily include types of landcover,
security and property conditions. The localized type
of this graph is more appropriate for analyzes of
spatial distribution because the positions of nodes in
the graph are known as well as the count of node
neighbours.
6.1.3 Gabriel Graph
Edge e is in the Gabriel Graph if and only if the
SpatialDistributionofWirelessSensorNodesintheUrbanEnvironment
7

circle with edge e as the diameter contains no other
node inside it. The Gabriel graph partitions the graph
into faces that are bound by polygons and make up
the edges of the graph (Matula, 2010, Stojmenović,
2003).
The fulfilment (green, smaller one) and non-
fulfilment (red, bigger one) of the Gabriel condition
is shown on the left side of Figure 2. The example of
distribution of nodes which fulfils the Gabriel
condition is shown on the right side of Figure 2.
Figure 2: Communication possibilities in Gabriel Graph.
This type of graph is used for detection of
distances where the nodes will be situated. No third
node can be situated between them and disturb their
communication. This communication is carried out
among neighbours so that the communication range
is as short as possible. All above-mentioned
technical factors can be described by this type of
graph. Terrain factors like obstacles can be
expressed by weight values but the Gabriel condition
has to be fulfilled. Different types of landcover,
property conditions and security can be situated in
the communication range but these factors are not
directly expressed in this type of graph.
6.1.4 Yao Graph
The basic thought of Yao graph is the segmentation
of the space into the sectors which have the same
angle size. Every node communicates with the
nearest node in every sector (Scheideler, 2004).
Figure 3 shows the communication among nodes in
quadrates.
This graph is used in oriented applications such
as in the case when the azimuths are known. All
technical factors can be solved in this type of graph.
Communication range is determined by the distance
of nodes in the sectors. This distance is not the same
for all sectors. Battery life can be increased because
the node communicates only with the nearest node
in every sector. The number of neighbours of one
node is influenced by the number of quadrants.
Terrain factors like obstacles could be described by
weights but in some cases the basic principal of this
type of graph could be broken. Factors like security,
property conditions and landcover can not be
involved in the calculations in this type of graph.
Figure 3: Communication in Yao Graph.
6.1.5 Relative Neighbourhood Graph
Edge is involved in the graph only in case that it is
not the longest edge in the uvw triangle. If the suture
of two nodes is situated in the middle of two nodes,
then no other node must be situated in the
intersection of circles (Stojmenović, 2005). Graph
which can be called Relative Neighbourhood Graph
is shown in Figure 4. It fulfils the demand on the
nearest nodes connection in all its nodes.
Figure 4: Relative Neighbourhood Graph for 8 nodes.
This type of graph deals with the problem of
communication distance - the nearest node is
scouted out. All technical factors can be complied in
this type of graph. It will be complicated to include
terrain factors to this graph because assigning
weights to edges could lead to the contravention of
the rules.
6.1.6 Delaunay Triangulation
Delaunay Triangulation is commonly used method
for the representation of surface characteristics. The
aim of this method is to create triangles which are as
SENSORNETS2014-DoctoralConsortium
8
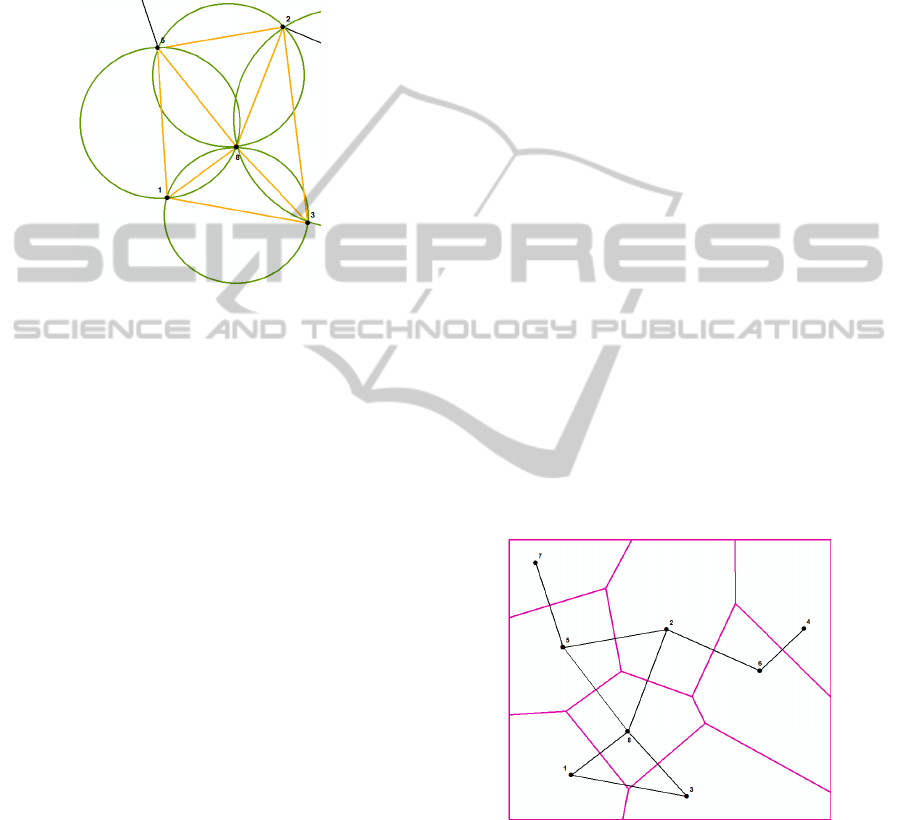
equilateral as possible. The circumscribing circle to
every triangle must not contain any other node
except for the vertices of the triangle (Stojmenović,
2005). Figure 5 shows the communication among 5
selected nodes. This communication is displayed in
orange colour. All requirements for Delaunay
Triangulation are fulfilled in this case.
Figure 5: Delaunay Triangulation for 8 nodes.
Delaunay Triangulation can be used for
distribution of sensor nodes in wireless sensor
networks but in the case of its usage it is important
to take into account that the energy consumption is
higher because the communication has to be
performed in triangles so that every node
communicates with at least three other nodes. All
technical factors can be expressed with this method.
Terrain factors may be marginally included in the
calculation.
Delaunay Triangulation is connected to the
Thiesson Polygons Method. This method determines
the catchment area of the node. Figure 6 shows the
catchment area of every node in the wireless sensor
network.
7 EXPECTED OUTCOME
The expected outcome of this paper is only one
objective of dissertation thesis which is aimed at the
distribution and following monitoring of air
pollution in the city of Olomouc.
The outcome of this particular objective is aimed
at the suggestion of technical and terrain factors that
influence the distribution of sensor nodes in the
urban environment. The selection of the most
suitable graph for including terrain characteristics in
the distribution process is necessary. These
characteristics should be added to the existing
methods and suggest one compact method or
algorithm that will have universal usage for
distribution of sensor nodes in the urban
environment.
8 CONCLUSIONS
Factors that influence the spatial distribution of
wireless sensor nodes in the urban environment were
suggested in this paper. These factors were divided
into two groups – technical and terrain. Terrain
factors included parameters of measured elements.
Graphs are usually used as a basis of distribution
algorithms. Seven types of graphs are commonly
used in the wireless sensor networks. The technical
factors are included in the majority of graphs but the
terrain factors have to be implemented to them. It is
not possible to implement terrain factors in all types
of graphs because of the basic rule for graph
construction would be broken. The most suitable
graph for the implementing of terrain factors was
analyzed as the Unit Disk Graph.
The future work is aimed at the usage of the
selected graph in the practical part of work. Firstly,
the way how to implement the terrain factors to the
selected graph will be practically certified. The
suggested method will be verified in the real task
which deals with the distribution of sensor nodes for
monitoring of air pollutants in the urban
environment.
Figure 6: Catchment area of 8 nodes.
9 DISCUSSION
There are a lot of factors that influence the
distribution of sensor nodes. The major factors that
influence the distribution sensor nodes depend on
the technical and software equipment of sensor
nodes. This paper suggests technical and terrain
SpatialDistributionofWirelessSensorNodesintheUrbanEnvironment
9

factors that should be included in the distribution of
sensor nodes in the urban environment. Are these
factors enough for the effective distribution of
sensor nodes in the urban environment or are there
other significant influences? Some factors can be
more important than the others in the different types
of application. Should the suggested factors be
evaluated by weights? The graph theory is a way
how to express the communication in the wireless
sensor network. Seven types of graphs are usually
used in the wireless sensor networks. Would it be
possible to use some other type of graph that is not
primarily used in the wireless sensor networks or
suggest the new one? The graph theory is not the
only method that can solve the problem of
distribution of wireless sensor nodes in the urban
environment. There are other methods like chaos
theory that can be used for the distribution of sensor
nodes. Would this theory be more appropriate for
implementing terrain characteristics in the
calculation? The problem of implementing terrain
factors into the distribution methods is crucial in the
case that the sensor nodes are situated in the urban
environment. The solution of this problem would
make the distribution of sensor nodes more efficient.
REFERENCES
Baranidharan B., Santhi B., 2012. EEGTP: Energy
Efficient Graph Theory Protocol for Wireless Sensor
Networks. Information Technology Journal, 11, 808-
811.
Kawahigashi, H., 2005. Modeling Ad hoc Sensor
Networks using Random Graph Theory. IEEE . Japan.
http://jan.newmarch.name/conferences/ccnc05/DATA/
1-N02-04.PDF
Mizera, J., 2011. Využití senzorových bezdrátových sítí
pro monitorování životního prostředí. Brno. Bachelor
Thesis. VUT Brno. http://www.vutbr.cz/www_base/za
v_prace_soubor_verejne.php?file_id=42512.
Sarioz, D., 2012. Geometric graph theory and wireless
sensor networks. Dissertation thesis. University of
New York, New York, USA. http://gradworks.umi.co
m/3499283.pdf.
Ding, L., Guan Z., H., 2008. Modeling wireless sensor
networks using random graph theory. Physica,
vol. 1. http://www.researchgate.net/publication/22892
7499_Modeling_wireless_sensor_networks_using_ran
dom_graph_theory
Jorio, A., Elfkihi, S., Elbhiri, B., Aboutajdine, D., 2013. A
new clustering algorithm in WSN based on spectral
clustering and residual energy. Maroko
http://www.thinkmind.org/index.php?view=article&art
icleid=sensorcomm_2013_5_10_10186
Yan, X., Xi, J., Chicharo, Y., U., Y., 2008. An energy-
aware multilevel clustering algorithm for wireless
sensor networks. International Conference on
Intelligent Sensors, Sensor Networks and Information
Processing. Sydney, Australia.
Silva, A., Reynes, B., Debbah, M., 2009. Congestion in
Randomly Deployed Wireless Ad-Hoc and Sensor
Networks. Proc. Of International Conference on Ultra
Modern Telecommunications, St. Petersburg, Russia,
October 12-14.
Lu, G., Sadagopan, N., Krishnamachari, B., Goel, A.,
2005. Delay Efficient Sleep Scheduling in Wireless
Sensor Networks. USA. http://anrg.usc.edu/www/pape
rs/LuSadagopanKrishnamachariGoel_Infocom05.pdf
Haghpanahi, M., Kalantari, M., Shayman, M., 2012.
Topology control in large-scale wireless sensor
networks: Between information source and sink. Ad
Hoc Networks, vol. 11. http://www.sciencedirect.com/
science/article/pii/S1570870512002120#
Kar, S., Moura J., M., F., 2008. Sensor Networks With
Random Links: Topology Design for Distributed
Consensus. IEEE TRANSACTIONS ON SIGNAL
PROCESSING , vol. 56. http://users.ece.cmu.edu/~mo
ura/papers/t-sp-jul08-karmoura-ieeexplore.pdf
Stojmenović, I., 2005. Handbook of sensor networks:
algorithms and architectures. Hoboken, NJ: Wiley.
ISBN 0471684724.
Matula, D., V., Sokal, R., R., 2010. Properties of Gabriel
Graphs Relevant to Geographic Variation Research
and the Clustering of Points in the Plane. Geographical
Analysis. vol. 12. http://onlinelibrary.wiley.com/doi/1
0.1111/j.1538-4632.1980.tb00031.x/pdf
Scheideler, Ch., 2004. Overlay Networks for Wireless
Systems. In: Theory of Network Communication.
http://www.cs.jhu.edu/~scheideler/courses/600.348_F
04/lecture_13.pdf
SENSORNETS2014-DoctoralConsortium
10
