
Neuro-fuzzy Indirect Blood Pressure Estimation during Bruce
Stress Test
Soheil Mottaghi
1,2
, Mohammad Hassan Moradi
4
, Mahmoud Moghavvemi
1,2,5
,
Leyla Roohisefat
3
and Eshwar C. V. Sagar
1,2
1
Department of Electrical Engineering, University of Malaya, KL, 50603, Kuala Lumpur, Malaysia
2
Center of Research in Applied Electronics, University of Malaya, KL, 50603, Kuala Lumpur, Malaysia
3
Biomedical Department, University of Malaya, KL, 50603, Kuala Lumpur, Malaysia
4
Biomedical Department, Amirkabir University of Technology, Tehran, Iran
5
Faculty of Electrical and computer Engineering, University of Tehran, Tehran Iran
Keywords: Blood Pressure, Bruce Protocol, Cuffless, Eelectrocardiography, Exercise, Heart Rate, Pulse Arrival Time,
Pulse Pletysmography, Neuro-fuzzy, Stress Test.
Abstract: An accurate blood pressure monitoring method during the course of an exercise stress test is paramount.
This is due to the fact that the patients are under intense physical pressure, and most of the time, are usually
afflicted with cardiovascular problems. Exercise or intense physical activities elevates blood pressures,
which renders cuff-based measuring systems highly inaccurate, but convenient for lesser artifacts. Much
research has been conducted on The Pulse Arrival Time (PAT), and it was concluded that it is inexplicably
linked to blood pressure. In this study, we propose a novel approach using a neuro-fuzzy system (Fuzzy
Type I) and Adaptive neuro-fuzzy inference system (ANFIS)for cuffless blood pressure estimation before,
during, and after the stress test. Systolic BP and diastolic BP estimation were carried out in this study as
well. There are no significant advantages in having lower error rate and/or higher correlation coefficients
between the fuzzy systems. However it has been shown that the results of the non-linear fuzzy estimators
possess higher correlation and lower errors than the Least Squared regression introduced in previous studies.
1 INTRODUCTION
The measurement of blood pressure are indicative of
some of the mostimportant vital signs and state of
health of different parts of the human body,such as
the heart and kidneys. Usually, the first thing a
doctor would check if a patient complains of pain in
their left hands right after a physical activity or
sudden dizziness that leads to a blackoutis the
patient’s blood pressure. The amount of force
applied to the internal walls of the arteries relyon
different factors,such as the heart rate, stiffness of
the vessels, vessels’ diameters.
An automatic non-invasive blood pressure
measurement, especially during exercise stress test,
is salient (Pickering, 2005
). Generally, most of the
systems that automatically measures blood pressure
utilize the oscillometric method (Baker, 1997
).
However, non-invasive methods of monitoring and
measuring blood pressure such as Korotkoff sounds
(Pickering, 2005
), or oscillometry (Baker, 1997), is
regarded as inaccurate at best, due to the integration
of numerous error and artefacts. Studies have proven
that motion artefact constitutes one of the major
problems in this context.
Many problems in cardiovascular systems may
not be obvious via normal medical check-ups. Some
of these problems manifests during physical
activities,such asclimbing stairs, walking fast or
running, or anyactivity that increases the heart rate.
In these cases, the heart and other organs require an
elevated volume of blood, and if any arteries are
problematic, the patient will experience an intense
amount of pain. In this situation, before any invasive
diagnosis or medical treatment activities such as
angiography is attempted, doctors will usually
require patients to undergo a Medical exercise stress
test.
Monitoring medical parameters of the patient
plays a critical role the medical decision making
process. One of the most common tests for
determining medical parameters is the treadmill test,
with Bruce protocol. During this test, a 12-lead ECG
and blood pressure needs to be monitored in order to
257
Mottaghi S., Hassan Moradi M., Moghavvemi M., Roohisefat L. and C. V. Sagar E..
Neuro-fuzzy Indirect Blood Pressure Estimation during Bruce Stress Test.
DOI: 10.5220/0004862402570263
In Proceedings of the International Conference on Bio-inspired Systems and Signal Processing (BIOSIGNALS-2014), pages 257-263
ISBN: 978-989-758-011-6
Copyright
c
2014 SCITEPRESS (Science and Technology Publications, Lda.)

check for the occurrence of any problem in
thecoronary or peripheral arteries.
Direct blood pressure measurement is almost
impossible during exercise, due to body artefacts
that might generate noises and disturbances to the
extent that the measurement becomes inaccurate or
unacceptable. It should also be noted that cuff-based
measurement during exercises can be painful, due to
the increase of blood pressure. The Pulse Arrival
Time (PAT) measurement is capable of generating
different information regarding a cardiovascular
system (Poon, 2005). Exercise affects the properties
of cardiovascular and blood, so the viscosity of BP
(Naka, 2003
), diameters of arterial and vessels
(Kingwell, 1997
) and the flexibility of vessels
increases (Zhang, 2007). Indirect BP estimation
using the PAT-approach is cuffless; disadvantages
of the auscultatory and oscillometric methods will be
virtually nonexistent. Furthermore, these
techniquescause a lot of discomfort, pain, and
restrict the mobility of the patients.
PAT is the time interval between the R-peak of
an electrocardiogram (ECG), and a reference point
in a pulse pressure signal in the same cardiac cycle.
The R-peak is used as a reference to demonstrate the
ventricular depolarization. Generally,the pressure
pulse is detected by an optoelectronic set. Photo
Pletysmogram (PPG) or the Pulse Oximetery are the
two common names of devices used for the purpose
of blood pressure pulse signal recording.
PAT is made up of two main components: the
pre-ejection period (PEP) and the vascular transit
time (TT). PEP is defined as the time interval from
theinitial contractions in left ventricular until the
blood is ejected from the heart. It is also classified
asan electro-mechanical delay,while TT is the
duration for blood pulse pressure to propagate via a
segment of arteries. It has been tested and confirmed
that PAT has higher correlations with blood
pressure, rather than only TT, during and after
exercises (Wong, 2011
).
Artificial intelligence such as fuzzy systems and
neural network (NN) is capable of providing a
solution for indirect blood pressure measurement.
An advantage of this method is that they perceive
the system as a black box, and do not require a
mathematical model for estimation. Non-linear in-
out mapping, adaptivity and flexibility (Forouzanfar,
2011
). (Jia-Jung, 2002) proposed a developed model
of Fuzzy logic controller in a non-invasive and
continuous BP in radial arteries. Classification of BP
into different groups such as high, normal and low
has been done in (Colak, 2003
). Using a hybrid
neuro-fuzzy technique, a novel method has been
proposedfor blood pressure estimation by
oscillometric (Forouzanfar, 2011
).
The main goal of this study is to investigate the
cufflessblood pressure estimations before,
during,and after a medical stress test.The correlation
between BP and parameters such as the Heart rate
and PAT will be carried out. Our previous study
indicated that Systolic BP (SBP) and Diastolic BP
(DBP) estimation during the five stages of stress test
is acceptable, based on least-squares regression on
the data derived from 55 subjects (Colak, 2003
).
In this paper, BP estimation, utilizing LS
regression, is retested for 87 healthy subjects. Then,
by using more intelligent methods, we are going to
demonstrate the fact that the accuracy and
correlation of the estimation significantly increases.
This technique will greatly augment our ability to
monitor BP during the medical stress test, and
prevent sudden deathsduring the test.
2 METHODOLOGY
Many research groups conducted research on
indirect and cuffless blood pressure measurements.
The Moens-Kortwege model, experimental
procedures, and dynamics of blood pressure during
the exercise stress test are discussed in this section.
2.1 Corrected Moens-Kortwege Model
The Moens-Kortwege equation describes the
relationship between blood pressure and Pulse Wave
Velocity (PWV). A corrected version of the Moens-
Kortwege equation is presented. When the heart
contracts, the blood pressure wave speed is given by:
1
/2
(1)
where E is elasticity modulus of vessel wall, h is
wall thickness, is density of blood and r is the
vessels radius and is known as Poisson’s ratio,
which is the ratio of transverse to longitudinal strain
(Shahsavari, 2011). Parameters in the equations are
subject-dependent, which means that self-calibration
is necessary.
The linear relationship between PAT and PAT-
HR during the stress test has been investigated, and
for the purpose of calibration, a new method has
been proposed (Colak, 2003
).
2.2 Experimental Procedure
This study was performed on 87 subjects, (52 male),
BIOSIGNALS2014-InternationalConferenceonBio-inspiredSystemsandSignalProcessing
258

Figure 1: Spectrum of the subjects’ ages participated in the
experiment.
aged between 21 and 57 years (mean 31 years, SD
10). The age spectrum of the subject that
participated in this experiment is illustrated in Fig.1.
The subjects were healthy, 39 of them were non-
smokers,and none of them had been diagnosed with
any cardiovascular diseases. The standard ECG was
measured with Ag/AgCl electrodes in lead II
Mayson-Likar configuration (Man, 2007
).
In this experiment, the ECG (lead II),
Photopletysmograph signal were simultaneously
collected at different stages. ECG and PPG were
measured by ADInstrument acquisition system
(PowerLab/8SP) at 1KHz sampling rates,while
blood pressure was measured using Bionet Holter
(Model:BM1), with BP modules of SUNTECH
company. Stress tests were conducted using a
treadmill (Model: 870A, Ram, Italy), and theblood
pressure was measured on the subjects’ left arm.
The protocol of the experiment consist of resting
before the test, walking, running slowly, and running
fast, and resting after the test. Subjects were asked
not to eat (three hours)or drink (one hour)prior to the
test. They were sitting for about 5-10 minutes in
order to relax before the test, and their ECG, PPG,
HR wascontinuously being recorded, and their BP
were measured once before and after this stage.
Then, the subjects are instructed to begin walking
and running. The speed and the incline of the
treadmill were increased in accordance with the
Bruce Protocol. ECG, PPG and HR were
continuously measured, while the BP wasmeasured
every three minutes. Depending on the abilities and
the age of the subjects, they continued with the test
until one of the following signs was detected by the
clinical staff:
a.
210
∗0.85
b. Any abnormal increase or decrease in BP
c. Unusual arrhythmia in ECG
d. Dizziness, headache or nausea
e. Muscle cramps
f. Clinical staff decides not to continue the
test.
Right after completing the tests, the BP is
measured. The subject would then be allowed to
rest. ECG, PPG and HR were still monitored during
rest, due to the subjects’ health. The BP was
measured once after one minute of rest, and once
after five minutes; this is done to establish arecovery
trend. If the vital signs of the subject reverted to
normal, the test is completed;however, they are still
required to remain within the premises for an
additional half hour for safety purposes.
2.3 Dynamics of Blood Pressure
When a subject walks on a treadmill, their HR
increases, but the stiffness and diameter of the
arteries remains unchanged, while the BP increases.
Depending on the physiological parameters of each
person, and the forces exerted by BP against the
walls of the arteries, when this force reaches a
threshold, the brain alters the stiffness and the
diameters of the arteries, which decreases the BP.
Again, by starting from walking to running, this
cycle is repeated. So, in normal people, fluctuations
in BP should be detected during the test.
Increasing BP without fluctuation might enable
us to detect potential kidney problems. Any drastic
or sudden drop in BP, provided the subject is not
overweight or obese, may be indicative of vessels’
rupture. This is one of the reasons that it is
absolutely imperative that BP is constantly
monitored during stress tests, as constant monitoring
will allow us to avoid injuries during these tests.
3 SIGNAL PROCESSING
ECG and PPG are sampled at a 1 KHz frequency.
Signals are filtered by a zero-phase band pass filter,
with cut-off frequencies of 1- 80 Hz, and also with a
notch filter of 50 Hz for removing power line
effects.
3.1 Fuzzy Estimator
Previous work has shown that BP has an inherent
relationship with both HR and PAT (Mottaghi,
Neuro-fuzzyIndirectBloodPressureEstimationduringBruceStressTest
259

2012). Self-calibration is required in conjunction
with this method. PAT changes with time, and also
differs with age and physiological parameters. For
the calibration in this experiment at rest, BP is
measured once at first, as a set point. Then, the
estimated blood pressure from the previous stage
was taken as the set point for the current stage, as
shown below:
,
,
(2)
2,
,
,
1,
,
,
is the estimated blood pressure of the previous
stage.
3.2 Fuzzy Clustering
Clustering is a tool for discovering structures or
patterns in a data set, where the objects inside each
cluster are similar to other members on a degree of
similarity. Hard clustering systems allows each
object to be a member of only one cluster,but in
fuzzy clustering, each object can be a member of
different clusters, with different membership degrees
(Bezdek, 1987). Fuzzy C-means was used as a
clustering tool in this experiment.The FCM attempts
to divide any given data set and sort them into a C
fuzzy clusters with respect to certain criterion.
In FCM, each point has a degree of membership
to clusters. Thus, certain points on the edge of
clusters have lower membership degrees compared
to points that are closer to the centre of cluster.
There is an overview and comparison of different
fuzzy clustering algorithms in (Setnes, 2000). The
algorithm tries to minimize the objective function of:
,
1
∑
‖
‖
(3)
which C is the cluster centre, x data and w is the
membership values. The procedure of clustering is
as below:
a. Initializing W=[
] matrix
b. At
-step: calculation the centres vectors
C=[
] by:
∑
∑
(4)
c. Updating W(k), W(k+1) by equation (3).
d. If
‖
1
‖
then
procedure is stopped; otherwise return to
step b.
This clustering was implemented on all three
inputs (PAT, HR and
) on each stages of
training data. The number of clusters in each input is
selected as five,possessing Gaussian membership
functions. Fig.2 and Fig.3 illustrate this clustering
output for inputs and outputs of the training data of
stage 3.
3.3 Neuro - Fuzzy Systems
Fuzzy logic is widely used in controlling and
estimations. The input variables in a fuzzy system
are generally mapped by sets of membership
functions known as Fuzzy Sets. This process is call
fuzzification. Designing of a fuzzy system consists
of three steps:
a. Picking the nouns or input/output variables.
b. Defining fuzzy subsets of the nouns inputs
and outputs.
c. Picking the fuzzy rules by associating
output to the inputs.
The last stage means that after clustering, the
input-output clusters are determined. Figures 6 and 7
show the membership functions of the input-output
space post fuzzy clustering.
For example, the rules generated for Fig.2 and Fig.3
are:
- If the HR is lowest (Green), Gaussian MF
and PAT is the highest (Green), MF and
is medium MF (Green), while
is
the centre of lowest MF (Green).
- If the HR is medium (Red), Gaussian MF and
PAT is the medium (Red),MF and
is
the medium MF(Red),while
is the
highest MF(Red).
- If the HR is highest (Blue), Gaussian MF and
PAT is the lowest MF (Blue), and
is
the highest MF(Blue), which makes
the
medium MF(Blue).
By combining artificial neural networks and
fuzzy logic, a human-like reasoning style was
proposed (Setnes, 2000). This method has been used
as a system identifier in different applications (
Wang,
1992), (Narendra, 1990).
3.4 Adaptive Neuro-fuzzy Inference
System (ANFIS)
ANFIS architecture and training methods is
presented here. ANFIS is a fuzzy inference system
that utilizes a hybrid learning procedure to map
input-output pairs based on human knowledge (Jang,
1993). The structure of selected system is provided
BIOSIGNALS2014-InternationalConferenceonBio-inspiredSystemsandSignalProcessing
260
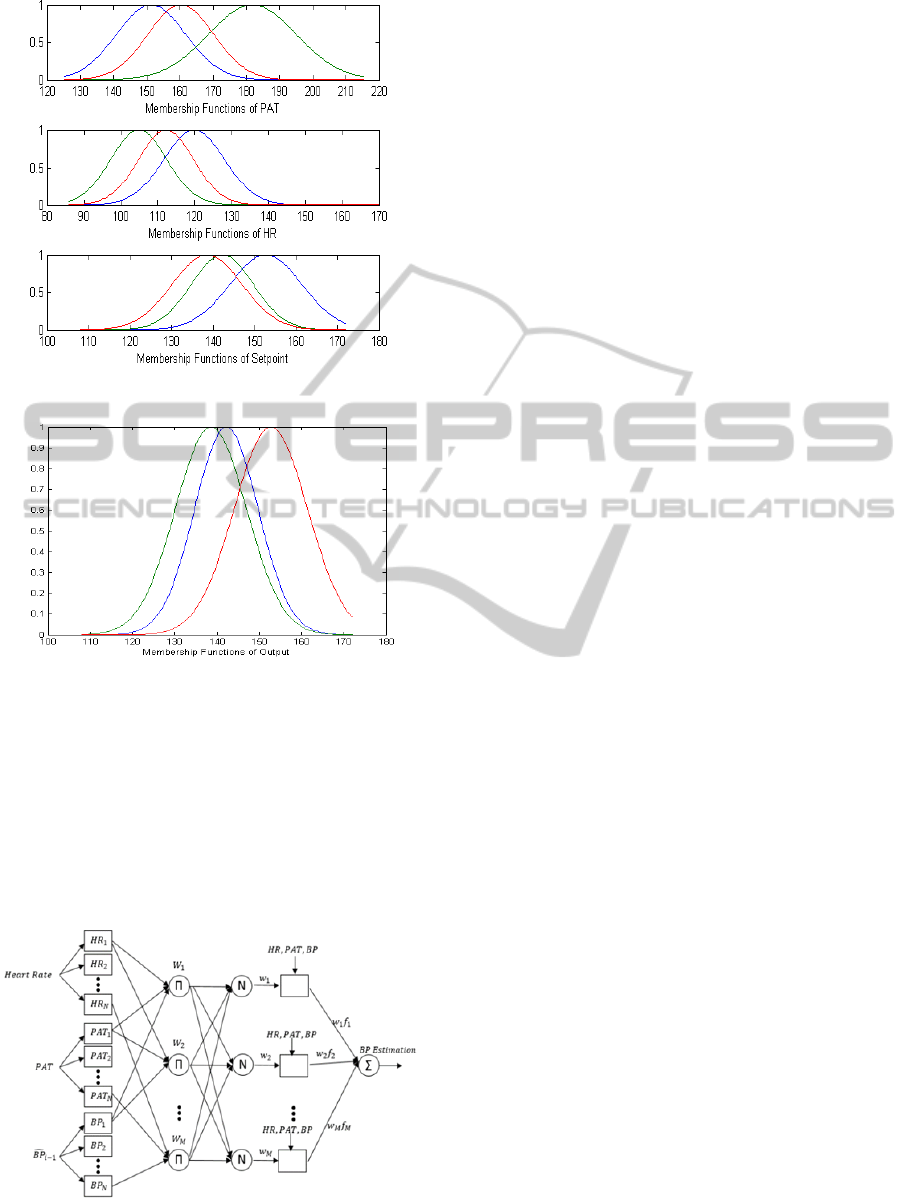
Figure 2: Membership functions of inputs after clustering.
Figure 3: Membership functions of output after clustering.
in Fig.4. The membership functions were provided
by the clustering part were used in this method as
well.
First-order Sugeno model was used as follow:
∗∗∗
(5)
where HR, BP and
are inputs of the fuzzy
system. a, b, c and d are parameters of the related
inputs and f is the output of the rule.
Figure 4: Architecture of Adaptive NeuroFuzzy Inference
System.
Like the neuro-fuzzy method, backpropagation
gradient descent has been used as backward training
methods. Methods for choosing training and testing
data was also similar to the neuro-fuzzy ones.
4 RESULTS
In this section, the quality of the designed system is
discussed. Correlations and Errors for both SBP and
DBP are shown.
4.1 Data Set
Our blood pressure data was acquired every three
minutes at the end of each stage. The data set
consisted of 87 subjects; 50 males and 37 females,
aged 22-60. Six set of blood pressure were acquired
per person during the tests, resulting in the total of
522 measurements. Measurements were at the level
of the arm, done by a nurse. The ranges of the
recorded data for SBP and DBP were 69-170 and
53-100 mmHg, respectively.
Table 1 comparison between the standard
deviations for each stage in systolic blood pressure
estimation is shown in Fig. 5. The comparison of
RMSE between the neuro-fuzzy, ANFIS and LS
regression is shown in Fig.6 as well.
4.2 Train and Test Strategy
Designing a fuzzy system that is capable of
estimating blood pressure during the exercise stress
test is quite a challenge. The system should follow
the dynamics of the heart rate, arteries’ stiffness, and
diameter changes for it to accurately measure BP.
The system should not be over-trained. Stopping the
training procedure before overfitting is proposed in
(
Sarle, 1995)
, and is duly adopted in this work. The
data are divided into three categories, which are the
training, validation and testing of the data.
Training data should be gathered as much as
possible, while validating data should encompass all
points of training data.
A cross validation method has been used in this
study. 77 subjects were selected randomly for
training and testing, and the rest of 10 subjects used
for validation. This process has been repeated 10
times and the averaged, minimum and maximum
were reported.
Neuro-fuzzyIndirectBloodPressureEstimationduringBruceStressTest
261
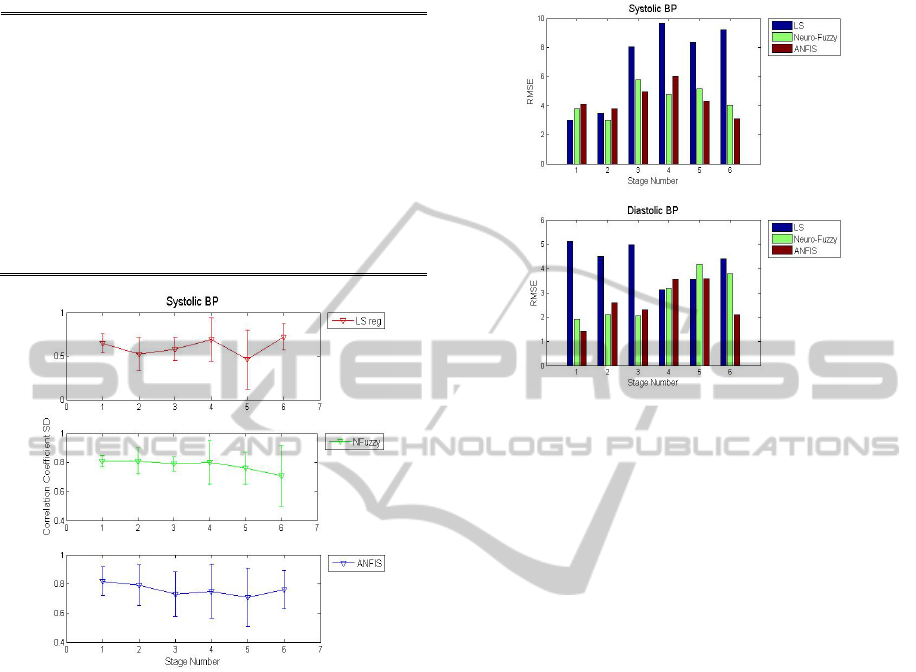
Table 1: Comparison Between Averages of
CORRELATIONS COEFFICIENTS for SBP and DBP of
LS - NF - ANFIS.
Stage
No.
LS NF ANFIS
SBP DBP SBP DBP SBP DBP
Rest 0.645 0.485 0.81 0.89 0.82 0.87
stage1 0.52 0.499 0.81 0.86 0.79 0.88
stage2 0.581 0.492 0.79 0.84 0.73 0.81
stage3 0.69 0.522 0.8 0.79 0.75 0.84
Rest
1min
0.46 0.561 0.76 0.77 0.71 0.80
Rest
5min
0.72 0.41 0.71 0.78 0.76 0.80
Figure 5: Mean and SD of RMSE for SBP and DBP
compared between neuro-fuzzy, ANFIS systems and LS
regression.
5 CONCLUSIONS
An accurate blood pressure monitoring method
during the course of an exercise stress test is
proposed in this paper. The system utilizes an
indirect cuffless blood pressure estimation technique
and using two fuzzy estimators for SBP and DBP
estimation during and after exercise stress test.
Clustering the inputs-outputs pairs, and finding
the membership functions and distribution of in-out
sets are done by fuzzy C-means clustering
algorithm. By obtaining an average coefficient
higher than 0.71 and 0.77 for SBP and DBP,
respectively, it is shown that not only fuzzy
estimators has more potential to learn dynamics of
the cardiovascular systems during and after the
exercise stress test, but also they could estimate DBP
at levels that are better and more reliable than
previous studies.
Figure 6: Mean of RMSE for SBP and DBP compared
between neuro-fuzzy, ANFIS and LS regression.
The method for the calibration of the system
utilized once for BP measurement before starting the
test and using the estimated ones for next stages is a
new method developed by this research group. It has
been shown that after an average of 45 minutes, the
correlation drops to lower than 0.65, and requires
recalibration. This study is viable for use in studies
that has higher number of subjects in different age
groups, race and backgrounds to find more accurate
models for each ones.
ACKNOWLEDGEMENTS
The authors would like to thank biomedical
department of Amirkabir University of Technology
(Tehran-Polytechnic), ArkanAra Company,
University of Malaya and Resquake robotics group
for their support of this study.
REFERENCES
Pickering, T., et al, 2005. "Recommendations for blood
pressure measurement in humans and experimental
animals–part 1: Blood pressure measurement in
humans," Hypertension, vol. 45, p. 14261.
Baker, P., Westenskow, D., and Kück, K., 1997.
"Theoretical analysis of non-invasive oscillometric
maximum amplitude algorithm for estimating mean
BIOSIGNALS2014-InternationalConferenceonBio-inspiredSystemsandSignalProcessing
262

blood pressure," Medical and Biological Engineering
and Computing, vol. 35, pp. 271-278.
Poon, C., Zhang, Y., 2005. "Cuff-less and Noninvasive
Measurements of Arterial Blood Pressure by Pulse
Transit Time," 27th Annual International Conference
of the Engineering in Medicine and Biology Society,
Chinease University, HK, pp. 5877-5880.
Naka, K et. al, 2003. "Arterial distensibility: acute changes
following dynamic exercise in normal subjects,"
American Journal of Physiology - Heart and
Circulatory Physiology, vol. 284, pp. H970-H978.
Kingwell, B., et al., 1997. "Arterial compliance increases
after moderate-intensity cycling," American Journal of
Physiology - Heart and Circulatory Physiology, vol.
273, pp. H2186-H2191.
Zhang, W., et al., 2007. "Viscoelasticity reduces the
dynamic stresses and strains in the vessel wall:
implications for vessel fatigue," American Journal of
Physiology - Heart and Circulatory Physiology, vol.
293, pp. H2355-H2360.
Wong, M., et al., 2011. "The effects of pre-ejection period
on post-exercise systolic blood pressure estimation
using the pulse arrival time technique," European
Journal of Applied Physiology, vol. 111, pp. 135-144.
Forouzanfar, M., et al., 2011. "Feature-Based Neural
Network Approach for Oscillometric Blood Pressure
Estimation," Instrumentation and Measurement, IEEE
Transactions on, vol.60, no.8, pp.2786-2796.
Jia-Jung, W., et al., 2002. "Model-based synthetic fuzzy
logic controller for indirect blood pressure
measurement," Systems, Man, and Cybernetics, Part
B: Cybernetics, IEEE Transactions on, vol. 32, pp.
306-315.
Colak, S., 2003. "Fuzzy oscillometric blood pressure
classification," 22nd International Conference of the
North American, Fuzzy Information Processing
Society, Syracuse University, NY, pp. 208-213.
Mottaghi, S., et al., 2012. "Cuffless Blood Pressure
Estimation during Exercise Stress Test" International
Journal of Bioscience, Biochemistry and
Bioinformatics vol. 2, no. 6, pp. 395-398.
Shahsavari, S., et al., 2011. "Cerebrovascular Mechanical
Properties and Slow Waves of Intracranial Pressure in
TBI Patients," Biomedical Engineering, IEEE
Transactions on, vol. 58, pp. 2072-2082.
Man, S., et al., 2007. "Reconstruction of standard 12-Lead
ECGs from 12-lead ECGs recorded with the Mason-
Likarelectrode configuration," in Computers in
Cardiology, vol 41, pp. 701-704.
Bezdek, J., et al., 1987. "Convergence theory for fuzzy c-
means: Counterexamples and repairs," Systems, Man
and Cybernetics, IEEE Transactions on, vol. 17, pp.
873-877.
Setnes, M., 2000. "Supervised fuzzy clustering for rule
extraction," Fuzzy Systems, IEEE Transactions on,
vol. 8, pp. 416-424.
Wang, L., et al., 1992. "Back-propagation fuzzy system as
nonlinear dynamic system identifiers," IEEE
International Conference on Fuzzy Systems, Los
Angeles, CA , pp. 1409-1418.
Narendra, K., 1990. "Identification and control of
dynamical systems using neural networks," Neural
Networks, IEEE Transactions on, vol. 1, pp. 4-27.
Jang, J., 1993. "ANFIS: adaptive-network-based fuzzy
inference system," Systems, Man and Cybernetics,
IEEE Transactions on, vol. 23, pp. 665-685.
Sarle, W., 1995. “Stopped training and other remedies for
overfitting,” in Proc. 27th Symp. Interface Comput.
Sci. Statist., Pittsburgh, PA, pp. 352–360.
Neuro-fuzzyIndirectBloodPressureEstimationduringBruceStressTest
263
