
Course Recommendation from Social Data
Hana Bydžovská
1,2
and Lubomír Popelínský
2
1
CVT, Faculty of Informatics, Masaryk University, Brno, Czech Republic
2
KD Lab, Faculty of Informatics, Masaryk University, Brno, Czech Republic
Keywords: Recommender System, Social Network Analysis, Data Mining, Prediction, University Information System.
Abstract: This paper focuses on recommendations of suitable courses for students. For a successful graduation, a
student needs to obtain a minimum number of credits that depends on the field of study. Mandatory and
selective courses are usually defined. Additionally, students can enrol in any optional course. Searching for
interesting and achievable courses is time-consuming because it depends on individual specializations and
interests. The aim of this research is to inspect different techniques how to recommend students such
courses. This paper brings results of experiments with three approaches of predicting student success. The
first one is based on mining study-related data and social network analysis. The second one explores only
average grades of students. The last one aims at subgroup discovery for which prediction may be more
reliable. Based on these findings we can recommend courses that students will pass with a high accuracy.
1 INTRODUCTION
Recommender systems aim to prioritise information
about items such as movies, music, books, news,
images or web pages to users with respect to their
interests. Jannach et al. (2011) presented different
types of recommendations. The selection is based on
the knowledge of user behaviour, information about
behaviour of other users, and information about of
all items in the database.
Recommender systems can be also used in an
educational environment. Students have to pass
many courses to finish their study. Some of them are
obligatory, but optional courses have to be chosen
by students. Students try to choose the best for
them–interesting and passable courses, but it is very
difficult to find suitable ones. Searching is very
time-consuming and students have to search whole
course catalogue, to examine abstracts and syllabi, to
check success rate statistics or ask other students for
their experiences.
To help students with their duties we intend to
design a course enrolment recommender system that
assists students when selecting courses. The
recommendation is based on educational data
mining and social network analysis methods. The
recommendation is personalized for each student.
The course enrolment recommendation can be
divided into two main parts: finding interesting
courses and checking if the courses are not difficult
for students. The second part is the most important.
When a student enrols in difficult course and fail,
the student can fail a study. The student would not
use such recommender system. Previous experiment
was published in Bydžovská et al. (2013).
This paper deals with recommendation of
courses that will not be too difficult for a particular
student. The aim of the proposed method is to
predict student success or failure in selected courses.
It is important not to recommend difficult courses
for particular students and it is equally important to
advise students about mandatory courses that usually
cause problems to students. We aim at identification
of such courses by using information that the
courses were problematic for students with similar
achievements.
The paper is organized as follows. In the
following section, we present related work. In
Section 3, we introduce the proposed recommender
system. In Sections 4 and 5 we describe used data
and in Section 6 we present experiments dealing
with predictions of study success. Results can be
found in Section 7. The discussion, summary and
future work can be found in the last two sections.
2 STATE OF THE ART
A recommender systems overview used in education
268
Bydžovská H. and Popelínský L..
Course Recommendation from Social Data.
DOI: 10.5220/0004840002680275
In Proceedings of the 6th International Conference on Computer Supported Education (CSEDU-2014), pages 268-275
ISBN: 978-989-758-020-8
Copyright
c
2014 SCITEPRESS (Science and Technology Publications, Lda.)

can be found in Manouselis et al. (2011). A common
method to analyse educational data is to use
educational data mining methods (see Romero and
Ventura (2007)). It deals with the analysis of data
for understanding student behaviour. These
techniques can reveal useful information to teachers
and help them design or modify the structure of
courses. Students can also facilitate their studies
using the discovered knowledge. Nowadays,
researchers use educational data mining techniques
mostly to guide student learning efforts, develop or
refine student models, measure effects of individual
interventions or improve teaching support.
One of the most important issues often solved in
educational environment is understanding what
influences student performance. The task involves
the prediction of student's grades or student's course
difficulties. This information can identify students
with greater potential and also those that may
require timely help from teachers or peers to fare
well in the course.
Researchers usually mine from data stored in
university information systems. Mostly, they use
data such as grades, gender, field of study or age.
Thai Nghe et al. (2007) concluded that better results
were gained using decision trees than using
Bayesian networks.
Vialardi et al. (2009) aimed to select courses for
students in order to obtain good exam results.
Difficulties of courses were compared with student
potentials. Both variables were computed from
grades. The work extension can be found in Vialardi
et al. (2010) where the analysis was based on profile
similarity. The results were satisfactory but the false
positives obtained in results were too high. It is
worse to recommend a course that students enrol in
and fail than missing a course that they could pass.
The solution was to sample the data again. It
lowered the accuracy, but decreased significantly the
false positive errors.
Another common topic of mining in educational
data is the prediction of drop-out rate of students.
Dekker et al. (2009) explored the possibilities of the
assignment. The task is similar to the student's
performance analysis but we are interested in the
complex performance and in the chance to
successfully complete their studies .
Our previous work also explored drop-out
prediction (Bayer et al. (2012)). We collected useful
information about students’ studies. We applied
educational data mining methods to this data. We
then created a sociogram from the social data. We
used social network analysis methods to this data
and obtained new attributes such as centrality,
degree or popularity, etc. When we enriched the
original study-related data with these social
attributes and employed educational data mining
methods again, the accuracy of classification
increased from 82.5% to 93.7%.
Marquez-Vera et al. (2011) used questionnaires
to get some detailed information of students’ lives
directly from students because this type of data is
not present in the information system, e.g. the family
size, the smoking habits or the time spent doing
exercises. These data can improve predictions about
students failure.
In this work, we applied data mining methods to
explore the study-related data. Unlike Marquez-Vera
(2011) who was dependent on answers from a
questionnaire, we used confirmed and complete data
from the university information system. If compared
with Thai Nghe et al. (2007) we tested broader
spectrum of machine learning algorithms—bayesian,
as well as instance-based learners, decision tree and
also various rule-based learners. We further
extended the method of Vialardi et al. (2009) by
addition of social data. In this way we were able to
compare students' data together with the information
about their friends. Therefore, we could increase
prediction accuracy.
3 A RECOMMENDER SYSTEM
PROPOSAL
Students are interested in information resources and
learning tasks that would improve their skills and
knowledge. The recommender system should, hence,
monitor their duties and show them either an easy or
an interesting way to graduate.
The proposal of recommender system consists of
three parts: data extraction module that extracts data
from the Information System of Masaryk University
(IS MU) database, pre-processing and analytical part
(allows the user to select relevant features, to
compute new ones, to obtain basic statistics about
those features, and to run machine learning
algorithms) and the presentation module (selects
important knowledge and presents it to the user).
3.1 Use of the System
The proposed system will recommend mandatory
courses and associated prerequisite courses. Elective
and optional courses will be selected according to
the student's potential with respect to vacancies in
the timetable. The system will recommend
interesting, beneficial and achievable courses for
CourseRecommendationfromSocialData
269

clever students. On the other hand, for weak students
it will search for courses that can contribute
knowledge to finish mandatory and elective courses.
Passing all mandatory and elective courses
guarantees that a student deserves a university
degree. When the system finds a difficult mandatory
course for a student, it can inform him or her about
the situation and the student can pay attention to the
course and study hard. When a student needs to
select elective or optional courses for a term, the
recommender system selects interesting, but
passable courses for a particular student.
The system will eventually recommend
interesting and passable courses to students and will
propose a short explanation of its decision and
confidence. Students will have an opportunity to
assess each recommendation if recommended
courses were interesting and adequate difficult.
Based on the assessments, recommendation
algorithms will be modified to enhance the relevance
of recommendations. The recommendations will be
available for students of Masaryk University
probably from autumn 2014
.
4 SOCIAL AND STUDY-RELATED
DATA EXTRACTION
Selecting attributes that express student’s
characteristics as accurately as possible is extremely
important. Based on such data, we can give a better
prediction on the courses that are crucial or
interesting for a student. We tried to obtain such
attributes that tell us as much as possible about
students and their lives. The list of all attributes can
be found in Section 5.1.
We believe that schoolmates who become friends
have much in common. Although we cannot find it
in the data, they can have similar sense of humour,
close interests and maybe same intellect capability to
be able to spend time and enjoy together. It is so far
hypothetical, but very likely, that students with
clever friends will have better study results than
students with the same potential who do not have
such friends. To observe this, we explore social ties
among students.
4.1 Social Behaviour Features
There are a number of interpersonal ties that have
been already evaluated to enhance IS MU full text
search. Some ties are intuitive: (a) explicitly
expressed friendship, (b) mutual email conversation,
(c) publication co-authoring, (d) direct comment on
another person. Weaker ties are more hidden and are
derived from the following facts: (e) discussion
forum message marked as important, (f) whole
thread in discussion forum or blog marked as
favourite, (g) files uploaded into someone else's
depository, (h) assessments of notice board's
messages, (i) visited personal pages.
We measured the value of a tie by its importance
and weighted by a number of occurrences. As a
result we calculated a single number from all
mentioned ties reflecting the overall strength of
student's relation with any given schoolmate.
A sociogram, a diagram which maps the
structure of interpersonal relations has been created
from information about students, their direct friends
and relations among them. This allow us to compute
new student features from the network structural
characteristics and student direct neighbours
attributes using tools for social network analysis,
e.g. Pajek. These features give us a new insight into
the data. The list of computed social behaviour
attributes can be found in section 5.2.
5 DATA
We use three types of data: study-related data, social
behaviour data and data about previously passed
courses.
5.1 Study-related Data
This type of data represents student and his or her
achievements.
Personal attributes: (a) gender, (b) year of birth,
(c) year of admission, (d) capacity-to-study test
score—a result of the entrance examination
expressed as the percentage of the score measuring
learning potential—minimum of all attempts to get
at the university.
Historical attributes (include all student's
outcomes achieved before the term in which the
student attended the investigated course): (e) credits
to gain—a number of credits to gain for enrolled, but
not yet completed courses, (f) gained credits—a
number of credits gained from completed courses,
(g) a ratio of the number of gained credits to the
number of credits to gain, (h) courses not
completed—a number of courses a student has failed
to complete, (i) second resits done—a number of
used second resits (an examination taken by a
previously unsuccessful student), (j) excused
days—a number of days when a student is excused,
CSEDU2014-6thInternationalConferenceonComputerSupportedEducation
270
(k) average grades—an average grade computed
from all grades obtained, (l) weighted average
grades—average grades weighted by the number of
credits gained for courses.
Term-related attributes (information about a term
and a study in which the student enrolled in the
investigated course): (m) field of study, (n) program
of study, (o) type of study (bachelor or master), (p) a
number of terms completed, (q) a number of parallel
studies at the faculty, (r) a number of parallel studies
at the university, (s) a number of all studies at the
faculty, (t) a number of all studies at the university.
5.2 Social Behaviour Data
We computed social attributes for each student from
sociogram we described in section 4.1: (a) degree—
represents how many relations the student is
involved in, (b) weighted degree—degree with
respect to strength of the ties, (c) closeness
centrality—represents how close a student is to all
other students in the network, (d) betweenness
centrality—represents student's importance in the
network, (e) grade average of neighbours—
calculation of average grades of the nearest
neighbourhood values, (f) neighbours count in
course—how many nearest neighbours have already
enrolled in the course.
In our interpretation, the degree measures the
amount of communication of each student. The
closeness centrality measures distances needed to
get some information from a student to all other
students in the sociogram. The betweenness
centrality expresses the frequency of a student in the
information path between two different students.
5.3 Courses Passed by a Student
We added this type of data because we believed that
the knowledge of passed courses is important and
influences student performance. This type of data
contained all passed courses for each student in the
data set. We used only information about passing or
failure in these experiments, we were not interested
in exact grade because we observed that an exact
grade is not important.
5.4 Data Sets
For exploring course difficulties we chose some
courses of Masaryk University:
IB101 Introduction to Logic
IA008 Computational Logic
IB108 Algorithms and data structures II
IA101 Algorithmics for Hard Problems
MB103 Continuous models & statistics
These courses are offered mainly for students of
Applied Informatics, one of the programmes in the
Faculty of Informatics. The choice was made with
respect to importance of courses to students, how
courses relate to one another, and the lecturers for
the courses.
We generated two data sets for each of the
above-mentioned courses. We used data from the
years 2010-2012. As we aimed at predicting student
success from historical data, the years 2010 and
2011 were used for learning. A test set then
contained data about students who attended a
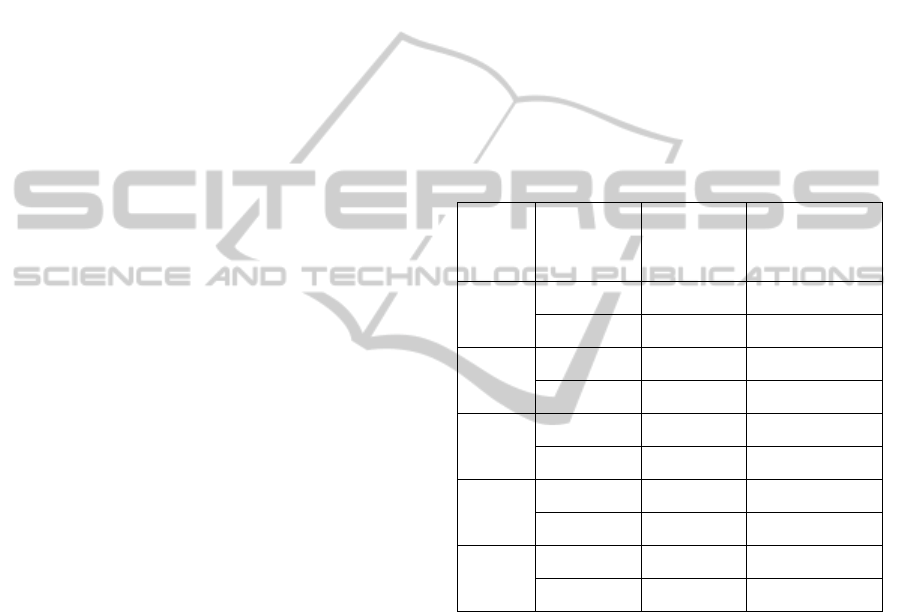
particular course in the year 2012. A number of
instances in the data sets is presented in Table 1.
Table 1: Number of instances.
Course Data sets No. of
students
No. of vertices
in sociogram
IB101 Training set 782 24829
Test set 427 16649
IA008 Training set 158 6808
Test set 73 5713
IB108 Training set 127 10652
Test set 56 6335
IA101 Training set 219 11338
Test set 113 9505
MB103 Training set 708 24018
Test set 331 14495
6 METHODS
A recommender system core is an analytical module
that exploits various machine learning algorithms
from Weka (see Witten et al., 2011). The current
version of the module contains three methods that
comprise recommendation from complete historical
data then learning based on grade averages, and also
discovery of student subgroups for which a
recommendation may be more promising. An
obtained accuracy was always compared with a
baseline, i.e. with the accuracy when all the data in a
test set were classified into a majority class.
CourseRecommendationfromSocialData
271

6.1 Mining Complete Data
The first method aims at classification of student's
ability to pass an investigated course. We tested
different machine learning algorithms—naive Bayes
(NB), Support Vector Machines (SMO), instance-
based learning (IB1), two rule learners (PART and
OneR), decision tree (J48) and two ensemble
learners (AdaBoost (AdaB) and Bagging).
Three experiments were performed that differ in
granularity of a class—prediction of an exact grade
A-F, prediction into three classes: good/bad/failure
and two-class prediction of success/failure. We used
three collections of attributes for classification: All
data (study-related attributes together with social
behaviour data), only study-related data (all study-
related data without social behaviour data), subset of
attributes (the best subset of attributes selected by
feature selection algorithms—GainRatioAttEval,
InfoGainAttributeEval and CfsSubsetEval). We also
enriched all of the collections with information
about students' previously passed courses.
6.2 Comparison of Grade Averages
The second method inspired by Vialardi et al. (2009)
was based on a comparison of average grades of a
student with average grades for the investigated
course. The designed method also considered grades
of students' friends. We computed the average grade
from training set for all courses and predicted the
study performance in the test set. The course average
grade was compared with the student's potential,
which was measured as follows: (a) average of
student grades, (b) average of all student's friends'
averages from the sociogram, (c) average of
averages of student's friends that attended the
investigated course simultaneously with the student.
If the course average grade was higher than the
student's potential, we predicted success and failure
otherwise.
6.3 Recommendations to Subgroups
For subgroup discovery (see Lavrač et al., 2002,
2006) we combined discovery of finding interesting
subsets of attribute values (by means of
discretization for continues attributes and by
building subsets of values for categorical attributes)
with two learning algorithms—decision trees (J48)
and class association rules (see Liu et al., 1998,
Witten et al., 2011).
We first computed subsets of values for each
attribute—from 5 to 10 bins in case of discretization,
and couples and triples for categorical attributes—on
the learning set. For each combination of such
attributes we then learned decision rules extracted
from decision tree (see Quinlan, 1993) and class
association rules. From all rules with coverage
higher than 5% of test set cardinality we choose
those that had precision at least 5% higher than the
best precision reached in the previous experiments.
7 RESULTS
The aim of these experiments was to recommend a
course to a student based on the analysis of historical
data. Some students rely on getting really good
grades and not only on passing successfully, which
is why we attempt to predict an exact grade and
subsequently, either recommend a course or to warn
a student not to enrol in the course. If the system
recommended a course that is hard to pass or even
non-passable for a student, the recommendations
would not meet expectations.
7.1 Mining Complete Data
The results of the first experiment—classification
into classes according to grades A, B, C, D, E, F
(Table 2)—are not too convincing and also the
accuracy improvement is quite small when
compared with the baseline. It supports the
observation that there is no strong difference
between students when the difference in grades is
small.
The obtained results of three class classification:
good/bad/failure (Table 3)
yield higher accuracy
than the previous one. The maximum difference
from baseline was observed for IB108—18%. If
compared to Bydžovská et al. (2013), accuracy
increased for 4 out of 5 courses. Only exception was
MB103 where the accuracy remained unchanged.
Table 2: Classification into classes according to grades.
Course Baseline Data Best results
IB101 40.74% Subset + Courses 43.33% AdaB
IA008 34.24% Subset 39.72% J48
IB108
17.86% Study-related data 33.92% PART
Subset 33.92% IB1
IA101 38.93% All data 42.47% SMO
MB103 28.09% Subset + Courses 32.63% Bagging
CSEDU2014-6thInternationalConferenceonComputerSupportedEducation
272
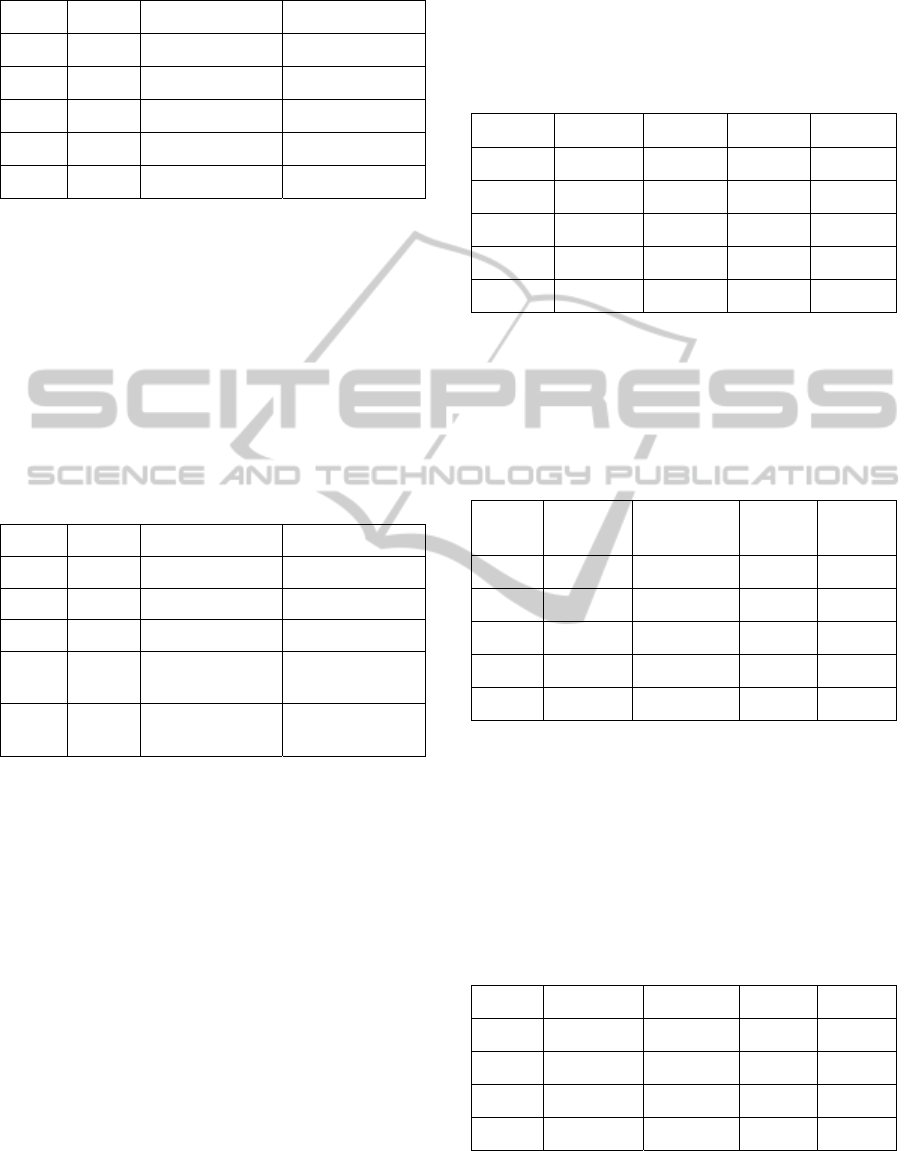
Table 3: Three class classification: good/bad/failure.
Course Baseline Data Best results
IB101 68.38% Subset + Courses 68.62% AdaB
IA008 56.16% Subset + Courses 66.67% SMO
IB108 44.64% Subset + Courses 62.50% NB
IA101 53.09% Subset + Courses 65.49% AdaB
MB103 47.12% Study-related data 57.70% Bagging
As we could see in results above, for grade
prediction none of classifiers was able to reach
accuracy significantly higher than baseline. For
classification of success or failure (Table 4), the case
was different. For success/failure prediction, for all
of subjects, but IB101 there was slight improvement
in accuracy. For IB108 the accuracy reached 82.14%
what was more than 10% increase. Even higher
increase—more than 25%—was observed for
IA101. Data about students' previously passed
courses improved the results in this case.
Table 4: Classification of success or failure.
Course Baseline Data Best results
IB101 91.10% Subset 90.16% SMO
IA008 83.56% All data 89.04% SMO
IB108 69.64% Study-related data 82.14% SMO
IA101 53.10% All data +
Courses
81.42% AdaB
MB103 69.48%
Study-related data 75.22%
NB/Bagging
7.2 Comparison of Grade Averages
This method, as introduced in 6.2, was based on
comparison of average grades of the student with
average grades for the investigated course. In
Table 5, (a) contains results when the student grade
was compared with average grades of other students,
with average of all student's friends' averages from
the sociogram (b), and average of averages of
student's friends that attended the investigated
course simultaneously with the student (c).
This method resulted in slight accuracy increase
in most cases for the choice (b)—average of all
student's friends' averages from the sociogram. All
results can be seen in Table 5.
Based on those results, we decided to build an
ensemble learner that employs those three
classifiers. A course is recommended to a student
only if all three classifiers predict success. In the
same manner, the course is not recommended if all
three classifiers predict failure. Otherwise, the
classifiers do not supply any recommendation.
Table 5: Prediction of student success from student
potential.
Course Baseline (a) (b) (c)
IB101 91.10% 50.58% 91.29% 75.00%
IA008 83.56% 59.72% 84.28% 84.84%
IB108 69.64% 64.28% 70.90% 61.11%
IA101 53.10% 61.94% 46.90% 54.63%
MB103 69.48% 63.74% 69.48% 67.28%
The results in Table 6 show significant
importance of social ties between students. It
supports hypothesis that students having clever
friends have higher probability to pass courses than
the others.
Table 6: Ensemble learner of student potential.
Course Successful
students
Predicted to
be successful
Precision Recall
IB101 390 167 98.80% 42.30%
IA008 60 36 91.67% 55.00%
IB108 39 24 87.50% 53.84%
IA101 53 78 56.41% 83.01%
MB103 230 123 92.68% 49.56%
7.3 Recommendations to Subgroups
In this experiment we looked for subgroups with
high precision of recommendations. The most
promising attributes were: the average grade and the
ratio of a number of gained credits to a number of
credits to gain (credits ratio). The best results for
each course are in Table 7.
Table 7: Discovered subgroups.
Course Attribute Range Precision Recall
IB101 Avg. grade (-inf, 1.8> 98.60% 8.95%
IB108 Credits ratio (-inf, 1.20> 85.56% 81.10%
IA101 Credits ratio (-inf, 0.23> 77.40% 17.35%
MB103 Credits ratio (-inf, 1.29> 96.43% 49.15%
We also explored manual invention of subgroups.
We focused on the field of study and the year when
CourseRecommendationfromSocialData
273

the exam was passed. We observed that the accuracy
increased between 2 and 4% for the field of study.
However, this approach needs to be further
elaborated.
8 DISCUSSION
We observed that use of social data together with
study-related data resulted in accuracy increase in
most of cases. On the other side, when using only
social behaviour data, results were worse than when
using only study-related data.
The most useful attributes were almost all social
behaviour attributes—closeness centrality, both
types of degree and betweenness centrality. The
most promising attribute was closeness centrality.
We may conclude that the most important is how
fast a student can get a certain information from
other students in the sociogram. Among study-
related attributes it was an average of grades, a
weighted average of grades, credits to gain, gained
credits, a programme and a field of study.
The results were also improved by adding the
information about student previously passed courses.
The largest improvement was observed at course
IA101. It may be caused by the fact that students
usually enrolled in this course later than in the other
courses that were included in this research.
The next observation concerns ensemble learner
of student potential (Table 6 in 7.2). The learner
significantly improved precision if compared with
experiment from 7.1. The price is lower recall we
are capable to give right recommendation only to a
subpart (about 50%) of students. Concerning
subgroup discovery, results for IA101 and MB103
were improved but we did not succeed in
discovering an interesting subgroup for IA008. It
may be also useful to combine the first two
methods—machine learning and average grade
comparison—and apply such an ensemble learner to
promising subgroups of students.
We observed that experimental results were
worse for courses that changed in the period of
2010-2012. That change may concern contents of
the course or a way in which students have been
evaluated. In that case learning and test data may not
be from the same distribution what usually causes a
decrease of performance, i.e. accuracy. To prevent
from such a situation it would be necessary to check
compatibility of historical (training) data and
current (test) data e.g. by the methods described in
Jurečková et al. (2012).
9 CONCLUSIONS AND FUTURE
WORK
Our main contribution is to provide a method to use
social data together with other educational data for
course prediction. We presented three different
methods to recognize and recommend passable
courses to a student and warn against difficult ones.
The proposed methods were validated on
educational data originated in IS MU. We used
different analytical tools, namely machine learning
algorithms, comparison of student grade averages
and employed also subgroup discovery. We
concluded that for most of courses we could provide
a recommendation to students.
There is still room for future improvements.
Some of recommendations suffer from low
confidence. In the future work we will use more
detailed history of study. We also plan to introduce
temporal attributes and to employ algorithms for
mining frequent temporal patterns. We plan to
extend data with time stamps (e.g. about the term in
which a student passed a course) and to employ
sequence pattern mining because the time sequence
in which a student passed courses can be beneficial.
The information system also contains data about
online tests that a student passed and also
information student access to online study materials.
Such statistics enabled us to better understand
student learning habits. Students learning
continuously should be more successful than the
others. We also intend to use the timetable data of
course lessons. Some students can have problems
with morning or late afternoon lessons and it can
influence the course final grade. This information
could enrich student characteristics and improve
prediction. We can also enrich the data with
information obtained from Course Opinion Poll
where students evaluate courses, use similarity
algorithms and predict the difficulty of the
investigated course for a particular student based on
the similarity of responds with others. We can
compare our predictions with a student’s subjective
opinion about courses they have already passed and
with results from similarity experiments.
Whenever a system will be running (we suppose
that this autumn term is a realistic estimate) a
student feedback will be the most important source
of information.
ACKNOWLEDGEMENTS
We thank Michal Brandejs, IS MU development
CSEDU2014-6thInternationalConferenceonComputerSupportedEducation
274

team colleagues and Knowledge Discovery Lab
members for their assistance. We also thank Alex
Popa for his help. This work has been partially
supported by Faculty of Informatics, Masaryk
University.
REFERENCES
Bayer, J. and Bydžovská, H. and Géryk, J. and Obšívač, T.
and Popelínský, L. (2012) Predicting drop-out from
social behaviour of students. In Kalina Yacef et al.
(eds.). Proceedings of the 5th International
Conference on Educational Data Mining - EDM 2012.
Greece: www.educationaldatamining.org, pp. 103 -
109, ISBN 978-1-74210-276-4.
Bydžovská, H. and Popelínský L. (2013) Predicting
Student Performance in Higher Education. In Franck
Morvan et al. (eds.) 24th International Workshop on
Database and Expert Systems Applications - Dexa
2013. IEEE Computer Society, 2013. pp. 141-145, 5.
Dekker, G.W. and Pechenizkiy, M. and Vleeshouwers,
J.M. (2009) Predicting students drop out: a case study.
In T. Barnes et al. (eds.), Proceedings of the 2nd
International Conference on Educational Data Mining
(EDM’09), pages 41–50.
Jannach, D. and Zanker, M. and Felfernig, A. and
Friedrich, G. (2011) Recommender Systems An
Introduction, Cambridge University Press.
Jurečková, J. and Kalina J. (2012) Nonparametric
multivariate rank tests and their unbiasedness.
Bernoulli 18(1), pp. 229–251, DOI: 10.3150/10-
BEJ326.
Lavrač, N. and Železný, F. and Flach, P. A. (2002) RSD:
Relational Subgroup Discovery through First-Order
Feature Construction. In 12th International
Conference on Inductive Logic Programming, pp.
149—165.
Lavrač, N and Kavšek, B (2006) APRIORI-SD: Adapting
Association Rule Learning to Subgroup Discovery.
Applied Artificial Intelligence, pp. 543-583, ISSN:
0883-9514.
Liu, B. And Hsu, W. And Ma, H. (1998) Integrating
classification and association rule mining. Proceedings
of the 4th international conference on Knowledge
Discovery and Data mining KDD'98, page 80--86.
AAAI Press.
Manouselis, N. and Drachsler, H. and Vuorikari, R. and
Hummel, H. and Koper, R. (2011) Recommender
Systems in Technology Enhanced Learning,
Recommender systems Handbook Spriger Verlag
2011, pp 387-415.
Marquez-Vera, C. and Romero, C. and Ventura, S. (2011)
Predicting school failure using data mining. In Mykola
Pechenizkiy et al. (eds.), EDM, pages 271–276.
www.educationaldatamining.org. ISBN 978-90-386-
2537-9.
Quinlan, J. R. (1993) C4.5: programs for machine
learning. Morgan Kaufmann Publishers Inc. San
Francisco, ISBN:1-55860-238-0.
Romero, C. and Ventura, S. (2007) Educational data
mining: A survey from 1995 to 2005. Expert Syst.
Appl., 33(1):135–146, ISSN 0957-4174.
Thai Nghe, N. and Janecek, P. and Haddawy, P. (2007) A
comparative analysis of techniques for predicting
academic performance, 37th ASEE/IEEE Frontiers in
Education Conference, Milwaukee, WI.
Vialardi, C. and Agapito, J. and Shafti, L. and Ortigosa, A.
(2009) Recommendation in higher education using
data mining techniques. In T. Barnes, M. Desmarais,
C. Romero, and S. Ventura (eds.), Proceedings of the
2nd International Conference on Educational Data
Mining (EDM’09), pages 191–199.
Vialardi, C. and Chue, J. and Barrientos, A. and Victoria,
D. and Estrella, J. and Ortigosa, A. and Peche, J.
(2010) A case study: Data mining applied to student
enrollment. In Proceedings of Third Educational Data
Mining Conference, Pennsylvania, USA, pages 333–
335.
Witten, I. and Frank, E and Hall, M. (2011) Data Mining:
Practical Machine Learning Tools and Techniques, 3
rd
edition, Morgan Kaufmann Publishers (ISBN: 978-0-
12-374856-0).
CourseRecommendationfromSocialData
275
