
An Adaptive Tabu Search Algorithm for the Multi-Objective Node
Placement Problem In Heterogeneous Networks
Ons Abdelkhalek
1
, Saoussen Krichen
2
and Adel Guitouni
3
1
LARODEC Laboratory, Institut Sup
´
erieur de Gestion, University of Tunis, 2000 Le Bardo, Tunisia
2
Faculty of Law, Economics and Management, University of Jendouba, Jendouba, Tunisia
3
Gustavson School of Business, University of Victoria, Victoria B.C, Canada
Keywords:
Heterogeneous Network Management, Tabu Search Algorithm, Multi-Objective Optimization Problem,
Genetic Algorithm.
Abstract:
The Multi–objective Node Placement (MONP) problem focuses on extending an existing communication in-
frastructure with new wireless heterogeneous network components while achieving cost effectiveness and ease
of management. This extention aims to broaden the coverage and handle demand fluctuations. In this paper,
the MONP problem is modeled as a multi–objective optimization problem with three objectives: maximizing
the communication coverage, minimizing active nodes and communication devices costs and maximizing of
the total capacity bandwidth in the network. As the MONP problem is N P –Hard, we present a meta–heuristic
based on the Tabu Search approach specifically designed for multi–objective problems in wireless networks.
An empirical validation of the model is defined based on a selection of a real and large set of instances and sup-
ported by a performance comparison between the suggested algorithm and a multi–objective genetic algorithm
(MOGA). All tests are performed on a real simulation environment for the maritime surveillance application.
We show empirically that the proposed approach is more relevant to solve the MONP problem regarding each
objective in term of cardinality-based performance index.
1 INTRODUCTION
A heterogeneous network involves multiple resources
(e.g., relays, antennas, etc.) and contains different
types of sub-networks with different communication
devices (CDs) (e.g., cellular, radio, wifi or Ad Hoc
networks) with varying functions and power level.
This integration takes advantage of various network-
ing techniques, such as the coverage of the cellular
systems, bandwidth of the wired networks and the
flexibility of the mobile ad hoc networks. Several
studies addressed the integration of various architec-
tures in heterogeneous platforms, as LAN and wire-
less LAN (WLAN) (Bahri et al., 2005) (Niyato et
al., 2009), Wi-Fi and Wi-Max (Ting et al., 2009),
and the integration of Ad hoc and cellular networks
in (Hongyi et al., 2011). Nevertheless, published re-
search on optimization algorithms for heterogeneous
network extension seems much more limited. Most
studies reported in the literature focused only on the
extension of one existing homogeneous network in-
frastructure.
In our proposed model, we try to report with fi-
delity all the aspects of the heterogeneity in merging
multiple network technologies by its degree of relia-
bility and how closely it captures the features of the
signal quality constraints. In this paper, we address
the multi-objective node placement (MONP) (Ab-
delkhalek et al., 2011, 2013) problem. The MONP
problem considers the following settings: a set of can-
didate sites representing the potential placement of
nodes, the traffic distribution estimated by using em-
pirical prediction models and the signal quality prop-
agation model. Other aspects are also taken into ac-
count, such as an existing heterogeneous network in-
frastructure, hardware cost, signal quality and service
coverage.
The purpose is to find the convenient way to build
and connect the network. In fact the optimal assign-
ment includes the efficient number, position, CDs’ na-
ture and connections between active nodes in a special
area of coverage while taking into consideration mul-
tiple environmental constraints. The problem deals
with two aspects of the network management. First
we aim to maximize the coverage area within a het-
erogeneous network. To achieve this goal we attempt
249
Abdelkhalek O., Krichen S. and Guitouni A..
An Adaptive Tabu Search Algorithm for the Multi-Objective Node Placement Problem In Heterogeneous Networks.
DOI: 10.5220/0004834102490256
In Proceedings of the 3rd International Conference on Operations Research and Enterprise Systems (ICORES-2014), pages 249-256
ISBN: 978-989-758-017-8
Copyright
c
2014 SCITEPRESS (Science and Technology Publications, Lda.)

to maximize the number of users receiving signal.
However, this will be constrained by the minimiza-
tion of the deployed entities’ cost. Second, we lead
to improve the quality of signal and maximize infor-
mation flows in the network as we minimize cost of
deployed devices in the network.
It’s obvious that the problem is highly combinato-
rial with an enormous number of possible combina-
tions and conflicting objectives. The problem is mod-
eled as a multi-objective optimization problem sub-
ject to system constraints. If we reduce the proposed
problem to the Antennas Placement Problem (APP)
or Transmitter Placement Problem (TPP) (Lee et al.,
2000) (Ting et al., 2009), we will clearly conclude
that it is an N P–Hard problem. Therefore, heuristic
approaches can be considered to solve the problem.
We developed a multi-objective tabu search (MOTS)
approach (Hansen, 2000) given its ability to tackle the
high complexity of similar problems and to generate
a promising approximation of the efficient set.
As the MONP is newly modeled multi-objective
and heterogeneous, no benchmarks exist. To test
our approach, we generated 54 different real prob-
lem instances with varying region sizes, locations,
density of test points (TPs) and number of active
nodes. We compare the MOTS algorithm to the
Multi-objective Genetic Algorithm (MOGA) (Ab-
delkhalek et al., 2011). The empirical application is
validated in a maritime surveillance application with
a simulation environment called Inform Lab (IL) (Ab-
delkhalek et al., 2013) using real data instances. An-
tennas are represented by nodes in maritime platforms
(i.e. helicopters, ships, boats,..) and CDs represent all
the equipment capable to ensure the communication
between different technologies (i.e. radio, cellular,
WLAN,..).
The remaining of this paper is organized as fol-
lows. In Section 2, we provide a brief description of
the problem modeling. Section 3 presents the adapted
MOTS algorithm to solve the MONP problem. The
performance of the proposed algorithm is presented in
Section 4 and compared with the MOGA on a bench
of realistic problem set.
2 THE MULTI–OBJECTIVE
NODE PLACEMENT PROBLEM
IN A HETEROGENEOUS
NETWORK
The MONP problem (Abdelkhalek et al., 2011, 2013)
consists to find the appropriate placements for a set of
nodes in an existing heterogeneous network Z
d
using
a set of pre-defined candidate sites (CSs) as potential
locations. For each selected CS, find the appropriate
node and CDs, as well as the suitable ad hoc connec-
tion strategies between the new deployed node and the
existing infrastructure. All these choices must satisfy
a set of conflicting objectives and constraints.
2.1 Notation
The following table explains the notation related to
the mathematical formulation.
Indexing N Set of nodes {n
1
,...,n
N
}
Set D Set of communication devices {d
1
,...,d
D
}
M Set of predefined candidate sites of interest
{l
1
,...,l
M
}
R Set of test points (or receivers) {r
1
,...,r
R
}
Parameters τ = (p,s, Each CD has a set of characteristics related
c,t,w, b) to the infrastructure and to the sub node,
where: p represents the power, s denotes the
capacity between nodes and TPs, c is the
cost between CDs (includes the technologies’
cost deployed to connect the two devices), t
denotes the CD’s type (see Table 1), w
denotes the transmission range related to
a CD, and b denotes the bandwidth between
two different nodes when connecting
the infrastructure.
a
kd
= |{r
f
}|, if ∀ f , ∃i ∈ N, ∃k ∈ M and ∃d ∈ D
where S
d
f ,i,k
≥ θ
d
f
φ, otherwise.
T
D×D
Input matrix,T
dd
0
= 1 if CD d and d
0
can
communicate
NL
d
The maximum number of transmitters
assigned to a node with CD d
C
i
Cost of a node n
i
S
d
f ,i,k
Signal strength between a node n
i
with CD
d in CS l
k
and TP r
f
p
d
Power of the communication device d.
G
f
, G
i
Antenna gains of TP r
f
and node n
i
λ The carrier wavelength
d
f ,k
Euclidean distance from r
f
to CS l
k
(σ
d
f
,θ
d
f
) data rate demand (in Erlang) and signal
threshold of TP r
f
for the CD d
(α
f
,β
f
) Coordinates of the TP r
f
(α
k
,β
k
) Coordinates of the CS l
k
Z
d
Initial existing networks infrastructure with
CD d
T
Z
d
Maximum capacity for Z
d
(bandwidth)
Decision x
d
ik
= 1 if a node n
i
with a CD d is assigned
Variables to CS l
k
y
d
i j
= 1 if a node n
i
is assigned to an other
node n
j
with a CD d
w
d
i f
= 1 if TP r
f
is assigned to a node
n
i
with CD d
2.2 Outline of the Problem Formulation
The MONP problem (Abdelkhalek, 2011) is formu-
lated as follows:
ICORES2014-InternationalConferenceonOperationsResearchandEnterpriseSystems
250

Max Z
1
(X) =
D
∑
d=1
N
∑
i=1
M
∑
k=1
x
d
ik
a
kd
(1)
Min Z
2
(X) =
D
∑
d=1
N
∑
i=1
(C
i
+ c
d
)
M
∑
k=1
x
d
ik
(2)
Max Z
3
(X) = Min
{d,i6= j}
y
d
i j
b
d
(3)
s.t.
y
d
i j
= x
d
ik
x
d
0
jk
0
∀i 6= j, ∀k 6= k
0
with t
dd
0
= 1 (4)
and d
k,k
0
≤ Max(w
d
,w
d
0
)
R
∑
f =1
M
∑
k=1
σ
d
f
w
d
i f
x
d
ik
≤ s
d
∀i,d (5)
N
∑
i=1
N
∑
j=1
D
∑
d=1
b
d
y
d
i j
≤ T
Z
d
∀i 6= j,∀Z
d
(6)
∑
i∈N/{ j}
y
d
i j
≤NL
d
∀ j ∈ {1,...,N} (7)
D
∑
d=1
x
d
ik
T
it
≥1 ∀i ∈ N (8)
M
∑
k=1
x
d
ik
= 1 ∀i ∈ {1,... , N},∃d ∈ D (9)
N
∑
i=1
x
d
ik
≤ 1 ∀k ∈ {1, ...,M}, ∃d ∈ D (10)
N
∑
i=1
M
∑
k=1
x
d
ik
w
d
i f
≤ 1 ∀d ∈ D (11)
N
∑
i=1
y
d
i j
≥ 1 ∀ j,t and j 6= i (12)
N
∑
i=1
y
d
iZ
d
≥ 1 ∀d (13)
x
d
ik
,w
d
i f
,y
d
i j
∈ {0,1} ∀i,k, f , j,d (14)
The MONP problem addresses three main objectives
for the problem:
• Maximizing the communication coverage by max-
imizing the number of covered TPs in the area of
interest (see equation (1)). Thus, it ensures that
the received signal power from a given location
has met the received sensitivity of the TP.
• Minimizing active nodes and communication de-
vices costs through equation (2), by reducing the
number of deployed nodes and CDs.
• Maximizing of the total capacity bandwidth in the
network by maximizing the amount of traffic held
by the network in equation (3). This leads to max-
imize the total minimum capacity bandwidth de-
ployed in all the network in order to ensure the
QoS.
These objectives are subject to two main sets of con-
straints:
• Communication Node Constraints: It represents
all constraints related to the traffic carried in the
network, receivers sensitivity threshold of the mo-
bile and the mobility of users in the area of in-
terest. Equation (4) ensures that two nodes n
i
and n
j
can be connected only if their CDs d and
d
0
can communicate and their Euclidean distance
d
k,k
0
from CS l
k
to CS l
0
k
is less or equal to the
maximum power range between w
d
and w
d
0
re-
lated to CDs d and d
0
. In equation (5), the sum of
the total data rate demand of the covered TPs by
a node n
i
with CD d cannot exceed the capacity
s
d
of the CD. We assume in equation (6) that the
total traffic capacity of all nodes connected to an
existing network Z
d
, should not exceed the maxi-
mum capacity of this network T
Z
d
. Links capacity
constraints are presented in equation (7) where we
assume that all nodes connected to node n
j
should
not exceed the maximum capacity of links NL
d
al-
lowed for n
j
and related to his CD.
• Connection Node Constraints: It ensures the con-
nection between different entities in the network
based on their CD’s range, CS’ distance, link con-
straints,..,etc. Equations (8), (9) and (10) ensures
simultaneously that we can assign more than one
CD to a node n
i
, each nodes n
i
is assigned to one
CS l
k
and, finally, that each CS l
k
is assigned to
at most one node n
i
. We assume in equation (11),
(12) and (13) that each TP r
f
can be assigned to
at most one node n
i
with CD d, that each node
n
i
should be connected at least to another node
n
j
and ,finally, that at least one node n
i
should be
connected to the existing networks Z
d
in order to
ensure that all sub-networks are inter-connected.
X represents the efficient solution with a combi-
nation of our decision variables.
Due to the N P -hardness of the MONP problem,
no exact solution can be find to generate the Pareto
optimal front. We propose to apply an adapted MOTS
algorithm in order generate a promising sample of po-
tentially efficient solutions.
3 THE TABU SEARCH
ENCODING ALGORITHM FOR
THE MONP PROBLEM
We propose an adaptation of the basic TS (Hansen,
2000) algorithm especially designed to the MONP
problem in order to generate the non-dominated solu-
tion set. TS starts from an initial feasible solution and
AnAdaptiveTabuSearchAlgorithmfortheMulti-ObjectiveNodePlacementProblemInHeterogeneousNetworks
251

moves repeatedly from a solution to a neighbor one.
Let s ∈ S be a current solution and N(s) the neighbor-
hood of s.
A solution s is encoded as a discrete vector of size
N. Each vector’s position represents a combination
between the index k = 1,...,M of the CSs and the in-
dex d = 1,...,D of the CD to which a node is assigned.
Figure 1 illustrates an example of a solution encoding
with 19 deployed nodes and 2 different CDs. Through
this Figure, we can see that every node has been as-
signed to one CS and has at least one CD. Every CS
has a unique index that indicates its position in the
map. Every node is assigned to a different CS.
3.1 Initial Solution
The initial solution is built based in a greedy based al-
gorithm. Nodes’ placement are randomly picked from
the set of CSs {1, 2, ...,M}, then we assign a CS’s in-
dex. CD’s types are piked from the set of available
CDs D based on the demand distribution. After as-
signing a CS, we search for the maximum number of
neighbors TP for each communication type and as-
sign a CD accordingly. The number of other nodes
to which they are connected is then constructed based
on constraints (4). If the initial solution is not fea-
sible, the set of constraints described above are used
through an adjustment process in order to drive the
search toward feasible solutions. In this process, a
modification of the node assignment is made in order
to fulfill each constraint sequentially.
3.2 Neighborhood Exploration and
Evaluation
Each move consists in modifying one variable of the
vector X in an iteration it. The following moves are
considered for our model:
• remove a node n
i
from a selected CS l
k
• move a node n
i
which is already installed at a
given location l
k
to a vacant location l
0
k
• assign a node n
i
the nearest CS l
0
k
• assign a new CD d to a node n
i
for a certain CS l
k
• assign a node n
i
to an existing initial network Z
d
We only consider moves that preserve the connection
and communication constraints. Each time a move is
applied, the neighbor is evaluated based on the three
objective functions detailed above. A randomly non-
dominated solution from the neighborhood replace
the current solution even if it is not improving in order
to escape from the local optima. The whole process
is stopped if a given number of iterations it
max
have
been accomplished or when no improvement is per-
formed on the set of efficient solutions obtained after
a certain number of iterations.
3.3 Tabu List
In order to escape the local optima and prevent re-
visiting previously explored solutions, a tabu list L is
used. This list keeps track of the last |L| modifica-
tions during the search process. Over multiple runs,
TS is able to find non–dominated solutions that repre-
sent good placement of a set of nodes from the list of
CS. At each step of the algorithm, a list that contains
non–dominated solutions P
ND
is generated when the
MONP optimization problem is solved. The tabu list
L may prohibit attractive neighbors that have not yet
been generated. Hence, it is necessary to use a pertur-
bation criterion to accept forbidden neighbors. Our
perturbation criterion consists in choosing randomly
a tabu neighbor from the P
ND
list.
The MOTS is compared to the MOGA, previ-
ously applied to the MONP problem for the maritime
surveillance application and detailed in (Abdelkhalek
et al., 2011). The main steps of the algorithm are sum-
marized as follows:
Begin
L := {}, P
ND
:=
/
0, it := 0,
Generate randomly a feasible starting solution S,
Repeat
Determining the best move s to its neighbor s
0
∈ N(s)
Determine the number of iterations for which the node is tabu
If Fitness(X
0
) Dominates Fitness(X) Then
P
ND
← P
ND
∪ {s
0
}
update Tabu List L
End If
it++
Until Stopping criterion
End
4 EXPERIMENTATIONS AND
NUMERICAL RESULTS
Results are run using a testbed simulator for real data
instances called Inform Lab (IL) (Abdelkhalek et al.,
2013). Each instance is solved with 30 independent
runs. A maximum number of iterations it
max
is set
to 500 iterations for each run. The algorithm stops
when no improvement is performed on the objective
functions after 100 iterations or when the maximum
number of iteration is reached. The number of iter-
ations that a node can be tabu is set between [5,10].
ICORES2014-InternationalConferenceonOperationsResearchandEnterpriseSystems
252
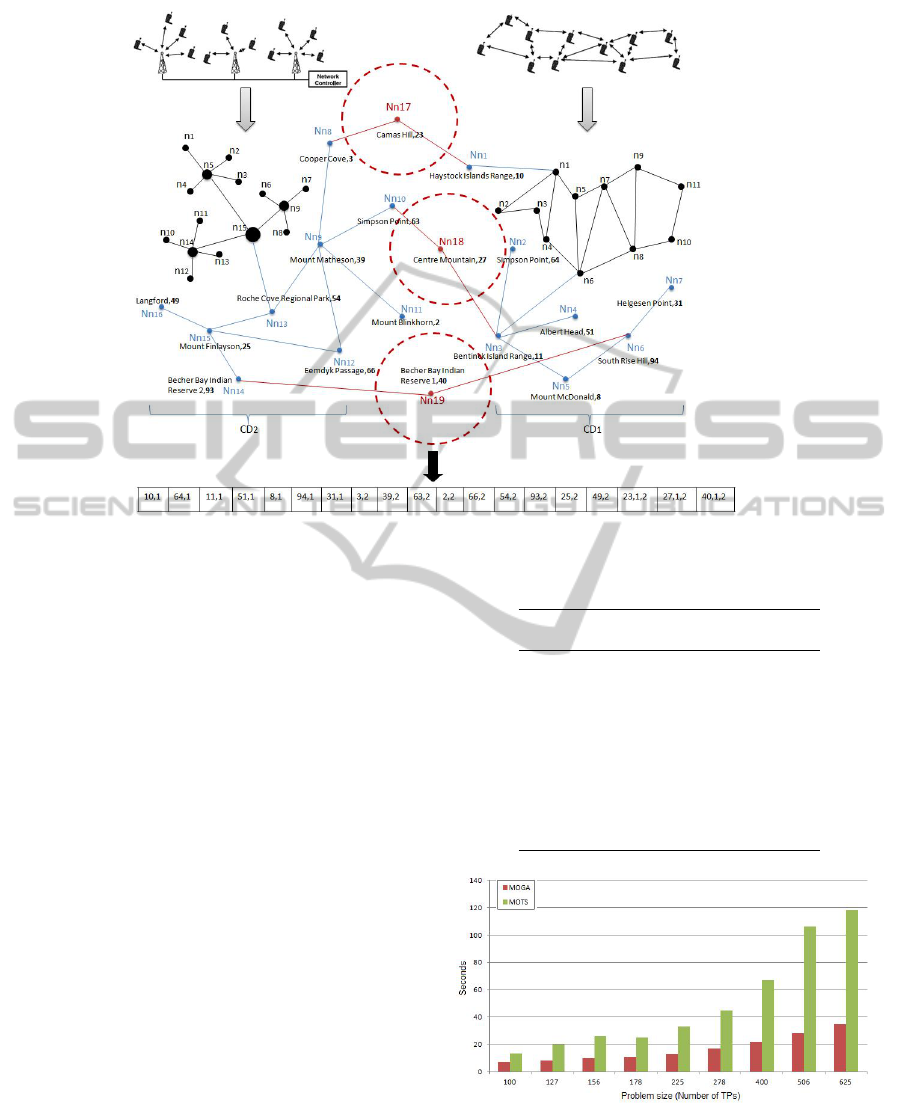
Figure 1: An example of the TS encoding scheme for a heterogeneous network extension.
These parameters were selected after multiple exper-
imentations. The existing heterogeneous network in-
frastructure includes 8 nodes and 3 CDs in Vancouver
Island area.
The free space signal propagation model proposed
in (Ting et al., 2009) is used in the experimental de-
sign. Moreover, different region sizes, locations and
densities of TPs are considered. For each size of the
area, three instances of the problem were generated
with different region size. We deploy simultaneously
10, 20 and 30 nodes. For each instance nine different
TPs distribution are applied as presented in Tables 3,
2 and 4. Furthermore, ten different CD’s settings are
used in order to ensure a heterogeneity in the network
connections (see Table 1). The frequency and ranges
are used to compute the signal strength and the band-
width to optimize Z
3
. The number of CSs is always
greater than the number of nodes to place. Three dif-
ferent settings are used: for 10 active nodes we plan
17 CSs, 100 CSs for 20 active nodes and 183 CSs for
30 active nodes. A total of 54 different problem in-
stances were generated for the tests.
For each instance, we report the following mea-
sures: The average CPU time, number of non dom-
inated solutions (|P
ND
|) and values of the three ob-
jective functions for both MOTS and MOGA where
Z
1
is the number of covered TPs, Z
2
the total cost of
deployed CD and nodes, and finally Z
3
represents the
total minimum capacity bandwidth deployed in all the
Table 1: Communication Devices’ Settings.
Link # Bandwidth Frequency Range
(kbit/s) (Hz) (km)
1 400 1E09 300
2 4000 8.23E09 3600
3 1000 6E09 2000
4 600 1.75E09 500
5 800 2E09 600
6 3000 3E09 500
7 500 1.5E09 2000
8 4000 2E09 3000
9 1000 8E09 800
10 2000 7E09 1000
Figure 2: CPU in term of the number of TPs.
network.
Because of the N P -hardness of the MONP prob-
lem, potentially Pareto-optimal solutions are gener-
ated. In order to compare the performance of our two
AnAdaptiveTabuSearchAlgorithmfortheMulti-ObjectiveNodePlacementProblemInHeterogeneousNetworks
253

Table 2: Computational performance of MONP for 10 nodes and 17 CSs.
Pbs. TPs CDs MOGA MOTS
|P
ND
| CPU(s) Z
1
Z
2
Z
3
|P
ND
| CPU(s) Z
1
Z
2
Z
3
1 100 5 4 3 100 271907 400 4 5 100 271900 400
2 10 4 4 100 271230 1000 3 7 100 271222 1000
3 127 5 4 4 127 270271 400 5 7 127 270260 500
4 10 4 5 127 282275 2000 5 10 127 282265 2000
5 156 5 3 4 156 269173 400 4 7.5 156 269125 500
6 10 5 5 156 284970 500 6 11 156 285190 500
7 178 5 4 3 178 271026 800 5 7 178 271136 1000
8 10 7 6 178 278942 600 6 9 178 278930 600
9 225 5 4 5 223 275473 400 3 12 225 275402 500
10 10 5 7 225 280714 600 6 23 225 280504 800
11 278 5 3 5 272 275594 400 4 13 276 275590 400
12 10 2 9 277 283442 500 4 29 278 283412 600
13 400 5 5 7 400 270507 400 4 19 392 270517 500
14 10 5 12 400 281589 800 6 30 400 281459 1000
15 506 5 6 8 490 270778 500 4 20 498 270768 600
16 10 5 20 500 282749 4000 5 55 506 282650 3000
17 625 5 7 15 580 271530 400 9 35 622 271538 400
18 10 7 17 591 283484 2000 9 48 625 283564 1000
Table 3: Computational performance of MONP for 20 nodes and 100 CS.
Pbs. TPs CDs MOGA MOTS
|P
ND
| CPU(s) Z
1
Z
2
Z
3
|P
ND
| CPU(s) Z
1
Z
2
Z
3
1 100 5 3 6 100 471677 400 3 10 100 471665 400
2 10 3 8 100 484913 3000 2 15 100 484895 1000
3 127 5 3 7 127 468713 400 4 15 127 468688 400
4 10 5 9 127 482211 600 5 20 127 482013 800
5 156 5 4 9 156 470028 400 5 22 156 470128 400
6 10 4 12 156 487340 1000 5 30 156 487250 1000
7 178 5 4 9 178 477123 400 3 19 178 477083 400
8 10 5 13 178 492783 800 4 33 178 492780 500
9 225 5 3 11 218 468145 400 4 30 222 468045 400
10 10 2 17 220 482626 400 3 37 225 482603 1000
11 278 5 4 14 270 470694 400 3 38 277 470630 400
12 10 4 17 275 476757 400 3 40 278 476650 500
13 400 5 6 17 398 467905 600 7 42 400 467899 500
14 10 4 24 400 490869 500 6 78 400 490779 600
15 506 5 5 21 480 473621 400 5 69 500 473660 400
16 10 5 42 495 479550 500 7 188 503 479525 400
17 625 5 7 30 605 463591 800 8 72 608 463513 800
18 10 10 38 608 488099 500 10 96 612 486005 400
approaches, we use a simple cardinality-based index
namely Coverage of two sets index (C) (Zitzler and
Thiele, 1999). It’s used to compare the relative domi-
nance (i.e. coverage) between the two non dominated
solution sets, defined as:
C(S
1
,S
2
) = |{s
2
∈ S
2
;∃s
1
∈ S
1
;s
1
s
2
}|/|S
2
|
where S
1
and S
2
represent the set of non-
dominated solutions generated simultaneously by the
MOTS and MOGA. Table 5 reports the performance
of the MOTS and MOGA according to the C index.
In fact, two main results are pointed out: the domi-
nance regarding each objective function Z
i
(coverage
/ Objective) and the relative dominance that reflects
the performance of each method regarding to all ob-
jectives simultaneously. To this end, we count the set
of non-dominated solutions generated by both algo-
rithms. Then we compute, for each instance, the av-
erage dominance between the two sets (C(S
1
,S
2
) and
ICORES2014-InternationalConferenceonOperationsResearchandEnterpriseSystems
254

Table 4: Computational performance of MONP for 30 nodes and 183 CS.
Pbs. TPs CDs MOGA MOTS
|P
ND
| CPU(s) Z
1
Z
2
Z
3
|P
ND
| CPU(s) Z
1
Z
2
Z
3
1 100 5 3 9 100 807153 400 3 19 100 807140 400
2 10 2 13 100 811918 2000 3 25 100 811820 1000
3 127 5 3 10 127 806046 400 3 28 127 806015 500
4 10 4 14.5 127 842980 1000 4 40 127 842953 800
5 156 5 3 11 156 788932 400 4 39 156 788920 400
6 10 3 17 156 806433 3000 4 47 156 806360 2000
7 178 5 3 13.5 178 798788 400 4 36 178 798741 400
8 10 3 18 178 821985 2000 4 48 178 821935 2000
9 225 5 3 13 218 784453 400 3 30 223 784257 500
10 10 4 24 222 834403 600 5 65 225 834323 600
11 278 5 4 25 275 795268 400 5 62 276 795250 400
12 10 6 31 278 833327 800 5 86 278 833225 500
13 400 5 6 26 385 801875 400 5 96 395 801690 400
14 10 6 45 400 831033 1000 5 137 400 831009 1000
15 506 5 6 30 491 778785 800 7 75 500 778750 600
16 10 5 47 500 840161 500 6 230 502 840053 800
17 625 5 12 44 612 803887 600 11 200 620 803967 600
18 10 10 64 615 822732 400 11 258 625 822546 400
C(S
2
,S
1
)) for all objectives. The results obtained by
the two approaches are compared. Thus, we can state
the following remarks:
• Starting from 225 TPs, we can notice that in
96% MOTS generates better solutions (i.e. 24 in-
stances out of 25). Moreover, in more than 50%
of the problem instances (i.e. 29 instances out of
54), both MOTS and MOGA reach the total net-
work coverage in terms of TPs covered.
• The cost is proportional to the size of the problem
instance. We can notice that the more TPs we de-
ploy in the area, the more expensive the cost of
our placement. This is due to the heterogeneity of
the network and the CDs’ cost. As can be gath-
ered from Table 5, the proposed MOTS is able to
find solutions that are mostly better than MOGA.
In fact, Z
2
for MOTS are on average 33% better
than those proposed by MOGA.
• Regarding the maximization of the minimum
bandwidth, in 46.29% (i.e. 25 instances out of 54)
we get the perfect equality with the two methods.
However on the 29 remaining instances, MOGA
got better solutions on 18 instances (i.e. 62%).
• As we can see in Figure 3, MOGA requires less
CPU time. This gap becomes more important as
the problem size increase since MOTS still has
to go through several iterations due to its track-
ing process using tabu lists. This behavior is due
to the numerous iteration that MOTS has to go
through.
• For large instances, MOTS has better results then
the MOGA algorithm in terms of network cover-
age. Also, we can notice that 100% of TPs cov-
erage were achieved in 53% of the problem in-
stances.
• If we rate the total dominance of the two algo-
rithms for the set of non dominated solutions P
ND
(Table 5), we clearly see that MOTS dominates
MOGA in 37.96% comparing to 34.25% for the
MOGA among the whole set of 54 problem in-
stances.
• We can clearly see from Tables 3, 2 and 4, that the
number of non dominated solutions P
ND
is related
to the number of active nodes deployed in the net-
work. The more nodes we activate, the bigger is
the number of non dominated solution.
Table 5: Comparison of the coverage based index obtained
using MOTS and MOGA.
Solution Coverage / Objective Average
approaches Z
1
Z
2
Z
3
Coverage
MOTS 96% 66% 38% 37.96%
MOGA 4% 33% 62% 34.25%
Based in the numerical results reported in tables 3,
2, 4 and 5, we can note that the MOGA failed to meet
100% of TPs coverage for large scaled problems. This
is due to the repairing process used in MOGA to han-
dle a large set of constraints in our problem formu-
lation. However, we can clearly see that MOTS out-
performs MOGA to minimize the network’s cost and
AnAdaptiveTabuSearchAlgorithmfortheMulti-ObjectiveNodePlacementProblemInHeterogeneousNetworks
255

maximize the total network coverage. This can be ex-
plained by the capacity of MOTS to explore a large set
of solutions where MOGA, due to its crossover and
mutation process, can reduce considerably the feasi-
ble region.
5 CONCLUSIONS
Throughout this paper, we studied the MONP prob-
lem. This problem consists of deciding to the loca-
tion, the number and the interconnection of nodes in
order to extend an existing network. It also aims to
decide of the optimal type and number of deployed
CDs to ensure the heterogeneity of the infrastructure.
As the problem is multi–objective and heterogeneous,
no benchmarks exist. We thus generate three groups
of problem instances to test our approach based on
the number of active nodes deployed in the network
and the number of associated candidate sites. We
presented two resolution approaches that iteratively
solve the MONP problem. Our computational exper-
iments show that the tabu–based heuristic produced
solutions that were in 37.96% better than those pro-
duced with the genetic algorithm. These are consid-
ered as promising results if we take into considera-
tion the difficulty and complexity of the problem that
we have studied. However, the MOGA still get bet-
ter results on the execution time. Other research lines
should be carried out in future work to assess the per-
formance of our method.
REFERENCES
Abdelkhalek, O., S. Krichen, A. Guitouni and S. Mitrovic-
Minic, (2011). A Genetic Algorithm for a Multi-
Objective Nodes Placement Problem in Heteroge-
neous Network Infrastructure for Surveillance Appli-
cations. IEEE Proc: 4th Joint IFIP/IEEE Wireless and
Mobile Networking Conference. 1–9.
Abdelkhalek, O., S. Krichen, A. Guitouni, (2013).
Location-Allocation Planning of Heterogeneous Net-
works for Maritime Surveillance Application. Chap-
ter 26 in:
´
E. Boss, E. Shahbazian, G. Rogova, (Eds),
Prediction and Recognition of Piracy Efforts Using
Collaborative Human-Centric Information Systems,
NATO Sciences for Peace and Security Series E: IOS
Press, The Netherlands. 109 228–235.
Bahri, A. and S. Chamberland, (2005). On the wireless local
area network design problem with performance guar-
antees. Computer Networks. 48 856-866.
Hongyi W., Chunming Qiao, Swades De, Ozan Tonguz,
(2011). An integrated cellular and ad hoc relaying sys-
tem: iCAR. IEEE Journal on Selected Areas in Com-
munications. 19(10) 2105-2115.
Hansen, M. P., (2000). Use of Substitute Scalarizing Func-
tions to Guide a Local Search Based Heuristic: The
Case of moTSP. Journal of Heuristics. 6 419-431.
Lee, C. Y. and Kang, G. H., (2000). Cell planning with ca-
pacity expansion in mobile communications: A tabu
search approach. IEEE Trans. Veh. Technol. 49(5)
1678-1691.
Niyato, D. and Hossain, E., (2009). Dynamics of Network
Selection in Heterogeneous Wireless Networks: An
Evolutionary Game Approach. IEEE Transactions On
Vehicular Technology. 8(4) 2008–2017.
Ting, C. K., Lee, C. N., Chang, H. C., and Wu, J. S,
(2009). Wireless Heterogeneous Transmitter Place-
ment Using Multiobjective Variable-Length Genetic
Algorithm. IEEE Transactions on Systems, MAN, and
Cybernetics Part B : Cybernetics. 39(4) 945–958.
Toumpis, S. and Toumpakaris, D., (2006). Wireless ad
hoc networks and related topologies: applications and
research challenges. Elektrotechnik & Information-
stechnik. 123(6) 232-241.
Zitzler, E. and Thiele, L., (1999). Multiobjective Evolution-
ary Algorithms: A Comparision Case Study and the
Strenght Pareto Approach. IEEE Transactions on Evo-
lutionary Computation. 3(4) 257–271.
ICORES2014-InternationalConferenceonOperationsResearchandEnterpriseSystems
256
