
A Descriptor based on Intensity Binning for Image Matching
B. Balasanjeevi and C. Chandra Sekhar
Indian Institute of Technology, Madras, India
Keywords:
Image Descriptor, Computer Vision, Image Matching.
Abstract:
This paper proposes a method for extracting image descriptors using intensity binning. It is based on the fact
that, when the intensities of the interest regions are quantized, the pixels retain their bin labels under common
image deformations, up to a certain degree of perturbation. Consequently, the spatial configuration and the
shape of the connected regions of pixels belonging to each bin become resilient to noise, which, as a whole,
capture the topography of the intensity map pertaining to that region. We examine the effect of classical
image deformations on this representation and seek to find a compact yet robust representation which remains
unperturbed in the presence of noise and image deformations. We use Oxford dataset in our experiments and
the results show that the proposed descriptor gives a better performance than the existing methods for matching
two images under common image deformations.
1 INTRODUCTION
Local features have gained widespread attention re-
cently, due to their robustness to image deformations,
image occlusion and changes in viewpoint. A local
feature encodes the intrinsic pattern that captures the
essence of a region of interest, independent of other
such regions. It does not necessarily correspond to
any meaningful part of the scene and hence can be se-
lected, although not exclusively, based on the under-
lying image properties such as intensity, texture and
color. Local features have been used successfully for
image matching (Tuytelaars and Van Gool, 2004), ob-
ject recognition (Viola and Jones, 2004; Leibe et al.,
2008; Fergus et al., 2003; Lowe, 2004; Nister and
Stewenius, 2006; Zhang et al., 2007; Berg et al.,
2005), texture recognition (Zhang et al., 2007), im-
age retrieval (Mikolajczyk and Schmid, 2001), build-
ing panoramas (Brown and Lowe, 2003) and social
media (Snavely et al., 2008; Kennedy and Naaman,
2008; Agarwal et al., 2009).
The process of constructing local features involves
two stages. The first step (localization) consists of de-
tection of Interest Regions (IR) which possess high
information content while being robust to the image
deformations like blur, illumination changes, scaling,
rotation and affine transformations. Various methods
for detecting interest regions were reviewed in (Tuyte-
laars and Mikolajczyk, 2008), of which Hessian-
Affine detector (Mikolajczyk and Schmid, 2005) was
shown to perform better than other methods.
The next step involves building a descriptor for
each interest region obtained from the previous step,
such that the representation is compact, discrimina-
tive, generalized and robust to image deformations
and noise.
There is a rich set of existing methods for extract-
ing descriptors which are presented in Section 2. The
proposed method is discussed in Section 3 and the re-
sults are presented in Section 4.
2 METHODS FOR EXTRACTION
OF DESCRIPTORS
Many techniques have been developed for describing
the interest regions. One of earliest known works is
steerable filters (Freeman and Adelson, 1991) which
steer derivatives in a particular direction making them
invariant to rotation. Johnson et al. (Johnson and
Hebert, 1997) introduced a representation called spin
image. Baumberg (Baumberg, 2000) proposed a de-
scriptor which uses a multi-scale Harris feature de-
tector (Harris and Stephens, 1988), with a set of in-
variants robust to local linear transformations form-
ing the descriptor. Berg, et al. (Berg et al., 2005)
proposed a deformable shape matching framework,
which incorporates geometric blur descriptor (Berg
and Malik, 2001) as well as the geometric distortion
between pairs of corresponding points. Lowe (Lowe,
2004) proposed a Scale Invariant Feature Transform
96
Balasanjeevi B. and Chandra Sekhar C..
A Descriptor based on Intensity Binning for Image Matching.
DOI: 10.5220/0004827700960103
In Proceedings of the 3rd International Conference on Pattern Recognition Applications and Methods (ICPRAM-2014), pages 96-103
ISBN: 978-989-758-018-5
Copyright
c
2014 SCITEPRESS (Science and Technology Publications, Lda.)

(SIFT), which combines a scale invariant region de-
tector and a descriptor based on the gradient distribu-
tion in the detected regions. Ke and Suthankar (Ke
and Sukthankar, 2004) developed the PCA-SIFT de-
scriptor, which represents local appearance by prin-
cipal components of the normalized gradient field,
which is more compact than the standard SIFT repre-
sentation. Mikolajczyk and Schmid (Mikolajczyk and
Schmid, 2005) proposed GLOH (Gradient Location
and Orientation Histogram), in which they modified
SIFT by using a circular gradient location orientation
grid, as well as the quantization parameters of the his-
tograms. Heikkil et al. (Heikkil et al., 2009) proposed
CS-LBP (Center Symmetric-Local Binary Patterns), a
variant of LBP, which is more compact than LBP and
is computationally less expensivethan LBP and SIFT.
Lazebnik (Lazebnik et al., 2005) extracted a sparse
set of affine regions and then constructed descriptors
based on spin images and SIFT descriptor. Bay, et
al. (Bay et al., 2008) proposed an efficient imple-
mentation of SIFT by applying the integral image to
compute image derivatives. Chen, et al. (Chen et al.,
2010) proposed a descriptor inspired by Weber’s law,
which constitutes two components: one based on rel-
ative pixel differences and other on the orientation of
the pixel, which were used to construct the descrip-
tor. Cheng, et al. (Cheng et al., 2008) introduced a
local image descriptor robust to general image defor-
mations by using multiple support regions of differ-
ent sizes centered on the interest point. Winder and
Brown (Brown et al., 2011) proposed a framework for
combining various descriptors and learned an optimal
parameter setting to maximize the matching perfor-
mance. Many of the aforementioned descriptors were
evaluated in (Mikolajczyk et al., 2005) and that SIFT
and GLOH were found to perform better when com-
pared to other descriptors under common image de-
formations. In this paper, we will be using these two
descriptors along with CS-LBP for benchmarking the
performance of the proposed descriptor.
3 THE PROPOSED METHOD
3.1 Motivation
An image descriptor should mirror the topography of
the underlying intensity map such that the representa-
tion is distinctive, compact and most importantly ro-
bust to common image deformations.
To construct a descriptor which satisfies these
properties, we first analyze how the intensity map
is affected by deformations such as blur, contrast
changes, and similarity and affine transformations.
Instead of considering the raw pixel intensities, we
quantize the intensity map and analyze the effect of
each deformation on the bin labels of the pixels as
follows:
1. Consider an image pair in which one of the im-
ages is perturbed with one of the aforementioned
deformations.
2. Extract the IRs from the image pair and find the
corresponding regionsusing the method discussed
below (Section 3.1.1).
3. Quantize the intensities of the corresponding re-
gion pairs between the images and compute the
proportion of the pixels which retain the bin label.
3.1.1 Identifying the Corresponding Regions
The IRs are extracted from each image using the
Hessian-Affine detector, which outputs elliptical re-
gions. Given an IR (r
j
) in one image, its correspond-
ing IR (CR) in the other image is obtained by pro-
jecting the region under a homography H relating the
images, and finding the IR in the second image with
the highest overlap. Let R
(i)
represent the set of IRs
in image i. For any region r
j
∈ R
(1)
, let r
′
j
represent
its projection under H . Then the corresponding re-
gion of r
j
is given as,
CR(r
j
∈ R
(1)
) = {r
∗
j
∈ R
(2)
|∀r
2
∈ R
(2)
,
overlap(r
′
j
,r
2
) ≤ overlap(r
′
j
,r
∗
j
))}
(1)
The overlap between two elliptical regions r
1
and
r
2
is computed based on the method proposed in
(Mikolajczyk and Schmid, 2005). The minimal rect-
angular region bounding the ellipse pair is sampled
and the amount of overlap is computed as the ratio of
the number of points belonging to both the regions to
that belonging to either of the regions. That is,
overlap(r
1
,r
2
) =
r
1
∩ r
2
r
1
∪ r
2
(2)
Here, the numerator denotes the area of the intersec-
tion and the denominatordenotes the area of the union
of the elliptical regions.
3.1.2 Observations
The evaluation of the above method was done on Ox-
ford data set
1
, which contains image sets for bench-
marking the descriptors under a variety of image de-
formations. Each set consists of 6 images, with the
1
Oxford data set is available at http://www.robots.
ox.ac.uk/∼vgg/research/affine.
ADescriptorbasedonIntensityBinningforImageMatching
97
reference as image 1, and the images 2 to 6 being the
increasingly perturbed versions of the reference im-
age.
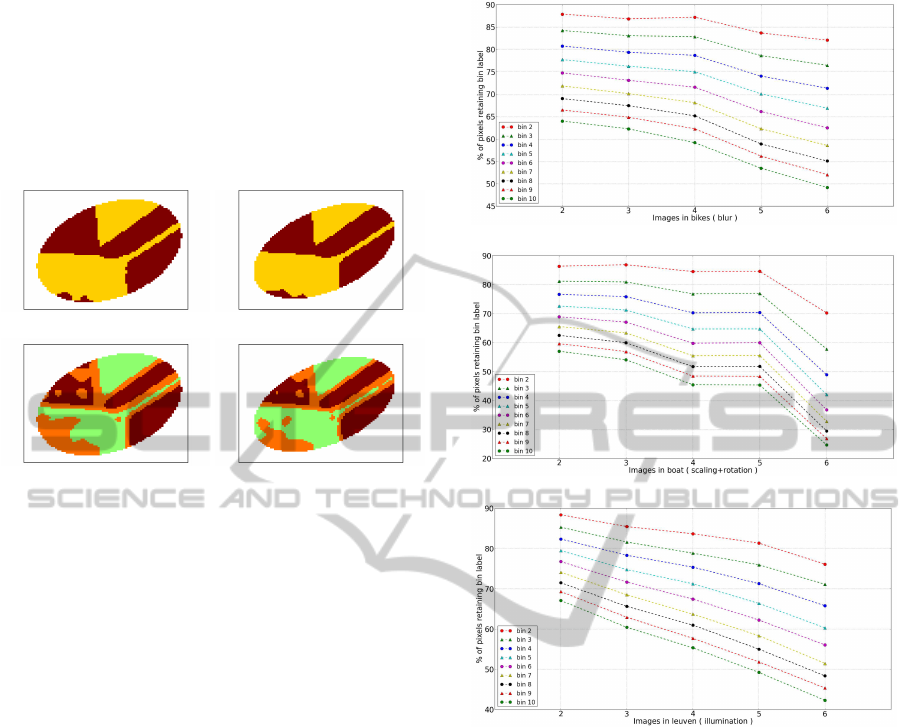
Figure 1 shows the quantized regions of a pair of
corresponding IRs obtained using the procedure men-
tioned above under blur. It is evident from the figure
that quantizing the intensity maps makes the IRs strik-
ingly similar.
(a)
(b)
Figure 1: The quantized intensity maps of a pair of corre-
sponding regions using (a) 2 bins (b) 3 bins.
Figure 2 shows the percentage of pixels across all
IRs which retain their bin labels when the intensity
range of each IR is quantized into n bins, where n is
varied from 2 to 10, under a variety of image defor-
mations. As is evident from the figure, this quantity
decreases with increasing perturbation and also with
increasing number of bins, due to the fact that the
noise resilience of a pixel’s bin label varies inversely
with the width of the bin. That is, a slight perturba-
tion is sufficient to effect a change in the bin label as
the number of bins increases. It should be noted that,
almost all of the pixels (90%) retain their bin labels
when n = 2. Thus, we can claim that,
The bin label of a pixel is more or less invariant
under classical image deformations, up to a certain
degree of perturbation.
Now, if the bin labels of pixels remain unchanged,
then the connected regions of the pixels belonging to
a bin will retain their shapes and spatial configuration.
That is,
If we consider a pair of corresponding regions, the
shapes and the spatial configurationsof the connected
regions of pixels belonging to the same bins will be
similar.
3.2 Constructing the Descriptor
Thus, based on this observation, we can assert that the
quantized map captures the topography of the inten-
sity map of an IR. But such a representation cannot
(a) Blur
(b) Scaling and rotation
(c) Illumination changes
Figure 2: Evaluation of the effect of different image defor-
mations on the bin labels for different types of distortions
(a) blur (b) scaling and rotation (c) illumination changes.
be used as such due to its high dimensionality. To
obtain a compact representation, we compute second
order central moments which capture the shape and
spatial configurations of the connected regions, since
the center of mass and the spread of the region are
captured more succinctly. Also, such a construction
has an additional advantage of being a generalized de-
scription of the intensity map, making it more resilient
to image perturbations.
The descriptors are constructed as follows. Given
an image, the IRs are first extracted using Hessian-
Affine detector and each IR is quantized using one
of the three methods discussed in Section 3.5, using
n bins. We call such a quantized map as an n-map.
To represent an n-map, we compute the second order
central moment, i.e., we fit an ellipse, to every con-
nected region of pixels belonging to each bin.
ICPRAM2014-InternationalConferenceonPatternRecognitionApplicationsandMethods
98
Algorithm 1: Compute Descriptors.
1: procedure D = COMPUTEDESC(r,n) ⊲ interest
region r with n bins
2: B ← Bin(r,n) ⊲ Quantize r using n bins
3: D ← [ ] ⊲ Initialize descriptor
4: for bin=1 .. . n do
5: K
bin
← [ ] ⊲ Initialize K
bin
6: n
bin
← #connected regions in current bin
7: for reg=1 .. . n
bin
do
8: E
reg
← FitEllipse(B,bin,reg)
9: K
bin
← [K
bin
E
reg
] ⊲ Append ellipse
10: end for
11: D ← [D K
bin
] ⊲ Append K
bin
12: end for
13: end procedure
The steps involved in constructing the descriptor
are shown in Algorithm 1. The function FitEllipse fits
an ellipse to a connected region of pixels, by comput-
ing its second order central moment. An ellipse E is
represented by the 5-tuple, (u, v,a,b, c) satisfying the
equation a(x− u)
2
+ 2b(x− u)(y− v)+c(y− v)
2
= 1.
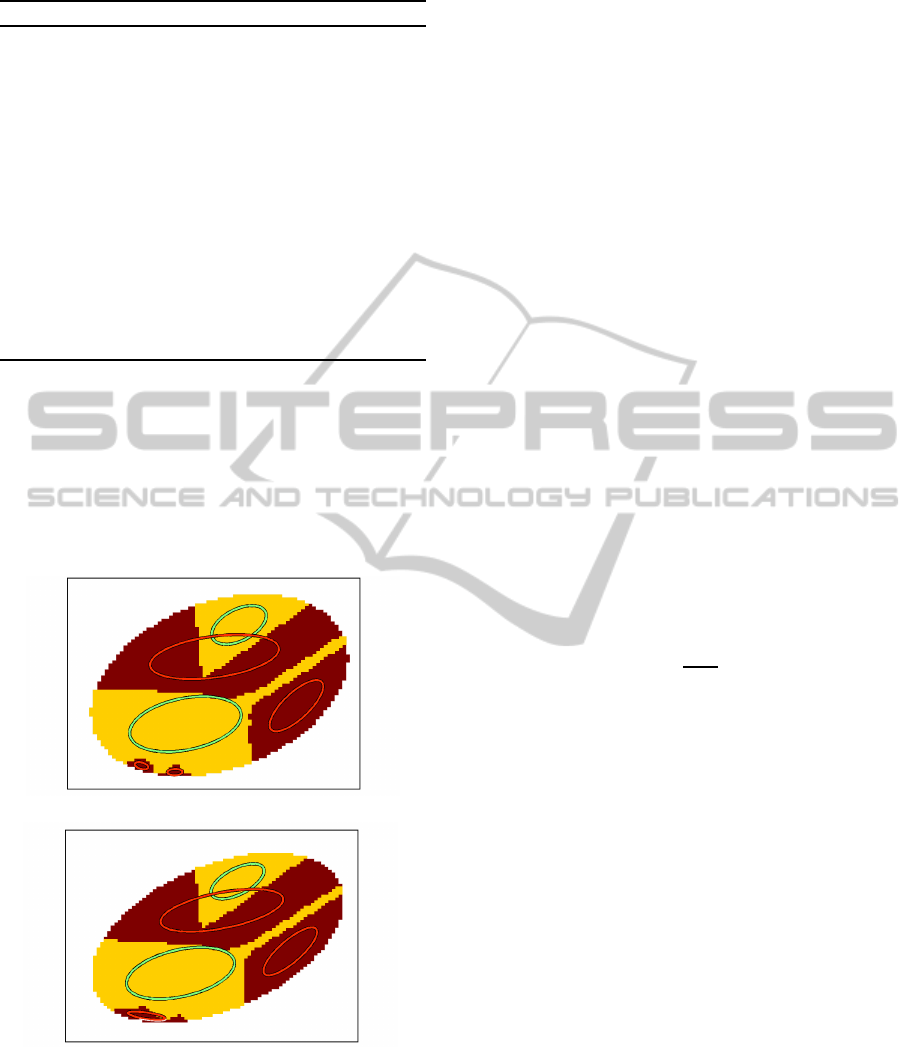
Figure 3 shows the fitted ellipses for the 2-maps of a
pair of corresponding regions.
(a)
(b)
Figure 3: (a) and (b) show the ellipses fitted for the con-
nected regions of each bin of the 2-maps of a corresponding
regions pair. The green ellipses belong to bin 1 and the red
ones to bin 2.
The descriptor obtained using this method is a
variable length encoding of an IR, consisting of a
set of ellipses. The descriptor is of the form D :=
{K
1
,K
2
,...,K
n
} where n denotes the number of bins
used for quantization; K
i
:{E
j
}
|K
i
|
j=1
denotes the set of
ellipses fitted for each connected region of pixels be-
longing to the i
th
bin; E
j
being the ellipse fitted to the
j
th
connected region.
3.3 A Better Representation of the
Regions
The descriptor presented in Algorithm 1 fits a single
ellipse to a connected region. But, if the region is not
elliptical, say, if the region is in the form of a ring,
the ellipse thus fitted does not accurately capture the
shape of a region, making the descriptor less discrim-
inative and impair the performance. To circumvent
this drawback, we fit multiple ellipses to a connected
region of pixels so that the ellipses fit the region more
”tightly”. That is, we try to minimize the number
of pixels which lie outside the fitted ellipses and the
empty area of the fitted ellipses. This is equivalent
to the geometric set covering problem, which can be
stated as,
Given a grid, a set of points which are required
to be covered and a set of forbidden points, we need
to reduce the number of ellipses which cover all the
required points and none of the forbidden points.
To this end, we define the error of the fit ε as
ε =
A
ell
N
cov
(3)
where N
cov
represents the number of points in the re-
gion that are covered by the ellipses and A
ell
repre-
sents the total area of the ellipses. That is, for the
error of the fit ε to be low, we should maximize the
proportion of the covered points and minimize the to-
tal area of the fitted ellipses.
We begin by fitting a single ellipse (k = 1) to a
connected region. If the error of the fit (ε) is above a
threshold δ, we increment the number of ellipses (k)
and use k-means clustering algorithm to cluster the
points into k clusters. Then, an ellipse is fit to each
cluster of points and the error ε is recomputed. This
procedure is repeated till the value of ε falls below δ.
The steps are shown in Algorithm 2. It should be
noted that, as the number of ellipses, k, is increased,
A
ell
will decrease and N
cov
will increase.
Here, C
i
denotes the i
th
cluster, FitEllipse(C) fits
an ellipse to the points belonging to cluster C , Area-
Covered(C ,E) computes the number of points in clus-
ter C that lie inside or on the ellipse E and Area(E)
computes the area of the ellipse E.
Figure 4 shows the configurations of ellipses ob-
tained for various values of k on a S-shaped region.
As can be seen, with increasing k, the fitted ellipses
ADescriptorbasedonIntensityBinningforImageMatching
99
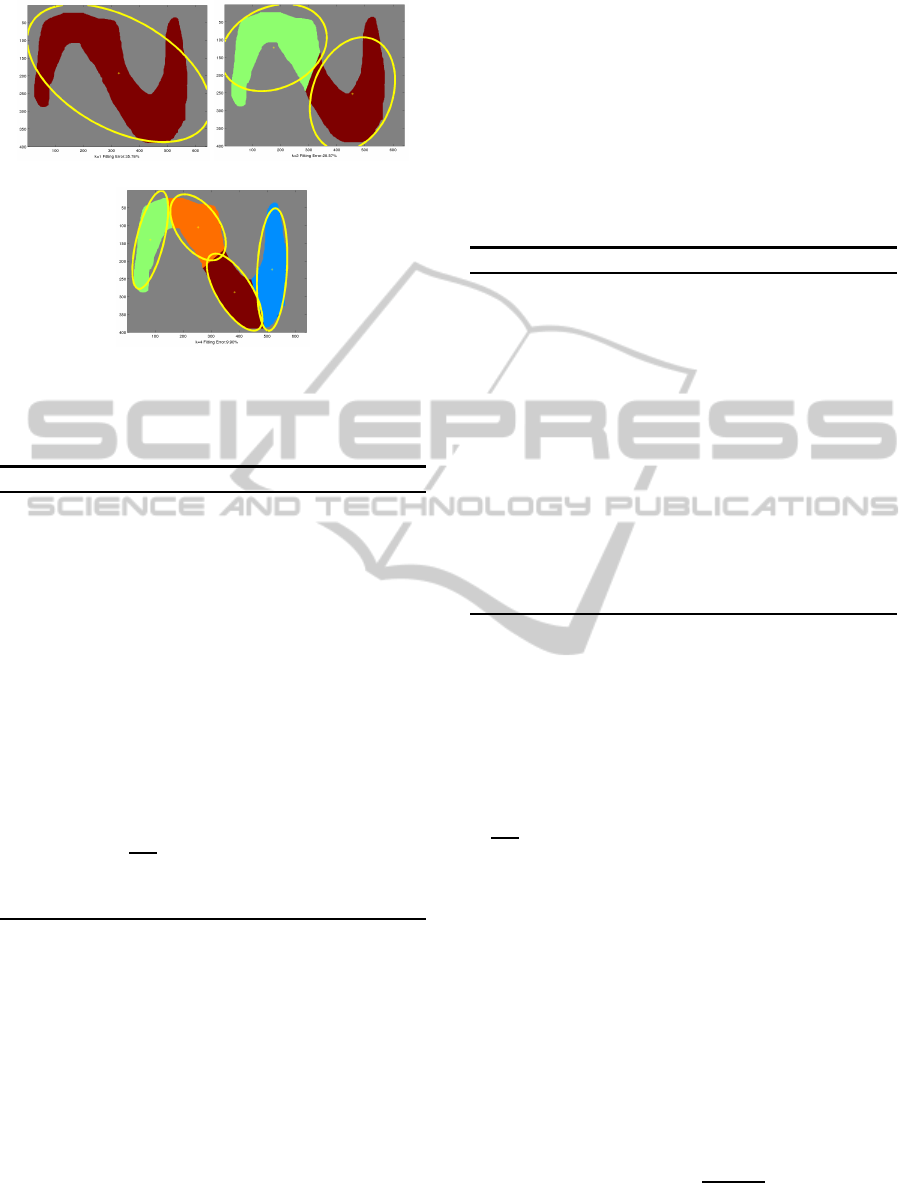
(a) k=1, ε = 0.35 (b) k=2, ε = 0.28
(c) k=4, ε = 0.11
Figure 4: (a)-(c) Visual representation of Algorithm 2,
where k is the number of ellipses to be fit and ε is the er-
ror of the fit.
Algorithm 2: Set Cover using k-means.
1: procedure COVER(P ) ⊲ P is the given point set
2: δ = 0.1 ⊲ threshold
3: k = 0 ⊲ k:Number of clusters
4: ε = 1 ⊲ ε:Fitting error
5: N = |P | ⊲ N: no. of points in P
6: while ε >= δ do
7: k+ = 1 ⊲ Increment number of clusters
8: C = kmeans(P ,k);
9: N
cov
= 0 ⊲ N
cov
:#pixels covered
10: A
ell
= 0 ⊲ A
ell
:area of fitted ellipses
11: for i = 1 → k do
12: E
i
= FitEllipse(C
i
)
13: N
cov
= N
cov
+ AreaCovered(C
i
,E
i
)
14: A
ell
= A
ell
+ Area(E
i
)
15: end for
16: ε =
A
ell
N
cov
17: end while
18: end procedure
represent the region more accurately, which progres-
sively decreases the error of the fit (ε).
3.4 Comparing Descriptors
Given two descriptors, the similarity score is com-
puted by accumulating the extent of overlap of the el-
lipses of the correspondingbins. The overlap between
two ellipses is computed using the method discussed
in Section 3.1.1.
Algorithm 3 describes the steps involved in com-
paring two descriptors. Here D
(.)
i, j
refers to the el-
lipse fitted to the j
th
connected region belonging to
the i
th
bin; GetOverlap(E
1
,E
2
) computes the amount
of overlap between the ellipses E
1
and E
2
.
Before computing the similarity of a pair of de-
scriptors, the ellipses comprising a descriptor are ro-
tated along the characteristic orientation of the IR of
the descriptor, which is obtained by finding the dom-
inant orientations in the Histogram of Gradients con-
structed for the IR (Lowe, 2004). To achieve scale in-
variance, the ellipses are mapped to a circular region
of unit radius.
Algorithm 3: Comparing Descriptors.
1: procedure ov = COMPARE(D
(1)
,D
(2)
)
2: n ← numOfBins(D
(1)
)
3: ov ← 0 ⊲ overlap
4: for bin=1 ... n do
5: for reg
1
=1 ... |K
(1)
bin
| do
6: E
1
← D
(1)
bin,reg
1
7: for reg
2
=1 ... |K
(2)
bin
| do
8: E
2
← D
(2)
bin,reg
2
9: ov ← ov + GetOverlap(E
1
,E
2
)
10: end for
11: end for
12: end for
13: end procedure
3.5 Splitting the Intensity Range
The binning of pixel intensities can be done using
three methods, viz., hard binning, rank based binning
and soft binning.
Hard binning: If n represents the number of bins
used for quantization and the intensity range of the
interest region is from a to b, then the size of each bin
is
b−a
n
.
Rank method: Let N be the number of pixels in
the connected region. The intensities of the neigh-
borhood pixels are first sorted and the intensity of ev-
ery (N/n)
th
element in the sorted list defines the bin
boundary.
Soft binning: In the aforementioned binning meth-
ods, the intensity of a pixel takes an integral value
and can belong to only one bin. We relax this con-
straint and allow the pixel to belong to more than one
bin. The membership of the pixel to a particular bin
is weighed by the distance from the center of the bin.
It should be noted that a pixel can belong to at most
two bins. The weight W for a pixel p is calculated as:
W(p) = 1−
|I
p
− I
b
|
S
b
(4)
Here I
p
is the intensity of the pixel p, I
b
denotes the
center of bin and S
b
denotes the bin width. The weight
ICPRAM2014-InternationalConferenceonPatternRecognitionApplicationsandMethods
100
ranges from 0 to 1, with 0 specifying that the pixel
does not belong to that bin and 1 indicating that the
pixel intensity lies exactly at the bin center in which
case it belongs to only that bin.
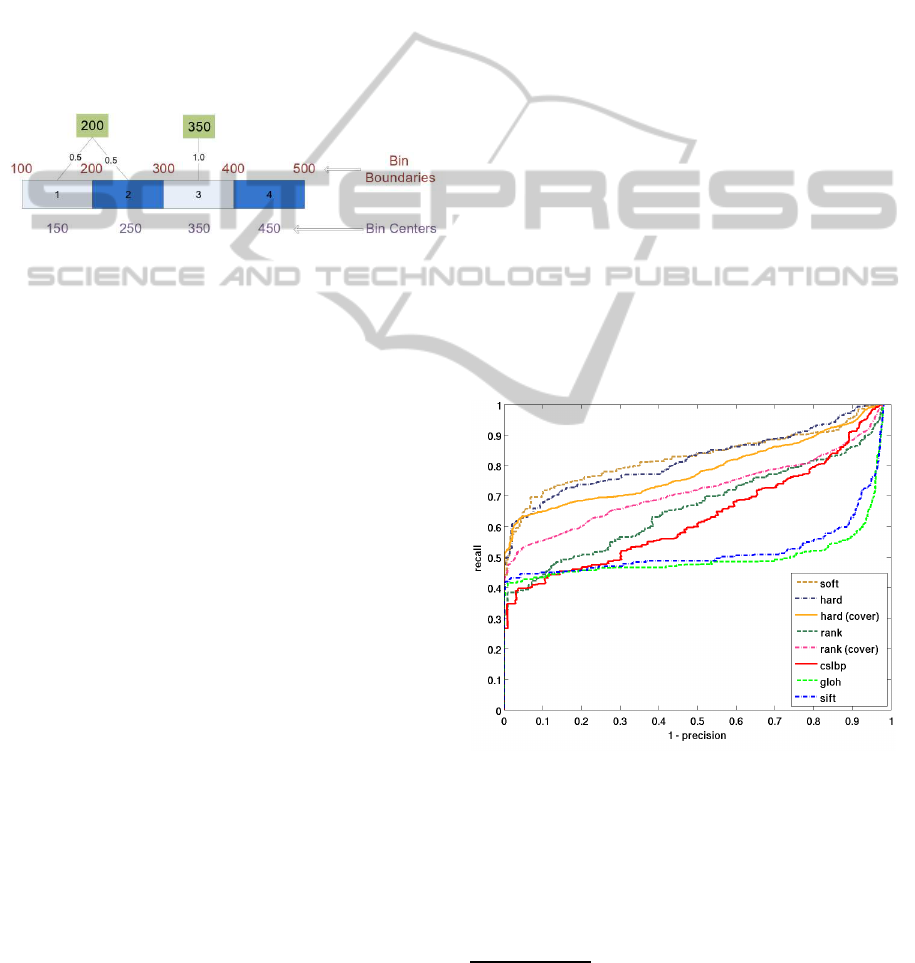
For example, say, the intensity range of a region is
101-500 and we need a 4-way split. The centers of the
bins will be 150, 250, 350 and 450. A pixel with in-
tensity 200, bordering on the boundary between bins
1 and 2, will belong to both the bins 1 and 2, with the
weights being 0.5 and 0.5 respectively. A pixel with
value 350 will belong to bin 3 with the weight of 1. A
pixel with value 175 will belong to bins 1 and 2 and
the weights will be 0.75 and 0.25 respectively. This is
illustrated in Figure 5.
Figure 5: Illustration of the weight assignment to pixels us-
ing soft binning.
4 RESULTS
The descriptors are evaluated on Oxford data set
which is used to evaluate the performance of descrip-
tors when a scene undergoesphotometric and geomet-
ric deformations. The results are presented with re-
call versus 1-precision, as used in (Mikolajczyk and
Schmid, 2005). The protocol for evaluating the de-
scriptors is as follows. Let D
(i)
denote the descriptors
belonging to image i.
1. Given an image pair, we extract the IRs using
Hessian-Affine detector from both images and
compute the descriptor for each IR.
2. Potential matches: For a descriptor d
i
in D
(1)
, the
descriptor d
j
∈ D
(2)
is a potential match if their
similarity is greater than a threshold σ. The sim-
ilarity measure is the standard Euclidean distance
in case of SIFT, GLOH and CS-LBP.
3. Ground Truth: A descriptor d
2
∈ D
(2)
is said to
correspond to d
1
∈ D
(1)
if the overlap of IR of
d
1
with that of d
2
more than 50% (as outlined in
Section 3.1.1).
4. Correct matches: The overlap of the IR corre-
sponding to d
i
∈ D
(1)
with those of the potential
matches in D
(2)
is computed, using the method
outlined in Section 3.1.1 and the match is said to
be correct if the overlap is greater than 50%. It
should be noted that the correct matches for a de-
scriptor d
i
∈ D
(1)
are those descriptors d
j
∈ D
(2)
that are present in both the set of correspondences
and the set of potential matches.
5. Now the recall is given as the ratio of the num-
ber of correct matches to the total number of cor-
respondences and precision is given as the pro-
portion of correct matches among the potential
matches. For each value of σ, we compute (1-
precision) and recall, which are then used to gen-
erate the curves.
In our experiments, we compare the performance
of our descriptor with that of SIFT, GLOH
2
and CS-
LBP. The number of bins is fixed at 8 while construct-
ing the descriptors using all the three binning meth-
ods. The region covering algorithm (Cover) outlined
in Algorithm 2, was used with rank and hard binning
methods; the threshold δ for the ellipse fitting was set
at 0.1 and the maximum number of iterations for k-
means was set at 20. Figure 6 shows the performance
of the descriptors for various image deformations. It
should be noted that the region covering method was
used with rank and hard binning methods since the
connected regions belonging to the different bins can
be clearly demarcated with these binning methods.
The time taken for constructing the descriptor ranged
from 4.1s for 2 bins to 4.5s for 8 bins, where SIFT
and GLOH took 1.2s.
(a) Scaling+Rotation
Figure 6: Performance of the descriptors in the presence
of geometric deformation. Number of bins for our method
is fixed at 8 while constructing descriptors using all three
binning methods.
Figure 6 shows the performance of the descriptors
in case of geometric deformations, i.e., scaling and
rotation changes. The hard binning method performs
2
Binaries for SIFT and GLOH were obtained
from http://www.robots.ox.ac.uk/∼vgg/research/affine/
descriptors.html #binaries
ADescriptorbasedonIntensityBinningforImageMatching
101
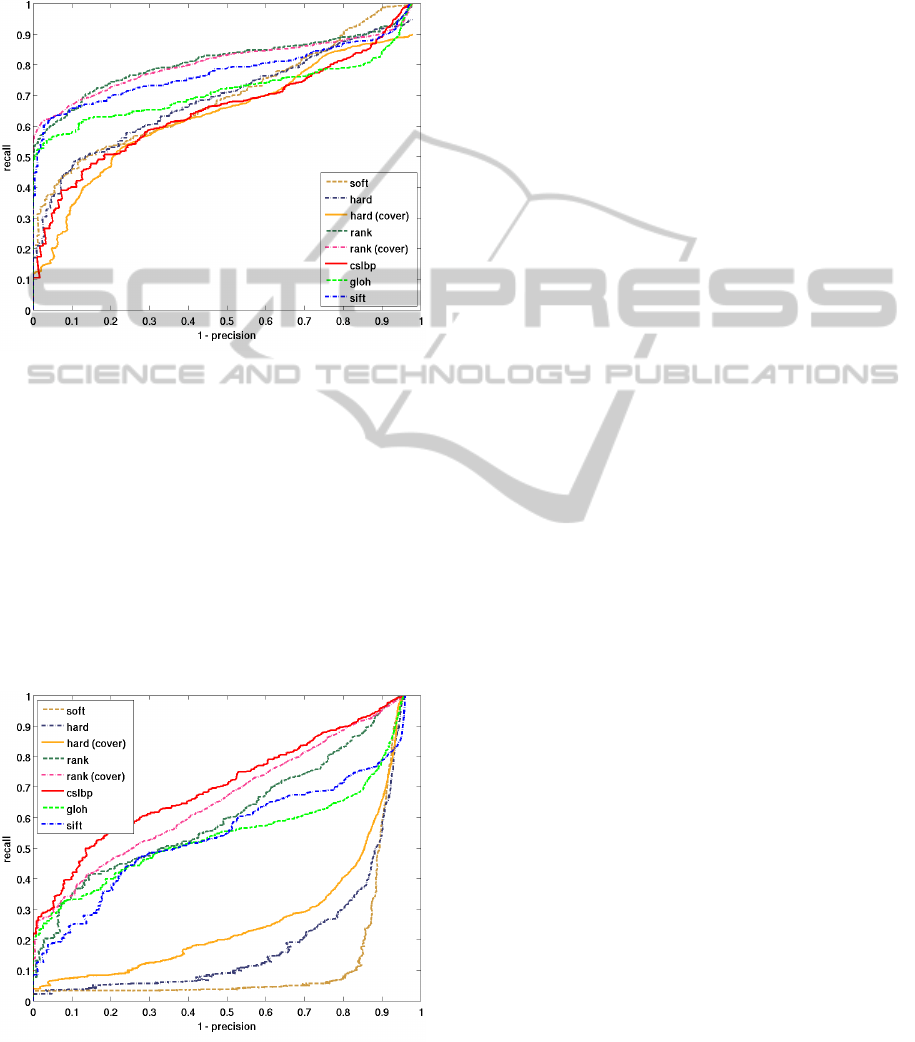
better than the rank based binning, since the inten-
sities of the IRs are not distorted under these defor-
mations. In this case, all the three binning methods
perform better than the existing state of the art meth-
ods.
Figure 7: Performance of the descriptors in the presence of
blur. Number of bins for our method is fixed at 8 while
constructing descriptors using all three binning methods.
Figure 7 shows the performance in case of blur.
The intensity maps of the corresponding IRs are con-
siderably more distorted when compared to geomet-
ric deformations. As is evident from the figure, rank
based binning works better than the other binning
methods. This can be attributed to the fact that the or-
der of the pixel intensities is not affected to a great de-
gree under these deformationsand thus the bin bound-
aries and the bin labels are less distorted when com-
pared to the other binning methods.
Figure 8: Performance of the descriptors in the presence
of nonlinear illumination changes. Number of bins for our
method is fixed at 8 while constructing descriptors using all
three binning methods.
Figure 8 shows the effect of nonlinear illumination
changes on the performance of the descriptors. In the
presence of illumination changes, CS-LBP is more ro-
bust than all of the descriptors, but then in this case,
the performance of our descriptor is at par.
In conclusion, the rank based binning method with
region covering performs better than its naive coun-
terpart and the other binning methods. It was found
that the accuracy of the proposed descriptor increases
as the number of bins (n) is increased from 2 bins
and saturates when the value is 8. This is because
the descriptor is a coarse representation of the under-
lying intensity map when n is 2 and the representa-
tion becomes finer with increasing n. But increasing
n beyond 8 was detrimental to the performance, be-
cause the width of the individual bins decreases with
increasing n and a slight distortion of the intensities
changes the bin labels of the pixels and deforms the n
map.
It is interesting to note that, in Figure 2, the pro-
portion of the pixels retaining the bin label is high
when the n is low. But, such n-maps are over general-
ized representations of the underlying IR and impair
the discriminative ability of the descriptor.
5 SUMMARY AND
CONCLUSIONS
In this paper, we have proposed a novel method for
constructing image descriptors, using intensity bin-
ning, which involvesquantization of the intensity map
of the interest regions and fitting ellipses to each con-
nected region of the bins obtained. We also pro-
posed a better representation of such binned intensity
maps using k-means. These approaches were evalu-
ated on images with commonly occurring image de-
formations. The experiments show that the proposed
descriptor is robust to photometric and geometric de-
formations and outperforms the current state of the
art methods. As we had shown, the optimal num-
ber of bins for quantization was chosen empirically.
A more principled way would be to choose the num-
ber of bins by closer inspection of topography of the
regions obtained across multiple quantization levels,
which would be a promising direction for improving
the proposed method.
REFERENCES
Agarwal, S., Snavely, N., Simon, I., Seitz, S., and Szeliski,
R. (2009). Building rome in a day. In IEEE Interna-
tional Conference on Computer Vision, pages 72–79.
ICPRAM2014-InternationalConferenceonPatternRecognitionApplicationsandMethods
102

Baumberg, A. (2000). Reliable feature matching across
widely separated views. In IEEE Conference on Com-
puter Vision and Pattern Recognition, pages 774–781.
Bay, H., Ess, A., Tuytelaars, T., and Van Gool, L. (2008).
Speeded-Up Robust Features (SURF). Computer Vi-
sion and Image Understanding, 110:346–359.
Berg, A., Berg, T., and Malik, J. (2005). Shape matching
and object recognition using low distortion correspon-
dences. In IEEE Conference on Computer Vision and
Pattern Recognition, pages 26–33.
Berg, A. and Malik, J. (2001). Geometric blur for template
matching. In Computer Vision and Pattern Recogni-
tion, 2001. CVPR 2001. Proceedings of the 2001 IEEE
Computer Society Conference on, volume 1, pages I–
607 – I–614 vol.1.
Brown, M., Hua, G., and Winder, S. (2011). Discriminative
learning of local image descriptors. IEEE Transac-
tions on Pattern Analysis and Machine Intelligence,
33(1):43–57.
Brown, M. and Lowe, D. G. (2003). Recognising panora-
mas. In IEEE International Conference on Computer
Vision, pages 1218–1225.
Chen, J., Shan, S., He, C., Zhao, G., Pietikainen, M., Chen,
X., and Gao, W. (2010). WLD: A robust local im-
age descriptor. IEEE Transactions on Pattern Analysis
and Machine Intelligence, 32(9):1705 –1720.
Cheng, H., Liu, Z., Zheng, N., and Yang, J. (2008). A de-
formable local image descriptor. In Computer Vision
and Pattern Recognition, 2008. CVPR 2008. IEEE
Conference on, pages 1 –8.
Fergus, R., Perona, P., and Zisserman, A. (2003). Ob-
ject class recognition by unsupervised scale-invariant
learning. In IEEE Conference on Computer Vision and
Pattern Recognition, pages 264–271.
Freeman, W. and Adelson, E. (1991). The design and use of
steerable filters. IEEE Transactions on Pattern Analy-
sis and Machine Intelligence, 13(9):891–906.
Harris, C. and Stephens, M. (1988). A combined corner
and edge detector. In Alvey vision conference, pages
147–152.
Heikkil, M., Pietikinen, M., and Schmid, C. (2009). De-
scription of interest regions with local binary patterns.
Pattern Recognition, 42(3):425–436.
Johnson, A. E. and Hebert, M. (1997). Recognizing objects
by matching oriented points. In IEEE Conference on
Computer Vision and Pattern Recognition, pages 684–
689.
Ke, Y. and Sukthankar, R. (2004). PCA-SIFT: A more
distinctive representation for local image descriptors.
In IEEE Conference on Computer Vision and Pattern
Recognition.
Kennedy, L. S. and Naaman, M. (2008). Generating di-
verse and representative image search results for land-
marks. In International Conference on World Wide
Web, pages 297–306.
Lazebnik, S., Schmid, C., and Ponce, J. (2005). A
sparse texture representation using local affine re-
gions. PAMI, 27(8):1265–1278.
Leibe, B., Leonardis, A., and Schiele, B. (2008). Robust ob-
ject detection with interleaved categorization and seg-
mentation. International Journal of Computer Vision,
77(1-3):259–289.
Lowe, D. G. (2004). Distinctive image features from scale-
invariant keypoints. International Journal of Com-
puter Vision, 60(2):91–110.
Mikolajczyk, K. and Schmid, C. (2001). Indexing based on
scale invariant interest points. In IEEE International
Conference on Computer Vision, pages 525–531.
Mikolajczyk, K. and Schmid, C. (2005). A perfor-
mance evaluation of local descriptors. IEEE Trans-
actions on Pattern Analysis and Machine Intelligence,
27(10):1615–1630.
Mikolajczyk, K., Tuytelaars, T., Schmid, C., Zisserman, A.,
Matas, J., Schaffalitzky, F., Kadir, T., and Gool, L.
(2005). A comparison of affine region detectors. In-
ternational Journal of Computer Vision, 65(1):43–72.
Nister, D. and Stewenius, H. (2006). Scalable recognition
with a vocabulary tree. In IEEE Conference on Com-
puter Vision and Pattern Recognition, pages 2161–
2168.
Snavely, N., Seitz, S., and Szeliski, R. (2008). Modeling the
world from internet photo collections. International
Journal of Computer Vision, 80(2):189–210.
Tuytelaars, T. and Mikolajczyk, K. (2008). Local invariant
feature detectors: A survey. Foundations and Trends
in Computer Graphics and Vision, 3(3):177–280.
Tuytelaars, T. and Van Gool, L. (2004). Matching widely
separated views based on affine invariant regions. In-
ternational Journal of Computer Vision, 59(1):61–85.
Viola, P. and Jones, M. J. (2004). Robust real-time face
detection. International Journal of Computer Vision,
57:137–154.
Zhang, J., Marszalek, M., Lazebnik, S., and Schmid, C.
(2007). Local features and kernels for classification of
texture and object categories: A comprehensive study.
International Journal of Computer Vision, 73:213–
238.
ADescriptorbasedonIntensityBinningforImageMatching
103
