
Text Line Aggregation
Christopher Beck
1
, Alan Broun
2
Majid Mirmehdi
1
, Tony Pipe
2
and Chris Melhuish
2
1
Visual Information Laboratory, University of Bristol, Bristol, U.K.
2
Bristol Robotics Laboratory, University of the West of England, Bristol, U.K.
Keywords:
Text Aggregation, Line Construction, Text Detection.
Abstract:
We present a new approach to text line aggregation that can work as both a line formation stage for a myriad
of text segmentation methods (over all orientations) and as an extra level of filtering to remove false text
candidates. The proposed method is centred on the processing of candidate text components based on local
and global measures. We use orientation histograms to build an understanding of paragraphs, and filter noise
and construct lines based on the discovery of prominent orientations. Paragraphs are then reduced to seed
components and lines are reconstructed around these components. We demonstrate results for text aggregation
on the ICDAR 2003 Robust Reading Competition data, and also present results on our own more complex data
set.
1 INTRODUCTION
Text localization in natural scenes requires many chal-
lenging steps to produce successful results, including
the detection of candidate regions (or components),
filtering and removal of noisy regions, aggregation
into groups, recovery of perspective view, and finally
recognition. Figure 1 shows a schematic of this pro-
cessing pipeline. The focus of our work here is on
the text aggregation stage: the coherent sorting, fil-
tering, and grouping of text regions (produced by any
method in an earlier text detection stage that returns
candidate text regions) into blocks and lines, i.e. un-
derstanding how text components are laid out in the
scene by determining which candidate regions form
individual lines. We work on the assumption that text
appears in straight lines and contains three or more
characters.
The common trend at the start of the text localiza-
tion pipeline is the use of a segmentation method to
produce connected components, such as (Le
´
on et al.,
2005; Merino and Mirmehdi, 2007; Zini et al., 2009;
Epshtein et al., 2010; Pan et al., 2011; Neumann and
Matas, 2011b; Merino-Gracia et al., 2011). A se-
ries of geometric filters are then applied, for exam-
ple height, width, aspect ratio, density, roughness and
hole count, to remove the majority of non-text com-
ponents, e.g. as in (Neumann and Matas, 2011b;
Merino-Gracia et al., 2011). These filters can have
a large effect on the outcome of the system - too
strict and text is lost, too slack and system noise is
increased. Such outputs at this stage of the pipeline
would serve as input into our proposed text aggrega-
tion approach.
Text is often contained within structured lines
while non-text components often form unstructured
and chaotic groupings. The proposed method looks to
exploit this structure to filter out false candidate text
regions. For the purposes of this work, a component
is a segmented part of an input image and is stored
as a list of pixels, along with its average colour value,
and its width and height. A paragraph is defined as
a collection of components based on their geomet-
ric similarities. Under this definition, a paragraph
may contain one or more components of text and/or
noise. We first look to group components into para-
graphs, and then based on local and global measures
of the paragraph, we reduce them to Line Seed Com-
ponents (LSC) where later lines can be formed based
on these seed component regions. Finally, compo-
nents removed in earlier stages are reintroduced back
into the line as long as certain compatibility criteria
are satisfied.
Next in Section 2, we briefly explore some previ-
ous attempts at text line aggregation. The proposed
method is presented in Section 3, followed by our ex-
periments and results in Section 4. The conclusions
of the work are in Section 5.
393
Beck C., Broun A., Mirmehdi M., Pipe T. and Melhuish C..
Text Line Aggregation.
DOI: 10.5220/0004817903930401
In Proceedings of the 3rd International Conference on Pattern Recognition Applications and Methods (ICPRAM-2014), pages 393-401
ISBN: 978-989-758-018-5
Copyright
c
2014 SCITEPRESS (Science and Technology Publications, Lda.)
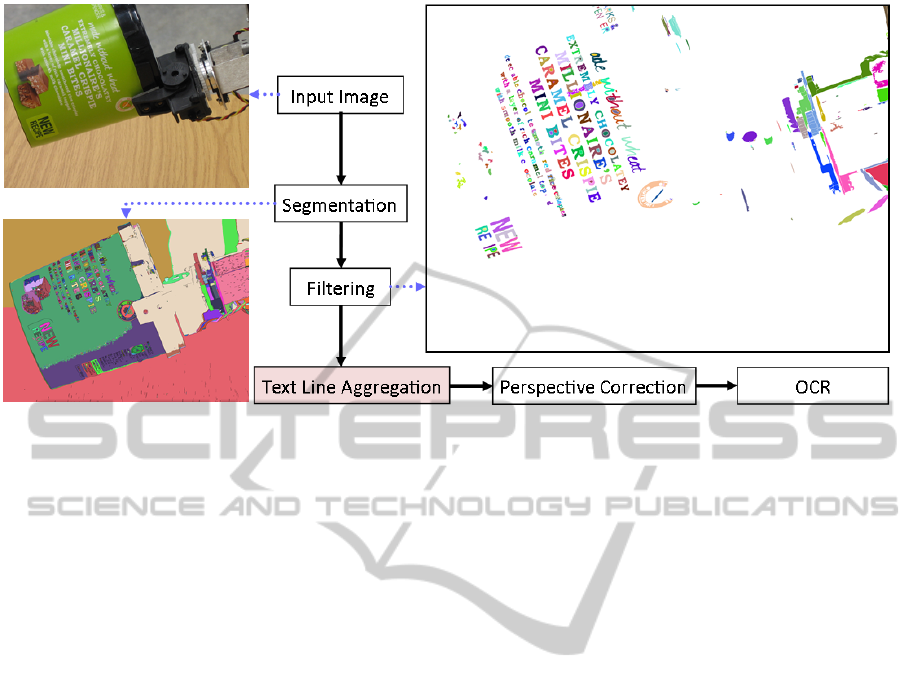
Figure 1: Schematic of a typical text localization method including a text line aggregation step which is the focus of our work.
2 RELATED WORK
A substantial amount of work has been carried out
in text region localization in everyday scenes (Pilu,
2001; Chen et al., 2004; Chen and Yuille, 2004;
Le
´
on et al., 2005; Liu and Samarabandu, 2005; Liu
et al., 2005; Liu and Samarabandu, 2006; Fu et al.,
2005; Merino and Mirmehdi, 2007; Retornaz and
Marcotegui, 2007; Lintern, 2008; Jung et al., 2009;
Zini et al., 2009; Epshtein et al., 2010; Zhang et al.,
2010; Pratheeba et al., 2010; Chen et al., 2011; Yi and
Tian, 2011; Pan et al., 2011; Neumann and Matas,
2011a; Neumann and Matas, 2011b; Merino-Gracia
et al., 2011), with many of them explicitly dealing
with the text aggregation stage, such as (Pilu, 2001;
Retornaz and Marcotegui, 2007; Epshtein et al., 2010;
Neumann and Matas, 2011a; Chen et al., 2011; Pan
et al., 2011; Merino-Gracia et al., 2011), although of-
ten other terminology was used for it, such as word
or line formation. We now focus our review on these
specific works, especially as we use several of them
for comparative analysis.
An early, but still widely used, method is pair-
wise formation, e.g. as used by Pilu (Pilu, 2001),
Epshtein et al. (Epshtein et al., 2010), and Chen et
al. (Chen et al., 2011). The method assumes that
text appears in a linear form, and text characters on a
line have similar features, such as height, width, and
colour. Components are considered to be a pair if they
are close in proximity, colour, size, and stroke infor-
mation (noting that (Pilu, 2001) does not use stroke
information). Pairs are merged into strings if they
share a component with another pair that appears in
the same linear direction (below an orientation thresh-
old), where linear direction is the gradient of the line
formed between two paired components. No informa-
tion is shared globally across the entire string. Based
on words being formed by separate unjoined charac-
ters, strings with at least three components or more
are kept and broken into words based on a measure
of spread for the components in the direction of the
string. The lack of global information and known ori-
entations in the pairing and merging of component
regions means the pairwise formation method is af-
fected by the order in which the components are sam-
pled.
Retornaz and Marcotegui (Retornaz and Mar-
cotegui, 2007) implement a similar method to the
pairwise formation philosophy, based on two main
steps, merging and alignment. Components are first
merged into groups based on three criteria: ratio
of bounding box height, and the distances between
bounding box’s centre in both the vertical and hori-
zontal directions. The groups are encapsulated within
a new bounding box that is extended in the horizon-
tal direction for a given distance. If a newly formed
box encases another group of components, and which
match the three merging criteria, the new group is
added, and the process then repeats with a new bound-
ing box. The method is inefficient at removing non-
text components, because slanted text lines lead to
large bounding boxes that overpower surrounding ar-
eas, and introduce a significant level of noise. The
method only solves for horizontally laid out text.
Region Graph methods treat components as indi-
vidual nodes, with links signifying a potential join be-
ICPRAM2014-InternationalConferenceonPatternRecognitionApplicationsandMethods
394

(a) Paragraph Formation (b) Paragraph Analysis (c) Line Construction (d) Output
Figure 2: Various stages of the proposed text aggregation method (the input text components are shown in Figure 1(top right)).
tween components. Then, filtering the links based on
geometric measures produces words and text lines.
There are numerous ways to decide whether nodes
should be joined by a link. Neumann and Matas (Neu-
mann and Matas, 2011a) form the links by joining
each component to the three nearest components on
the right, while rejecting links that are in a direction of
over 40
o
to the normal. Links are removed based on
an energy minimization function that uses distance,
height ratio, and link angle. The final minimum en-
ergy graph will contain separate lines of nodes that
represent text lines. Merino et al. (Merino-Gracia
et al., 2011) also use a region graph, but they im-
plement a Delaunay graph to form links. No min-
imization is carried out, and instead links are re-
moved based on (a) their angle to the normal (between
±45
o
), (b) link length based on component bounding
box, and (c) ratio of component size. Unlike Neu-
mann and Matas (Neumann and Matas, 2011a) who
try to minimize the energy, no information is shared
across the string as a whole, but only in local pockets.
Both (Neumann and Matas, 2011a; Merino-Gracia
et al., 2011) are limited to a certain range of orien-
tations, but their work is aimed at text that is horizon-
tal or with a relatively small slope and they focus on
the types of images present in databases like ICDAR
2003 (Lucas et al., 2003).
Pang et al. (Pan et al., 2011) consider oriented
text by employing a minimum spanning tree (MST)
approach to produce the region graph. They use
the Kruskal algorithm (Sedgewick, 2002) to form
the tree, and then like (Neumann and Matas, 2011a)
look to minimize the graph energy to form text lines.
However, unlike (Neumann and Matas, 2011a) and
(Merino-Gracia et al., 2011) who use the angle of ori-
entation in the minimization process, Pang et al. (Pan
et al., 2011) do not, and in return are not restricted
in the range of text orientations their system can han-
dle. Instead, their system uses line regression error,
cut score, line height, spatial distance, bounding box
distance, and line number to reduce the graph down to
lines. The downside to the unrestricted angle of ori-
entation here is the lack of shared orientation infor-
mation across the group as a whole. This can result in
the acceptance of groups that display weak structural
formations that are typically present in false positive
regions.
Currently, the state-of-the-art methods look to ag-
gregate components into groups based on some form
of chaining rule, and then preform some filtering on
a local scale to reduce the chains into lines or words.
This approach is acceptable when the text is known
to be horizontal, or reducing noise is not an issue, but
when the orientation is unknown, the methods strug-
gle to produce lines. We hypothesize that a global
approach to exploring and removing links from the
initial group will solve the unknown orientation prob-
lem. This hypothesis is constructed around the prin-
ciple of forming structured paragraphs from a simple
grouping algorithm and then exploiting the structure
within the paragraph to build lines.
3 PROPOSED METHOD
Our approach to text aggregation comprises three
distinct processes, Paragraph Formation, Paragraph
Analysis, and Line Construction (e.g. as in Figure
2(a), 2(b), and 2(c) respectively) and these stages are
described in detail below.
The input for the system is an unsorted list of com-
ponents (e.g. Figure 1(top right)), where each com-
ponent C
i
is represented by a list of pixels, average
colour value, and width and height, i.e. {L
i
,µ
i
,w
i
,h
i
}
respectively. For paragraph formation, we use a sim-
ilar geometric grouping method as (Pilu, 2001; Re-
tornaz and Marcotegui, 2007; Epshtein et al., 2010;
Chen et al., 2011) to produce an initial clustering
of components. We do not assume that any group
formed during this stage contains text, but only forms
a cluster of similar components, be it text, noise or a
mixture of the two. Then, we analyse the paragraphs
on both a local component level and on a global level
across the group as a whole. This analysis attempts
to find the dominant orientation in the group and re-
moves uncompromising components. Finally, for line
construction, we use the remaining components to
form new lines based around known orientations and
TextLineAggregation
395

the idea of a search alley. Components lost in earlier
stages are reintroduced if necessary and broken lines
are merged.
3.1 Paragraph Formation
Text components within a paragraph often share cer-
tain physical similarities, such as proximity, size and
colour. We group components based on these at-
tributes and a component is accepted into a paragraph
P if it matches sufficiently well with any of its con-
stituent components across all these attributes. The
quality of the match is determined by three thresholds
(see δ, α, and ϕ below) which are determined em-
pirically and set to constants for all our experiments.
Stray non-text components within a paragraph usually
do not fit a uniform pattern set by the majority of its
text components and will be removed in later steps.
Proximity - Components must be within close spa-
tial proximity to each other to be considered within
the same paragraph P. Given components C
i
and C
j
,
then (∆x,∆y) is the difference in mean location of both
components, such that
∆x < (w
i
∗δ)+(w
j
∗δ) and ∆y < (h
i
∗δ)+(h
j
∗δ),
(1)
where δ is the distance weight. This differs from
Ezaki et al. ’s proximity measure (Ezaki et al., 2004)
by using the combined bounding box measurements
rather than the maximum, because this reduces the
influence of large components on small neighboring
components.
Size - In general, text characters in a line will share
similar height and width values, and so we compare
height/width to aid further filtering during the forma-
tion stage. A component C
i
is compared to its closest
neighboring component C
j
from the test paragraph P
with
min(h
i
,h
j
)/max(h
i
,h
j
) < α
min(w
i
,w
j
)/max(w
i
,w
j
) < α
(2)
where α is a constant.
Colour - Each component has an average colour
value, µ
i
, and each paragraph has an average colour
value, µ
P
, which is updated as new components join.
Components must be within a set range for each
colour to be allowed in the paragraph. Given ϕ as the
colour difference threshold, then component C
i
joins
paragraph P if:
ϕ > |µ
i
− µ
P
| (3)
Components are tested from left to right across the
image, and we assume illumination variations can be
ignored due to small distances between components
in paragraphs. RGB values have been used in this
work.
3.2 Paragraph Analysis
Each component is measured to produce a local un-
derstanding that leads to a basic global knowledge of
the whole paragraph. The dual analysis of local and
global characteristics allows for an aggressive filter
that rejects noise (non-text) components, but main-
tains strong text like components (LSCs) that later
will form the foundation for line construction.
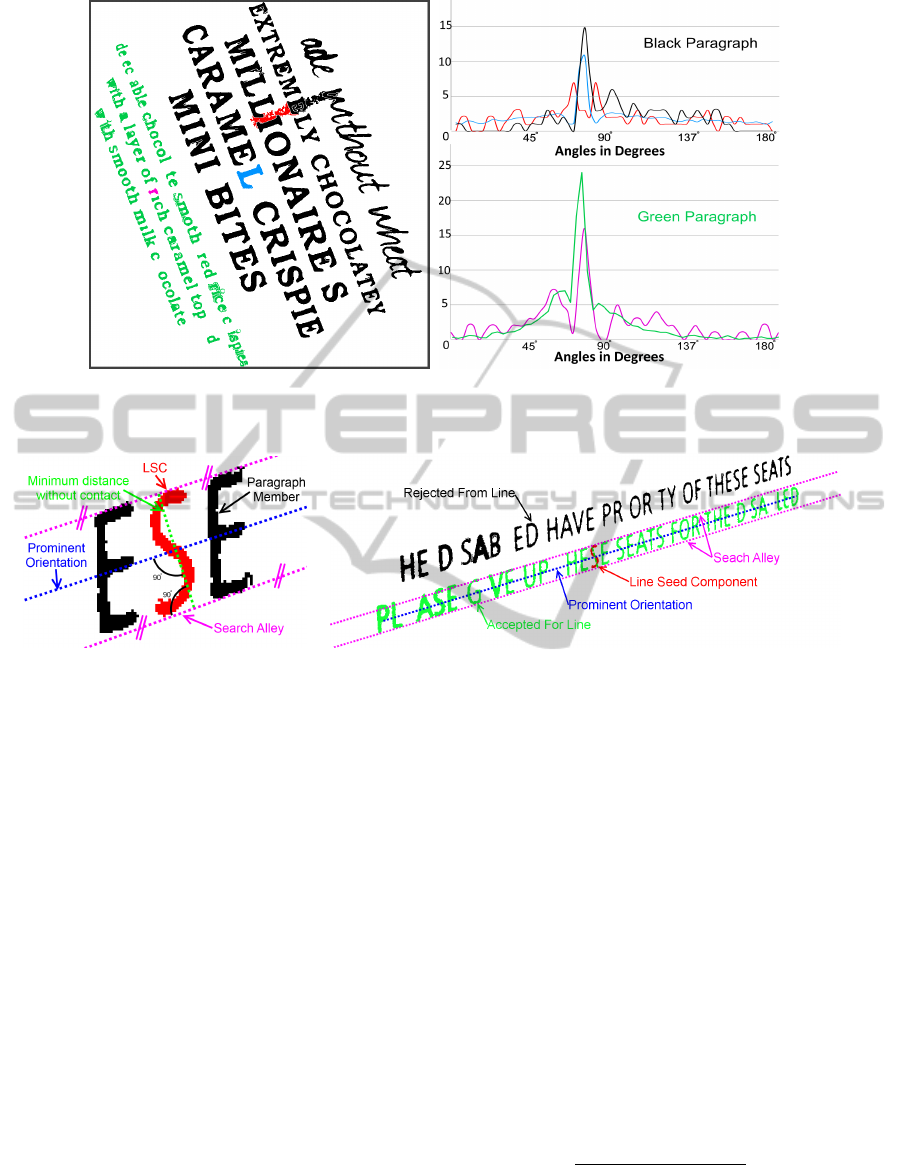
Local Measures - Two measures are produced from
the local analysis. First, a mode orientation value ν is
computed for each component by histogramming the
angle of the vectors from its centroid to the centroid
of every other component in P. These orientation an-
gles are normalized to be between 0
◦
-180
◦
to reduce
the effects of components that lie on a line either side
of the current component. We use a histogram with
bin width ξ = 6
◦
. Figure 3(a) shows two paragraphs
in black and green with three highlighted components
(‘L’, a noise region, and ‘r’). Figure 3(b) shows the
corresponding histograms for the three highlighted
components and for each whole paragraph (averaged
across its respective components). The overall orien-
tation of the paragraphs are clearly visible from the
dominant peaks.
Next, the orientation variance is first found for
each component by normalizing the orientations of all
other components onto a unit circle. The normaliza-
tion ensures that components that lie 90
◦
apart when
measured from the centroid of the current component
cancel across the unit circle, while components that
appear 180
◦
apart compared to the current component
lie in the same location on the unit circle. The confi-
dence value κ is then computed, as a second measure,
as the displacement of the average locations from the
centre of the circle, and its value will be between 0
and 1.
Global Measures - The paragraph orientation P
ν
is
the highest scoring bin obtained by histogramming all
the local mode values ν weighted by their correspond-
ing confidence value κ into a similar histogram as that
used above. The paragraph confidence value P
κ
is the
average of all the confidence values that contributed
to the winning histogram bin, and its value will be
between 0-1.
Once the local and global measures are available,
paragraph confidence values P
κ
below a generous
threshold are removed altogether as noise paragraphs.
Then, each component in the remaining paragraphs
must have a local orientation within a bin width ξ of
its own paragraph’s orientation P
ν
, otherwise it is re-
moved from that paragraph, but remains a member of
it for later line construction purposes.
This filtering is a harsh step due to the fluctuation
ICPRAM2014-InternationalConferenceonPatternRecognitionApplicationsandMethods
396
(a) Two example paragraphs (b) Their orientation histograms
Figure 3: Example orientation histograms shown in corresponding colour: black for black paragraph, blue for component
region ‘L’, red for noise region, green for green paragraph, and pink for component region ‘r’.
(a) Search Alley Construction (b) Construction of Lines
Figure 4: The construction of a search alley and forming a line around a seed component.
in character heights and mean locations, and may re-
move a large portion of valid characters within a para-
graph. The remaining characters become Line Seed
Components or LSCs as defined earlier. There is no
limit on the number of LSCs produced - a paragraph
or line may be composed of all LSCs, but as will be
seen only one is required to form a line and to popu-
late it with components. This step has a high rejection
rate while producing LSCs.
3.3 Line Construction
Line Construction consists of three key stages. Seed
components are used to perform basic line forma-
tion with other members of the paragraph, lines are
merged with other lines from within and different
groups, and some originally removed components
that satisfy certain criteria are reintroduced along the
line.
Initial Formation - A seed component is randomly
chosen from the group of LSCs. Figure 4(a) shows
how a search alley is constructed from two lines par-
allel to the prominent orientation that have a mini-
mum perpendicular distance from each other but do
not touch the seed component. Figure 4(b) shows
the construction of lines around a LSC. The closest
component (including those from paragraph filtering
in the last step) whose mean location falls within the
alley is added to the line, and becomes the new seed.
The process is repeated until no new component is
added to the line. A new seed is then chosen from
the remaining LSCs in the paragraph and the whole
formation process is repeated for a new line until all
LSCs have been tested. A line must contain three or
more components after formation. A straight line is
fitted using least squares.
Line Merging - Two lines a and b are merged into one
if they share a similar gradient ∇, e.g. smaller than ξ
(the bin width):
|∇
a
− ∇
b
| < ξ (4)
They must also have ends in close spatial proximity
q
|x
a
− x
b
|
2
+ |y
a
− y
b
|
2
< Λ (5)
where Λ equals four times the value of the average
width of a component in paragraph P along the line.
TextLineAggregation
397
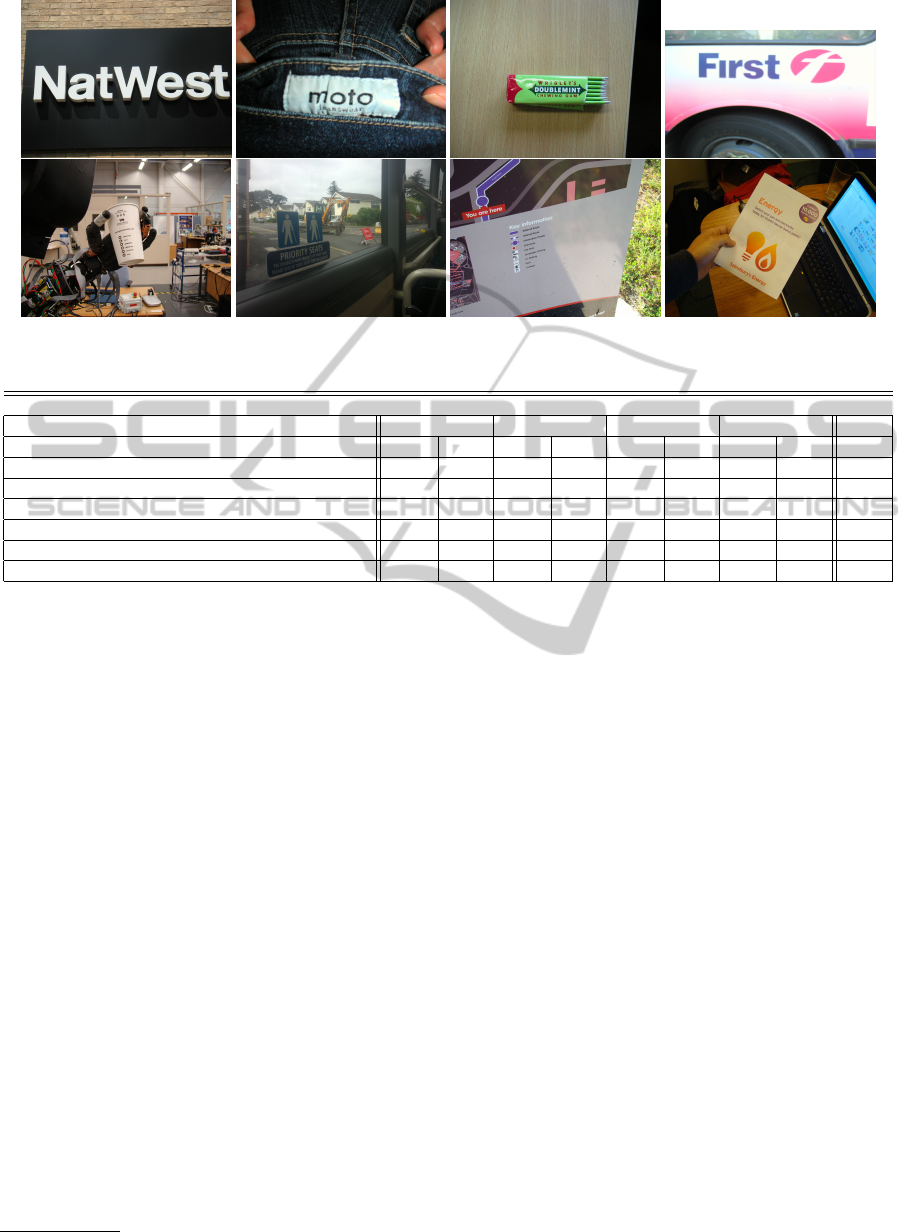
Figure 5: Examples from the (top row) ICDAR (Lucas et al., 2003) and (bottom row) Text-IVu 2014 Dataset.
Table 1: Comparative Precision/Recall results for the ICDAR data set.
ICDAR 2003 Robust Reading Competition Data
MSER SWT CCOM Manual t
Method Prec Rec Prec Rec Prec Rec Prec Rec (ms)
Pairwise (Pilu, 2001) 0.68 0.57 0.71 0.66 0.75 0.64 1.00 0.87 348
Merge & Align(Retornaz and Marcotegui, 2007) 0.51 0.46 0.51 0.46 0.47 0.49 1.00 0.81 509
Graph Energy (Neumann and Matas, 2011a) 0.61 0.58 0.67 0.55 0.59 0.60 1.00 0.88 714
MST (Pan et al., 2011) 0.72 0.68 0.78 0.70 0.69 0.64 1.00 0.92 948
Delaunay (Merino-Gracia et al., 2011) 0.55 0.63 0.64 0.60 0.58 0.67 1.00 0.82 325
Proposed method 0.66 0.66 0.73 0.68 0.65 0.64 1.00 0.89 957
Our evaluations showed 95% of split lines separated
by one or more missing characters are less than four
average widths apart. This split is often caused by
wide horizontal characters like ‘m’ or ‘w’ that lay be-
tween thin vertical characters like ‘i’ or ‘p’.
Component Reintroduction - Components rejected
earlier during the initial grouping or paragraph anal-
ysis stages are revisited and if any appear within a
line’s search alley and shares similar geometric values
(i.e. (2)) and colour values (i.e. (3)), and lies within
Λ, are added to the line.
4 EXPERIMENTS
Our method is applied to two different data sets, the
widely used ICDAR 2003 Robust Reading Competi-
tion Dataset (Lucas et al., 2003) and our own Text-IVu
2014 Dataset
1
. We use these two different data sets
because the ICDAR 2003 data set mostly contains sin-
gle word lines that are of a very limited range of ori-
entations and perspectives, while the Text-IVu 2014
Dataset covers a wide range of orientations, perspec-
tives and line lengths. The former is thus more suit-
able for methods that are tuned to a horizontal search
process, whereas the latter offers greater challenges.
1
www.brl.ac.uk/researchthemes/robotvision
The images in the ICDAR 2003 dataset (Lucas
et al., 2003) and the Text-IVu 2014 Dataset were
processed to generate candidate text components as
input into the proposed method for text aggregation
using four separate approaches: manually annotated
components, the maximally stable extermal regions
method (MSER) (Nist
´
er and Stew
´
enius, 2008), the
stroke width transform (SWT) (Epshtein et al., 2010),
and the classic connected components (CCOM). The
manually annotated images contain only true text
components, while the others include both text and
false positive non-text components.
We show precision and recall results on the
number of components recovered, and the average
computing time per image for each method.
ICDAR 2003 Robust Reading Competition Data
- The ICDAR 2003 data set (Lucas et al., 2003) is
a publicly available set of 251 images in a range of
sizes for the comparison of text localization methods
(e.g. see top row of Figure 5). It contains a variety of
images where text is the primary focus and dominates
much of the image with usually a single short text
string or region. Of the 251 images, only 10 can be
considered to contain text that neither lie close to the
horizontal plane nor are fronto-parallel to the camera,
i.e. 96% of the images contain horizontal text.
We compare our proposed method for text line
ICPRAM2014-InternationalConferenceonPatternRecognitionApplicationsandMethods
398
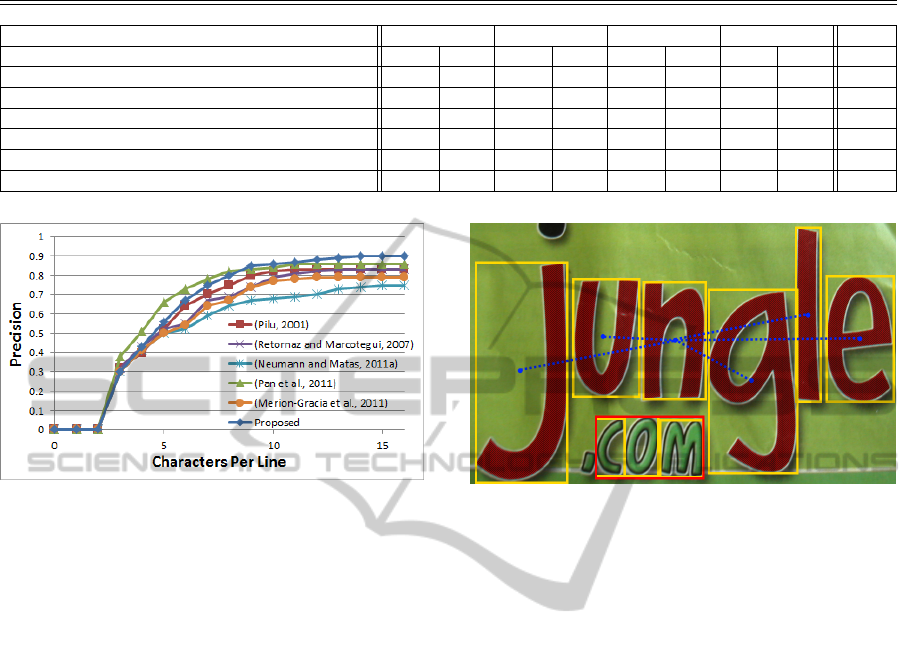
Table 2: Comparative Precision/Recall results for the Text-IVu 2014 Dataset.
Text-IVu 2014 Dataset
MSER SWT CCOM Manual t
Method Prec Rec Prec Rec Prec Rec Prec Rec (ms)
Pairwise (Pilu, 2001) 0.54 0.56 0.59 0.61 0.57 0.54 1.00 0.46 726
Merge & Align (Retornaz and Marcotegui, 2007) 0.48 0.44 0.47 0.38 0.43 0.41 1.00 0.48 781
Graph Energy (Neumann and Matas, 2011a) 0.35 0.37 0.43 0.41 0.38 0.36 1.00 0.40 1304
MST (Pan et al., 2011) 0.57 0.55 0.54 0.48 0.49 0.51 1.00 0.78 1550
Delaunay (Merino-Gracia et al., 2011) 0.41 0.38 0.42 0.40 0.38 0.45 1.00 0.43 517
Proposed method 0.60 0.64 0.61 0.63 0.62 0.57 1.00 0.80 1431
Figure 6: Precision rates for location compared against line
length.
aggregation against the text aggregation parts of five
different methods. These are our implementations
of Pilu (Pilu, 2001) (Pairwise), Retornaz and Beatriz
(Retornaz and Marcotegui, 2007) (Merge & Align),
Neumann and Matas (Neumann and Matas, 2011a)
(Graph energy), Merino et al. (Merino-Gracia et al.,
2011) (Delaunay), and Pang et al. (Pan et al., 2011)
(MST). Table 1 shows the results of all the different
aggregation methods on the ICDAR 2003 data set for
different segmentation methods.
As seen in Table 1, our method preforms well
against the other techniques, but it can be said to fall
short on the ICDAR data set due to the data’s com-
paratively small average line length of 8 components
per line. Figure 6 shows how all the methods exper-
imented with perform similarly on short line lengths
and see an increase in performance as the length in-
creases. Our method shows it is weaker on shorter
lengths, but dominates on the longer lengths. Shorter
line lengths do not produce enough data points in the
orientation histogram and so fail to establish a domi-
nant orientation. Figure 7 shows an example when our
method will fail, i.e. the word ”Jungle” is not found as
it produces a large range in angles and no conclusive
histogram bin value, whereas extreme outliers are less
of a problem in longer lines. The reliance on longer
lines allows the system to better handle noise and ori-
entations. Our approach is thus less suited to shorter
line lengths.
Figure 7: Failed word (”Jungle”) due to large variation in
angles. Note ”COM” is found in this case.
Text-IVu 2014 Dataset - The nature of the data in
this data set is quite different to that of the ICDAR
dataset (Lucas et al., 2003) in that it contains images
with substantially more text in larger groups and at
more varied orientations and perspectives (e.g. see
bottom row of Figure 5). For example, the scenes
in this data set are more likely to be encountered by
robots or blind users when holding objects with text
written on them. The data comprises of 50 colour
training images and 403 colour test images, all at var-
ious resolutions taken by several digital cameras in
both indoor and outdoor environments spanning a va-
riety of text sizes and orientations, and includes im-
ages affected by poor lighting conditions and specular
reflection. Approximately 20% of the Text-IVu 2014
Dataset contains text that lies close to the horizontal
plane and 35% of scenes contain multiple text orien-
tations.
Comparing Table 2 with the previous table, it be-
comes clear that all methods see a drop in perfor-
mance and an increase in computational expense due
to the more challenging nature of the Text-IVu 2014
Dataset. However, the proposed method is the best
performing method given any of the different segmen-
tation methods. The average line length in the Text-
IVu2014 Dataset is 27 components per line and this
means our system is better able to establish a dom-
inant orientation and so deals with complex scenes
TextLineAggregation
399
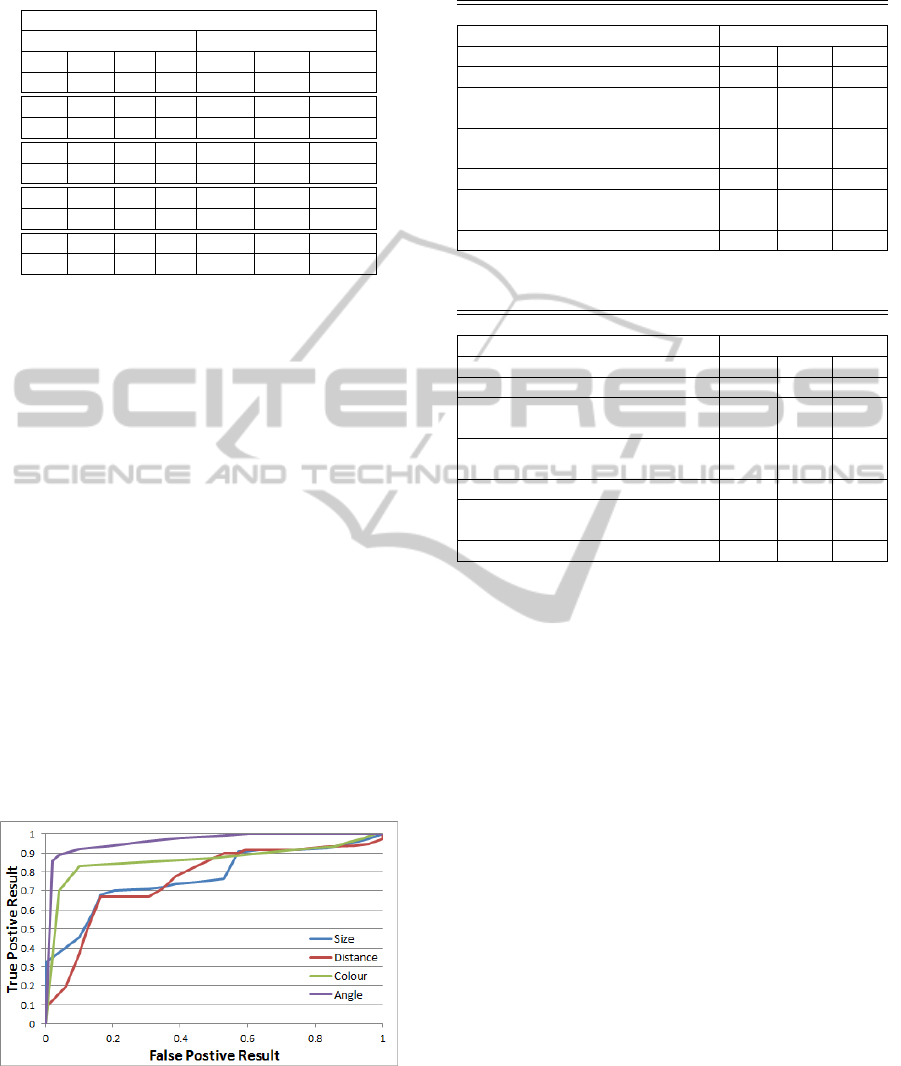
Table 3: Line accuracy for the Text-IVu 2014 Dataset.
Parameter Tuning for Proposed Method
Parameters Evaluators
δ α ϕ ξ Prec Rec t (ms)
1.6 1.5 50 6
◦
0.61 0.62 517
1.4 1.5 50 6
◦
0.62 0.58 504
1.8 1.5 50 6
◦
0.58 0.64 563
1.6 1.3 50 6
◦
0.63 0.59 511
1.6 1.7 50 6
◦
0.60 0.64 548
1.6 1.5 25 6
◦
0.64 0.52 480
1.6 1.5 75 6
◦
0.37 0.73 623
1.6 1.5 50 3
◦
0.63 0.51 498
1.6 1.5 50 9
◦
0.37 0.73 623
better than the other techniques. Over-compensating
for short lines will increase the recall of the system
but at a cost of the precision.
Parameter Tuning - For fairness of comparison and
despite the varied nature of the two data sets, the
threshold values in all methods were kept the same for
all experiments. The optimal value for each method
was determined empirically from the training sets
provided with the ICDAR 2003 data set (Lucas et al.,
2003) and the Text-IVu 2014 Dataset. The optimal
values for the proposed method were δ=1.6, α=1.5,
and ϕ=50. Table 3 shows the effect of changing one
parameter above or below the optimal value. Figure 8
is a normalised ROC graph that shows the classifica-
tion of components after the line formation for these
parameters. It should be noted that these paragraph
formation thresholds were set to be restrictive in their
grouping. Although this sees the rejection of true
components, it greatly reduces noise in later stages
and lost components can be retrieved after the con-
struction of lines.
Figure 8: ROC for parameter values from Text-IVu2014
training set.
Table 4 and Table 5 show precision, recall, and
accuracy values for text line construction for the IC-
DAR data set (Lucas et al., 2003) and Text-IVu 2014
Dataset respectively. Accuracy shows that for a given
Table 4: Line accuracy for the ICDAR data set.
ICDAR 2003 Robust Reading Competition Data
Line Accuracy
Method Prec Rec Acc
Pairwise (Pilu, 2001) 0.73 0.74 0.71
Merge & Align
(Retornaz and Marcotegui, 2007)
0.75 0.73 0.90
Graph Energy
(Neumann and Matas, 2011a)
0.63 0.66 0.70
MST (Pan et al., 2011) 0.65 0.77 0.71
Delaunay
(Merino-Gracia et al., 2011)
0.63 0.68 0.69
Proposed method 0.71 0.74 0.89
Table 5: Line accuracy for the Text-IVu 2014 Dataset.
Text-IVu 2014 Dataset
Line Accuracy
Method Prec Rec Acc
Pairwise (Pilu, 2001) 0.67 0.73 0.65
Merge & Align
(Retornaz and Marcotegui, 2007)
0.61 0.58 0.80
Graph Energy
(Neumann and Matas, 2011a)
0.54 0.61 0.55
MST (Pan et al., 2011) 0.61 0.74 0.58
Delaunay
(Merino-Gracia et al., 2011)
0.56 0.64 0.67
Proposed method 0.74 0.78 0.86
line what proportion of its characters have been re-
covered.
For the ICDAR data in Table 4, Retornaz and
Beatriz (Retornaz and Marcotegui, 2007) obtain only
a marginally better accuracy of 0.90 than the proposed
method at 0.89, while in terms of precision and recall,
we stand we compare well against the other methods.
For the Text-IVu 2014 Dataset in Table 5, our method
exceeds all others by a good margin due to its better
handling of unknown orientations and the recovery of
lost characters that lie on the outer edges of groups.
5 CONCLUSIONS
Text line aggregation is a challenging problem due to
the varying styles of text and layouts within an uncon-
strained natural scene. We have presented a method
that is capable of dealing with complex scenes con-
taining a large variety of text at various orientations.
It is suitable as a plug-in module to a range of text seg-
mentation systems. We have introduced the Text-IVu
2014 dataset which is more challenging, complex and
truer to real life situations compared to the ICDAR
2003 Robust Reading Competition Data. The sys-
tem is still constrained by the assumptions of straight
lines, and the number of text components per line.
ICPRAM2014-InternationalConferenceonPatternRecognitionApplicationsandMethods
400

These are issues we hope to address in future work.
REFERENCES
Chen, H., Tsai, S., Schroth, G., Chen, D., Grzeszczuk, R.,
and Girod, B. (2011). Robust text detection in natu-
ral images with edge-enhanced maximally stable ex-
tremal regions. In ICIP, pages 2609 – 2612.
Chen, X., Yang, J., Zhang, J., and Waibel, A. (2004). Auto-
matic detection and recognition of signs from natural
scenes. In ICIP.
Chen, X. and Yuille, A. (2004). Detecting and reading text
in natural scenes. In CVPR, volume 2, pages II – 366.
Epshtein, B., Ofek, E., and Wexler, Y. (2010). Detecting
text in natural scenes with stroke width transform. In
CVPR, pages 2963–2970.
Ezaki, N., Bulacu, M., and Schomaker, L. (2004). Text
detection from natural scene images: towards a sys-
tem for visually impaired persons. In ICPR, volume 2,
pages 683 – 686.
Fu, L., Wang, W., and Zhan, Y. (2005). A robust text seg-
mentation approach in complex background based on
multiple constraints. In AMIP-PMC, pages 594 – 605.
Jung, C., Liu, Q., and Kim, J. (2009). A stroke filter and its
application to text localization. In PRL, volume 30,
pages 114 – 122.
Le
´
on, M., Mallo, S., and Gasull, A. (2005). A tree
structured-based caption text detection approach. In
ICVIPP, page 220.
Lintern, J. (2008). Recognizing text in Google Street View
images. Statistics, 6.
Liu, X. and Samarabandu, J. (2005). An edge-based text re-
gion extraction algorithm for indoor mobile robot nav-
igation. In ICMA, volume 2, pages 701 – 706.
Liu, X. and Samarabandu, J. (2006). Multiscale edge-based
text extraction from complex images. In ICME, pages
1721 – 1724.
Liu, Y., Goto, S., and Ikenaga, T. (2005). A robust algorithm
for text detection in color images. In ICDAR, pages
399 – 403.
Lucas, S. M., Panaretos, A., Sosa, L., Tang, A., Wong, S.,
and Young, R. (2003). ICDAR 2003 robust reading
competitions. In ICDAR.
Merino, C. and Mirmehdi, M. (2007). A framework towards
realtime detection and tracking of text. In CBDAR,
pages 10 – 17.
Merino-Gracia, C., Lenc, K., and Mirmehdi, M. (2011). A
head-mounted device for recognizing text in natural
scenes. In CBDAR, pages 29 – 41.
Neumann, L. and Matas, J. (2011a). Estimating hidden pa-
rameters for text localization and recognition. In Com-
puter Vision Winter Workshop.
Neumann, L. and Matas, J. (2011b). A method for text lo-
calization and recognition in real-world images. In
ACCV, pages 770 – 783.
Nist
´
er, D. and Stew
´
enius, H. (2008). Linear time maximally
stable extremal regions. In ECCV, pages 183 – 196.
Pan, Y., Hou, X., and Liu, C. (2011). A hybrid approach
to detect and localize texts in natural scene images.
Image Processing, IEEE Transactions on, 20(3):800 –
813.
Pilu, M. (2001). Extraction of illusory linear clues in per-
spectively skewed documents. In CVPR, volume 1,
pages I – 363.
Pratheeba, T., Kavitha, V., and Rajeswari, S. (2010). Mor-
phology based text detection and extraction from com-
plex video scene. IJET, 2(3):200 – 206.
Retornaz, T. and Marcotegui, B. (2007). Scene text local-
ization based on the ultimate opening. In ISMM, vol-
ume 1, pages 177 – 188.
Sedgewick, R. (2002). Algorithms in C, Part 5: Graph Al-
gorithms.
Yi, C. and Tian, Y. (2011). Text string detection from nat-
ural scenes by structure-based partition and grouping.
Image Processing, IEEE Transactions on, 20(9):2594
– 2605.
Zhang, Z., Lu, T., Su, F., and Yang, R. (2010). A new text
detection algorithm for content-oriented line drawing
image retrieval. In Advances in Multimedia Informa-
tion Processing-PCM, pages 338 – 347.
Zini, L., Destrero, A., and Odone, F. (2009). A classifi-
cation architecture based on connected components
for text detection in unconstrained environments. In
AVSS, pages 176 – 181.
TextLineAggregation
401
