
Convex Hull Area in Triaxial Mechanomyography during Functional
Electrical Stimulation
Guilherme N. Nogueira-Neto
1,3
, Eddy Krueger
2
, Eduardo M. Scheeren
1
,
Vera L. S. N. Button
3
and Percy Nohama
1,2,3
1
PPGTS, Pontifícia Universidade Católica do Paraná, Imaculada Conceição St 1155, Curitiba, PR, Brazil
2
CPGEI, Universidade Tecnológica Federal do Paraná, Sete de Setembro Ave 3165, Curitiba, PR, Brazil
3
CEB, Universidade Estadual de Campinas, Cidade Universitária “Zeferino Vaz”, Campinas, SP, Brazil
Keywords: Convex Hull, Triaxial Mechanomyography, Functional Electrical Stimulation.
Abstract: This study employed the convex hull in the analysis of triaxial mechanomyography (MMG) to determine
hull area variations along prolonged muscle contractions elicited by functional electrical stimulation (FES).
Closed-loop FES systems may need real-time adjustments in control parameters. Such systems may need to
process small sample sets. The convex hull area can be applied to small sample sets and it does not suffer
with non-stationarities. The MMG sensor used a triaxial accelerometer and the acquired samples were pro-
jected onto all planes. The hull determined the smallest convex polygon surrounding all points and its area
was computed. Four spinal cord injured volunteers participated in the experiment. The quadriceps femoral
muscle was stimulated in order to cause a full knee extension. FES parameters: 1 kHz pulse frequency and a
20 Hz burst frequency. Adjustments in the stimuli amplitude were controlled by a technician to sustain the
extension. The results showed that the convex hull area decreased over time. Since the polygons are related
to MMG amplitude, decreasing areas were related to muscle fatigue. The convex hull area can be a candi-
date to follow muscle fatigue during FES-elicited contractions and analysis of short length epochs.
1 INTRODUCTION
Functional electrical stimulation (FES) allows the
production of real muscle contractions that are artifi-
cially elicited by means of electric charges applied to
paralyzed muscles (Bajd et al., 1981, Langlois et al.,
2010). In addition to easing locomotion problems,
the electrical current applied to a spinal cord injured
subject brings physiological and biomechanical
benefits to the subject’s health (Peng et al., 2011).
During FES sessions, monitoring muscle
response to the electrical stimuli is a way of
investigating the evolution of muscle condition.
Mechanomyography (MMG) is a technique that
registers muscle vibrations and can help investigate
mechanical and physiological properties of
contracting muscles. Stokes and Cooper (1992)
reported that MMG is related to force production
whereas Petitjean et al. (1998) stated that evoked
MMG amplitude is a good index of motor unit
recruitment. MMG can also be used to observe
muscle fatigue installation, as a force suppressor
phenomenon, during FES programs performed in
rehabilitation protocols (Gobbo et al., 2006). Triaxial
MMG uses a 3D accelerometer that registers muscle
vibration in three orthogonal directions
simultaneously. It was already employed in the study
of muscle fatigue installation or neuronal adaptation
during FES (Nogueira-Neto et al., 2011), in which 1
s epochs of MMG signals were analyzed. However,
in closed-loop control of FES systems using MMG
parameters, updating the control strategy may
require epochs less than 1 s long. Using such epochs,
spectral (such as mean frequency and spectral
kurtosis) and temporal parameters (like those that
require constant signal variance) can be
contaminated by non-stationarity effects and this
becomes a problem for signal analysis and
classification (Fong et al., 2011) because parameters
have limited discriminatory power (Xie et al., 2009).
So, it is necessary to investigate techniques that can
also be applied to short epochs in neural control
systems.
Triaxial MMG allows the projection of a single
coordinate (defined by the values of each
acceleration axes) onto three representational planes
251
N. Nogueira-Neto G., Krueger E., M. Scheeren E., L. S. N. Button V. and Nohama P..
Convex Hull Area in Triaxial Mechanomyography during Functional Electrical Stimulation.
DOI: 10.5220/0004806702510256
In Proceedings of the International Conference on Bio-inspired Systems and Signal Processing (BIOSIGNALS-2014), pages 251-256
ISBN: 978-989-758-011-6
Copyright
c
2014 SCITEPRESS (Science and Technology Publications, Lda.)

(XY – XZ – YZ). In the space defined by the
vibratory axes, Graham’s convex hull algorithm
(Graham, 1972) can identify the smallest convex
polygon that encloses all points in a plane. The
scattered plot of the coordinates represents the
spatial distribution of muscle vibrations. After
determining such polygon, its area can be computed
and it is closely related to the amplitude of MMG
signals in these directions. The area computation is
independent of the number of points (related to the
triaxial MMG epoch duration) and, thus, non-
stationarity issues do not limit the discriminatory
power of signal descriptors. The validation of the
convex hull area as signal analysis technique can
provide a new method to investigate bi- or triaxial
MMG during epochs less than 1s long during
closed-loop FES.
As long as FES is continuously applied to
paralyzed muscles, the installation of muscle fatigue
and neuronal adaptation can change the muscle
vibratory response (Jailani and Tokhi, 2012). Since
no previous work was found using convex hull and
bi- or triaxial MMG for muscle condition analysis
during FES, we propose to investigate whether the
convex hull area of planar finite MMG coordinates
set can identify changes in muscle condition during
knee maximum extension evoked by prolonged FES
application.
2 METHODS
2.1 Volunteers
The data were obtained from four male spinal cord
injured volunteers submitted to FES. The experiment
was approved by the research ethics committee of
Pontifícia Universidade Católica do Paraná (letter of
approval 2416/08). Participants were instructed
about the protocol and, after signing an informed
consent term, trichotomy and skin cleaning were
performed previous to the positioning of MMG
sensor and FES electrodes. Figure 1 shows the ex-
perimental setup for the subjects, sensors and elec-
trodes during the protocol.
2.2 Functional Electrical Stimulator
A multichannel functional electrical stimulator was
used to excite the quadriceps femoral muscle. The
FES waveform was a rectangular wave with pulse
frequency of 1 kHz, because it is preferable so as to
cause a forceful motor response (Ward and Robert-
son, 1998), and a 20 Hz, 6% duty cycle burst fre-
quency. A low duty cycle allows efficient contrac-
tions with less undesired metabolic effects. A low
burst frequency, preferably below 70 Hz, may post-
pone muscle fatigue installation and avoid tetanic
contractions being 20 Hz the limit before reaching
muscle fasciculation (Petrofsky, 2004). The stimula-
tor worked in open-loop and a technician changed
the stimuli amplitude as required.
Figure 1: Experimental setup. FES elicited extension from
30 (rest) up to 0 (full extension). MMG sensor was
placed over the quadriceps muscle belly. The electrogoni-
ometer registered the angle of the knee. FES electrodes:
over the femoral triangle and the suprapatellar region.
2.3 Acquisition System
The developed MMG instrumentation used a Free-
scale MMA7260Q MEMS triaxial accelerometer
(13x18mm, 0.94 g, 800 mV/G sensitivity at 1.5 G
[G, gravitational acceleration] – see Figure 2 for axis
orientation). The electronic circuits allowed 10x
amplification. A LabVIEW program was responsible
for the acquisition, pre-conditioning and processing
of all signals. The acquisition hardware was a com-
mercial Data Translation DT300 board working on a
sampling rate of 1 kHz. The conditioning phase
prepared for analysis the first 30 s after the knee
angle reached maximum extension.
2.4 Experimental Protocol
The participant’s left lower limb was initially posi-
tioned at 30º of the maximum knee extension (0º).
FES caused the knee to fully extend. The manual
adjustments in FES amplitude performed by the
technician sustained the extension between 3º e 0º.
2.5 Convex Hull Processing
Each ordinate pair
1, 1
;
2, 2
;...;
,
represents a point
in a plane. Figure 3 shows the dispersion of 1000
BIOSIGNALS2014-InternationalConferenceonBio-inspiredSystemsandSignalProcessing
252
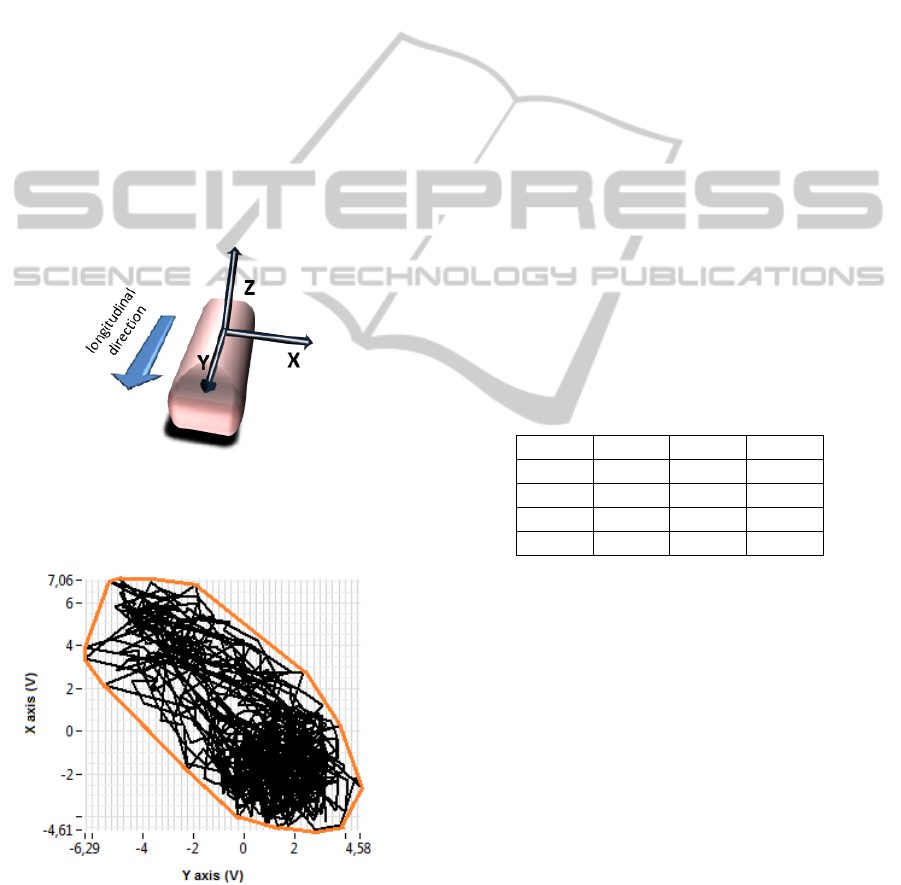
ordinate pairs of a triaxial MMG signal, but only for
X and Y axes.
The hull was computed based in the algorithm
proposed by Graham (1972) with small
modifications. The routine determines the convex
hull of an ordinate pairs set
0,1,..., in the plane, where depends on
the epoch length. At every 1 s epoch, a vector was
processed to find the external points that define
.
Basically, the process can be defined in three
phases: (i) identify the point with the smallest
ordinate, i. e., the pivot point; (ii) compute the
angles of all other pairs in relation to the pivot,
resulting in a vector of angles sorted in ascending
order and (iii) use the cross product to determine the
angle formed by two line segments defined at every
consecutive three pairs. In the case of a negative
cross product, the intermediate pair is discarded for
it is an internal point.
Figure 2: Orientation of MMG sensor’s axes. Solid in red:
perspective of the limb segment representing the thigh.
Directions: Z – antero-posterior; X – lateral, and Y –
longitudinal.
Figure 3: Dispersion of 1000 ordinate pairs from a 1 s
triaxial MMG signal. Pairs were linked with black solid
lines. The orange contour represents the convex hull.
The last phase is repeated successively and
recurrently until no point in discarded from the
current . Finally, the routine determines the
area of .
2.6 Statistical Analysis
The area in each plane was normalized as a percent
of mean area. Linear determination coefficients (R
2
)
were computed to investigate how much a regression
line expresses the evolution of the area of FC(S)
along the extension maintenance.
3 RESULTS
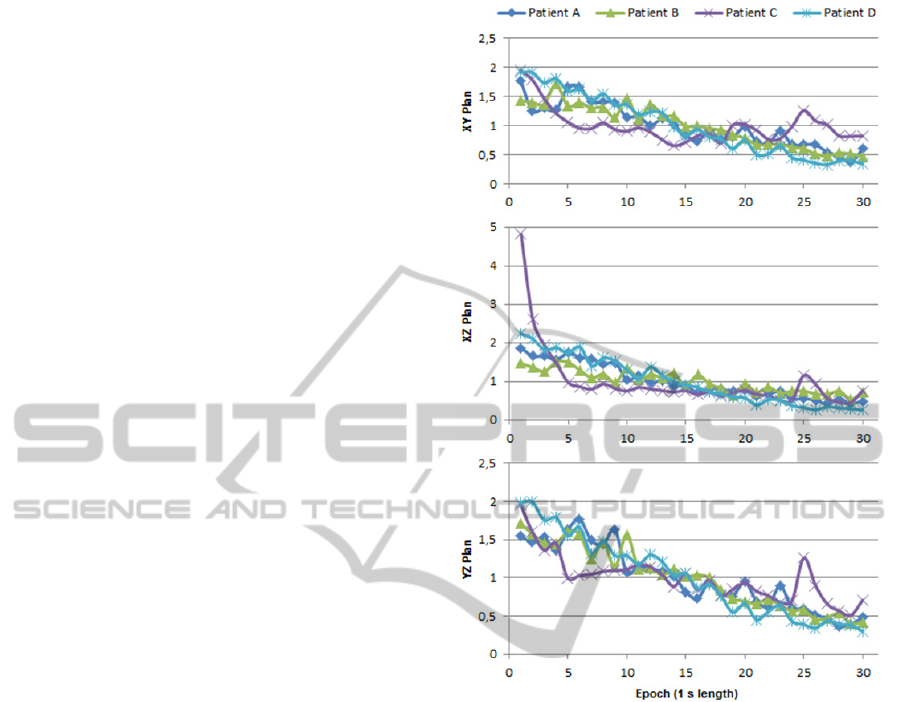
Figure 4 shows the convex hull area at every epoch.
All curves presented a gradual decrease in the values
of . One can note that for some volunteer data
(e.g., Patients A and C) there are variations in the
trend of area values of different planes.
Table 1 shows the linear determination
coefficients (R
2
) for all curves. Data imply the
existence of strong linear correlation in the trends,
except for Patient C. All regressive line slopes were
negative, evidencing a decline in the trend (–0.0171
to –0.069).
Table 1: Determination coefficients of regression lines.
Patient XY XZ YZ
A 0.8404 0.9145 0.8831
B 0.9184 0.8245 0.9397
C 0.2642 0.324 0.6338
D 0.9605 0.9438 0.9527
4 DISCUSSION
The contracting muscle vibrates when sufficiently
excited by FES, and the MMG captures the muscle
lateral oscillation in three orthogonal directions.
Each axes pair delimited a plane and Figure 4 shows
that the area of presented a gradual reduction
in all defined planes during the contraction.
Around the hull areas of Patient C, at instant 25
s, there is a transient in all planes. Incautious
placement of sensors was avoided as well as the
patients did not hit the leads during the experiment.
A possible explanation would be that this event is a
result of the recruitment of new motor units during
the evoked task. The recruitment of motor units
while applying FES can follow a non-obvious
pattern of sequencing, depending on muscle fiber
types (Gregory and Bickel, 2005). Therefore, the
ConvexHullAreainTriaxialMechanomyographyduringFunctionalElectricalStimulation
253
muscle of Patient C can be more responsive to
variations in FES amplitude and this responsiveness
lead to greater oscillations in the triaxial MMG axes.
After the transient, however, the area of
diminished again, revealing a decreasing trend in
MMG amplitude but less pronounced in the XZ
plane, the transversal plane. The observed overall
decrease is consistent with the findings of other
researchers. Progressive decreases in MMG
amplitude were observed in fatiguing isometric
contractions of the erector spinae muscle (Yoshitake
et al., 2001). The integrated amplitude of rectus
femoris MMG response also decreased with force
production (Stokes and Dalton, 1991) that indicates
that motor unit recruitment decreases with the
installation of muscle fatigue and it could explain
the reduction in the hull area.
The main motivation for using computational
geometry was the possibility of employing analysis
with short length epochs without non-stationarity
problems. Its algorithm can be easily incorporated in
microcontroller units employed in closed-loop FES
systems with a low computational cost and capable
of providing real time efficiency (Yun-Hui, 1999).
The use of epochs less than 1 s in length is not
recommended for analysis of electromyographic
(EMG) parameters (Beck et al., 2005), as well as for
biomechanical data during dynamic contractions
(Schwartz et al., 2012) due to stationarity issues.
Wavelet analysis is a recommended technique to
study non-stationary signals (Rioul and Vetterli,
1991). Alternative to the complex hull analysis is
principal component analysis (PCA), an statistical
method that explains the covariance of multivariate
signals by means of a small set of components and is
less susceptible to outliers (Hubert and Rousseeuw,
2005).
The relationship between eccentric and
concentric muscle contractions was studied with
decomposition of MMG and EMG signals in
principal components (Qi et al., 2011). This work
focused in convex hull because microcontroller-
based closed-loop FES control systems need short
response times and this implied the use of short
length epochs what could eventually impair the
results with PCA (Osborne and Costello, 2004).
Nevertheless, PCA had been already used in real-
time control systems (Chapin et al., 1999) and robust
PCA algorithms may be computed really fast
(Hubert and Rousseeuw, 2005).
The reduction in the hull area can occur due to
the attenuation in the amplitude of MMG signals in
any axis. Generally, a monoaxial sensor registers the
signal in the muscle normal direction and does not
Figure 4: Convex hull area (in V
2
) vs. epoch.
acquire vibrations in other directions (Akataki et al.,
1999). Therefore, triaxial accelerometry favors the
investigation of what is happening in vibration
planes.
While a technique under study, data
normalization is non-problematic, because absolute
values can depend on volunteer, FES parameters and
hardware/software amplification stages. A limitation
of this technique is intrinsic to the method. The area
enclosed by the hull does not represent the area of
the polygon exactly defined by the pairs in the plane.
However, the hull determination can be
compromised if outliers are present in the samples.
The number of subjects investigated was small
because not all volunteers could hold an artificially
sustained contraction for as long as 30 s.
Investigating MMG spectral parameters in
voluntary isometric contractions, Tarata et al. (2001)
observed a decrease in the MMG mean spectrum
frequency for biceps and brachioradialis muscles. In
studies previously published (Nogueira-Neto et al.,
BIOSIGNALS2014-InternationalConferenceonBio-inspiredSystemsandSignalProcessing
254

2011) using FES and a spinal cord injured person,
we have also found that the mean frequency
decreases during the periods of extension
maintenance. Therefore, the results presented in this
paper are consistent with studies already published
and show that this technique can be useful in
following the evolution of FES-elicited muscle
contraction. Convex hull area, despise its limitations,
can be a promising candidate as a parameter
indicating muscle fatigue in closed-loop FES control
systems.
5 CONCLUSIONS
In this study, we proposed the use of a computational
geometry technique known as the convex hull of a
finite set of planar points in the analysis of triaxial
mechanomyography signals. During an open chain
contraction and maximum knee extension evoked by
functional electrical stimulation, the convex hull
showed that its area reduced in all planes in a space
defined by the three axes of the mechanomyography
sensor. This reduction in the convex hull area was
related to a decrease in force production due to sup-
pressive performance phenomena like muscle fa-
tigue.
ACKNOWLEDGEMENTS
The authors thank CNPq, SETI-PR, CAPES e
FINEP for the financial support.
REFERENCES
Akataki, K., Mita, K. & Itoh, Y. 1999. Relationship Be-
tween Mechanomyogram And Force During Voluntary
Contractions Reinvestigated Using Spectral Decompo-
sition. European Journal Of Applied Physiology, 80,
173-9.
Bajd, T., Kralj, A., Sega, J., Turk, R., Benko, H. & Stro-
jnik, P. 1981. Use Of A Two-Channel Functional Elec-
trical Stimulator To Stand Paraplegic Patients. Physi-
cal Therapy, 61, 526-27.
Beck, T. W., Housh, T. J., Johnson, G. O., Weir, J. P.,
Cramer, J. T., Coburn, J. W. & Malek, M. H. 2005.
Comparison Of Fourier And Wavelet Transform Pro-
cedures For Examining The Mechanomyographic And
Electromyographic Frequency Domain Responses
During Fatiguing Isokinetic Muscle Actions Of The
Biceps Brachii. Journal Of Electromyography And Ki-
nesiology, 15, 190-9.
Chapin, J., Moxon, K., Markowitz, R. & Nicolelis, M.
1999. Real-Time Control Of A Robot Arm Using Sim-
ultaneously Recorded Neurons In The Motor Cortex.
Nature Neuroscience, 2, 664-70.
Fong, S., Hang, Y., Mohammed, S. & Fiaidhi, J. 2011.
Stream-Based Biomedical Classification Algorithms
For Analyzing Biosignals. Journal Of Information
Processing Systems, 7, 717-32.
Gobbo, M., Cè, E., Diemont, B., Esposito, F. & Orizio, C.
2006. Torque And Surface Mechanomyogram Parallel
Reduction During Fatiguing Stimulation In Human
Muscles. European Journal Of Applied Physiology,
97, 9-15.
Graham, R. L. 1972. An Efficient Algorithm For Deter-
mining The Convex Hull Of A Finite Planar Set. In-
formation Processing Letters, 1, 132-3.
Gregory, C. M. & Bickel, C. S. 2005. Recruitment Patterns
In Human Skeletal Muscle During Electrical Stimula-
tion. Physical Therapy, 85, 358-64.
Hubert, M. & Rousseeuw, P. J. 2005. Robpca: A New
Approach To Robust Principal Component Analysis.
Technometrics, 47, 64-79.
Jailani, R. & Tokhi, M. O. 2012. The Effect Of Functional
Electrical Stimulation (Fes) On Paraplegic Muscle Fa-
tigue. Ieee 8th International Colloquium On Signal
Processing And Its Applications (Cspa). Shah Alam,
Selangor, Malaysia: Ieee.
Langlois, P. J., Demosthenous, A., Pachnis, I. & Donald-
son, N. 2010. High-Power Integrated Stimulator Out-
put Stages With Floating Discharge Over A Wide Volt-
age Range For Nerve Stimulation. Ieee Transactions
On Biomedical Circuits And Systems, 4, 39-48.
Nogueira-Neto, G. N., Krueger, E., Scheeren, E. M., No-
hama, P. & Button, V. L. S. 2011. Estimulação Elétrica
Funcional Aplicada Em Cadeia Aberta - Um Estudo
De Caso Com Monitoração Mecanomiográfica. 5th
Latin American Congress Of Biomedical Engineering.
Havana: Ifmbe.
Osborne, J. W. & Costello, A. B. 2004. Sample Size And
Subject To Item Ratio In Principal Components Anal-
ysis. Practical Assessment, Research & Evaluation, 9,
8.
Peng, C.-W., Chen, S.-C., Lai, C.-H., Chen, C.-J., Chen,
C.-C., Mizrahi, J. & Handa, Y. 2011. Review: Clinical
Benefits Of Functional Electrical Stimulation Cycling
Exercise For Subjects With Central Neurological Im-
pairments. Journal Of Medical And Biological Engi-
neering, 31, 1-11.
Petitjean, M., Maton, B. & Fourment, A. 1998. Summation
Of Elementary Phonomyograms During Isometric
Twitches In Humans. European Journal Of Applied
Physiology, 77, 527-35.
Petrofsky, J. S. 2004. Electrical Stimulation: Neurophysio-
logical Basis And Application. Basic And Applied My-
ology, 14, 205-13.
Qi, L., Wakeling, J. M., Green, A., Lambrecht, K. & Fer-
guson-Pell, M. 2011. Spectral Properties Of Electro-
myographic And Mechanomyographic Signals During
Isometric Ramp And Step Contractions In Biceps Bra-
ConvexHullAreainTriaxialMechanomyographyduringFunctionalElectricalStimulation
255

chii. Journal Of Electromyography And Kinesiology,
21, 128-35.
Rioul, O. & Vetterli, M. 1991. Wavelets And Signal Pro-
cessing. Ieee Signal Processing Magazine, 8, 14-38.
Schwartz, F. P., De Oliveira Nascimento, F. A., Bottaro,
M. & Celes, R. S. 2012. Análise Da Estacionariedade
Do Sinal De Eletromiografia De Superfície Nas Fases
Do Exercício Isocinético De Extensão Do Joelho. Re-
vista Brasileira De Engenharia Biomédica, 28, 44-52.
Stokes, M. J. & Cooper, R. G. 1992. Muscle Sounds Dur-
ing Voluntary And Stimulated Contractions Of The
Human Adductor Pollicis Muscle. Journal Of Applied
Physiology, 72, 1908-13.
Stokes, M. J. & Dalton, P. A. 1991. Acoustic Myography
For Investigating Human Skeletal Muscle Fatigue.
Journal Of Applied Physiology, 71, 1422-26.
Tarata, M., Spaepen, A. & Puers, R. 2001. The Accel-
erometer Mmg Measurement Approach, In Monitoring
The Muscular Fatigue. Measurement Science Review,
1, 47-50.
Ward, A. R. & Robertson, V. J. 1998. Variation In Torque
Production With Frequency Using Medium Frequency
Alternating Current. Archives Of Physical Medicine
And Rehabilitation, 79, 1399-1404.
Xie, H.-B., Zheng, Y.-P. & Guo, J.-Y. 2009. Classification
Of The Mechanomyogram Signal Using A Wavelet
Packet Transform And Singular Value Decomposition
For Multifunction Prosthesis Control. Physiological
Measurement, 30, 441-57.
Yoshitake, Y., Ue, H., Miyazaki, M. & Moritani, T. 2001.
Assessment Of Lower-Back Muscle Fatigue Using
Electromyography, Mechanomyography, And Near-
Infrared Spectroscopy. European Journal Of Applied
Physiology, 84, 174-9.
Yun-Hui, L. 1999. Qualitative Test And Force Optimiza-
tion Of 3-D Frictional Form-Closure Grasps Using
Linear Programming. Ieee Transactions On Robotics
And Automation, 15, 163-73.
BIOSIGNALS2014-InternationalConferenceonBio-inspiredSystemsandSignalProcessing
256
