
Reproducibility of Pulse Wave Analysis and Pulse Wave Velocity
in Healthy Subjects
T. Pereira
1
, I. Santos
1
, T. Pereira
2
, H. Santos
2
, V. Almeida
1
, H. Pereira
1,3
, C. Correia
1
and J. Cardoso
1
1
Instrumentation Center, Physics Department, University of Coimbra, Coimbra, Portugal
2
Coimbra College of Health Technology, Coimbra, Portugal
3
ISA- Intelligent Sensing Anywhere, Coimbra, Portugal
Keywords: Optical Probe, Waveform Distension, Pulse Wave Analysis, Pulse Wave Velocity, Reproducibility.
Abstract: The hemodynamic parameters extracted from pulse pressure waveform, by pulse wave analysis (PWA) and
pulse wave velocity (PWV) are strong independent predictors of cardiovascular morbidity. The aim of this
study is to investigate the reproducibility of pulse pressure profile and arterial stiffness indicators, i.e.,
Augmentation Index (AIx), Subendocardial Viability Ratio (SEVR), maximum rate of pressure change
(dP/dt
max
), Ejection Time Index (ETI), as measured using a contactless optical system. Reproducibility was
evaluated in 13 healthy subjects by two senior operators (‘A’ and ‘B’) that acquired signals in alternate
order (ABAB or BABA). The PWV result showed a good inter and intra-operator reproducibility. The mean
difference between the two operators is 0.1570 m/s with a SD of 0.8160 m/s, this difference represents
approximately 3.49% of the arithmetic average of the means obtained by each operator per trial. Between
trials, differences of less than 8% of the mean PWV value for each operator were obtained. PWA
repeatability results are considered high for HR, strong for Aix and moderate for dP/dt
max
. The newly
developed optical system showed good reproducibility as evaluated by both inter-operator and intra-
operator methods.
1 INTRODUCTION
Cardiovascular diseases are the main cause of death
in the general population. For this reason, the
identification of risk factors at an early preclinical
stage of disease is an important clinical issue.
Besides, also markers of arterial stiffness such as
Pulse Wave Velocity (PWV) and Pulse Wave
Analysis (PWA) comprised of Augmentation Index
(AIx), Subendocardial Viability Ratio (SEVR),
maximum rate of pressure change (dP/dt
max
),
Ejection Time Index (ETI), have been shown, in
recent studies, to be strong independent predictors of
cardiovascular morbidity (Crilly et al., 2007).
Several standard techniques are widely used for
estimation of pulse pressure waveform and main
hemodynamic parameters, however, all of them
require direct contact with the patient’s skin at the
artery site, this procedure may distort the waveform
integrity. The optical solutions represent a
significant improvement to overcome this limitation
for measuring the distension waveform of the carotid
artery due to their truly non-invasive nature (Pereira
et al., 2011a; Pereira et al., 2011b; Pereira et al.,
2012).
In peripheral arteries, like the carotid, the
pressure wave travels across the arterial tree in a
compliant way, forcing the blood vessels to distend
elastically according to the pressure wave profile
and imparting a visible distension effect. The
distension waveform and the pressure waveform
have an analogous wave contour and, therefore, can
reciprocally be used for pulse wave analysis
(Laurent et al., 2006; Pereira et al., 2013a; Pereira et
al., 2013b).
In previously studies, the optical system proved
to be reliable in detecting the arterial distension
waveform. In order to evaluate the capability of the
developed optical device to accurately detect the
pulse waveform several studies was developed
(Pereira et al., 2011b, Pereira et al., 2013b).
This study investigates the reproducibility of
pulse pressure profile, and both inter-operator
(systematic differences among the observers) and
intra-operator (deviations of a particular observer's
score on a particular patient) variability analysis
221
Pereira T., Santos I., Pereira T., Santos H., Almeida V., Pereira H., Correia C. and Cardoso J..
Reproducibility of Pulse Wave Analysis and Pulse Wave Velocity in Healthy Subjects.
DOI: 10.5220/0004802502210228
In Proceedings of the International Conference on Bio-inspired Systems and Signal Processing (BIOSIGNALS-2014), pages 221-228
ISBN: 978-989-758-011-6
Copyright
c
2014 SCITEPRESS (Science and Technology Publications, Lda.)

were performed. Thus the aim of the present study is
to assess intra- and inter-operator reproducibility.
Reproducibility was evaluated in 13 healthy subjects
by two senior operators, and evaluates the degree of
closeness of the repeated measurements made on the
same subject either by the same instrument.
This is a prospective study and similar studies of
this kind presents a sample of the same magnitude
(Protogerou et al., 2012; Vappou et al., 2011).
The reproducilbity study covering inter-operator
and intra-operator variability analysis. Inter-operator
variability refers to systematic differences among
the observers. Intra-operator variability refers to
deviations of a particular observer's score on a
particular patient that are not part of a systematic
difference.
This work contributes to the design a protocol for
this type of non-invasive probes used in
determination of hemodynamic parameters, which
contains the required guidelines to assessment test
for the operator variability.
2 MATERIALS AND METHODS
2.1 Technology
The proposed probes were developed to measure the
arterial pulse wave profile at the carotid site and are
based on the reflectance fluctuations of the skin
surface during the underlying pulse wave
propagation (Pereira et al., 2011b; Pereira al., 2012).
The illumination source is provided by light
emitting diodes (LEDs) with 635 nm and the light
detection is performed by two photodetectors, placed
at a specific distance of 20 mm apart (see Figure1),
to assess the pulse pressure waveform at two distinct
spots, ensuring the accurate determination of local
pulse transit time (PTT) and thus, of the local PWV.
Figure 1: Structure of optical probe inside the plastic box.
The enclosing box contacts the skin, to stabilize
and maintain constant the distance between the
photodector and the artery site (3 mm), however in
the local of measurement there is no contact and
consequently no distortion of signal.
The signals were digitized with a 16-bit
resolution data acquisition system (National
Instruments, USB6210®) with a sampling rate of 20
kHz and stored for offline analysis using Matlab®
(R2011a).
2.2 Study Population
The group consisted of 13 healthy human
volunteers, normotensive and with no documented
history of cardiovascular disorders or diabetes that
had undergone signal acquisitions with the optical
probe. The characteristics of the volunteers are
presented in Table 1.
Table 1: Main characteristics of the sample.
Parameters Range values
n (Males/Females) 13 (7/6)
Age (years) 24.1 ± 2.2
Height (cm) 166.6 ± 8.0
Weight (kg) 63.8 ± 12.8
BMI (kg/m
2
) 22.8 ± 2.9
Brachial SBP* (mmHg) 113.5 ± 12.5
Brachial DBP* ( mmHg) 73.2 ± 9.1
Heart Rate* (bpm) 65.4 ± 11.4
BMI indicates body mass index; SBP, systolic blood pressure;
DBP, diastolic blood pressure.
* Measure in brachial, with commercial sphygmomanometer
(blood pressure cuff).
2.3 Study Protocol
Two trained blinded operators (further referred as
‘A’ and ‘B’) alternatively undertook 2
measurements each, in the same location, using the
same probe in the same day, over a short period of
time. The subjects rested for 10 minutes in supine
position, reached the physiological baseline
conditions, both operators measured blood pressure
(BP) before each measurement and acquired signals
in alternate order (ABAB or BABA). Each trial
consisted of few acquisitions, usually between 2 and
4, and the values of each trial were further averaged.
Similar reproducibility studies have been carried
BIOSIGNALS2014-InternationalConferenceonBio-inspiredSystemsandSignalProcessing
222

out with same protocol, that accepted as rigorous
approach this evaluation of PWA and PWV
repeatability (Crilly et al., 2007; Frimodt-Moller et
al., 2008). As expected BP, pulse pressure waveform
and consequently the hemodynamic indices
remained, are stable during the assessment period.
The sequence of operator was random, which reduce
bias will have tended to compromise intra-operator
variability. The study protocol was approved by the
ethical committee of the Centro Hospitalar e
Universitário de Coimbra, Portugal. All the subjects
were volunteers and gave a written informed
consent.
2.4 Hemodynamic Measurement
The assessment of the cardiovascular system
condition based on multi-parameters allows a more
precise and accurate diagnosis of the heart and the
arterial tree condition. The multiple parameter risk
response score is a useful tool to categorize patients
for selection of appropriate interventions. The
optical system allows the determination the several
parameters based in the pulse pressure wave profile,
and possible to overcome errors in the determination
of one of the parameters. Risk indicators, can be
determined from the main parameters extracted from
waveform and its time characteristics and pulse
wave velocity.
In the pulse wave analysis, AIx is the most
widely researched index and is defined as the ratio
of blood pressure amplitudes at the timings of the
reflection point (RP) and systolic peak (SP), thus
resulting in RP/SP expressed as a percentage. A
convention for the signal of AIx, defines when the
reflected wave arrival occurs earlier than the systolic
peak the AIx have positive value while a negative
value of AIx indicates that the reflected wave arrives
after the systolic peak (Crilly et al., 2007).
The Subendocardial Viability Ratio, or Buckberg
Index, varies between 119 and 254% in healthy
subjects, and is a parameter that estimates the
myocardial oxygen supply–demand relative to the
cardiac workload and is an indicator of
subendocardial ischaemia (Crilly et al., 2007).
The ejection time, also referred to as Left
Ventricular Ejection Time, corresponds to the
ventricular systolic ejection time between the aortic
valve opening and closing. Its ratio to the total
duration of the cardiac cycle represents the ETI (%)
and varies between 30 and 42% in healthy
individuals (Kara, Okandan et al., 2004).
The dP/dt
max
parameter reports the maximum rate
of pressure change in the systolic upstroke and gives
information about the initial velocity of the
myocardial contraction, which is also an index of
myocardial performance and the range of values
expected for a healthy population is 772 ± 229
(mmHg/s) (Miller et al., 2007).
2.5 Signal Processing
The pulse wave velocity was calculated using the
PTT determined by the cross-correlation method
between the signals from the two photodetectors.
A set of cyclic waveforms coming from one of
the channels, undergo segmentation and
normalization to the diastolic–systolic pressure
interval. The signal segmentation is performed using
the wave foot, detected by the minimum, and was
based on an automated peak detection function in
Matlab® (Peakdetect from the Mathworks, by Tom
McMurray). The average pulse are digitally low-
pass filtered (with a cut-off frequency of 30 Hz),
which removes the noise, thus allowing the signal
differentiation. The developed algorithm for
waveform features determination is based on
differential calculus and was applied to the
remarkable points as a tool to quantify arterial
pressure waveform features (Korpas et al., 2009).
An assessment of arterial brachial pressure by
conventional measurement using a
sphygmomanometer was conducted prior and after
the exam for calibration purposes. These values
were used to calibrate the carotid pressure waveform
as recommended and according to the calibration
method proposed by Kelly and Fitchett (Kelly &
Fitchett, 1992).
2.6 Statistical Analysis
The data are reported as mean values ± standard
error with 95% confidence intervals and percentages
were used to describe qualitative variables. The
Bland-Altman approach for ‘95% limits of
agreement’ was used in inter and intra-operator
differences in paired measurements.
Reproducibility was assessed by Intraclass
Correlation Coefficients (ICC), Coefficients of
Variation (CV), Standard Error of Measurement
(SEM) and Limits of Agreement (LA) (Euser et al.,
2008; Vanmolkot et al., 2005).
Intraclass correlation coefficient was computed
for repeatability studies, based on one-way analysis
of variance (ANOVA). ICC describes how strongly
measurements in the same group resemble each
other. The CV expresses the variation between
measurements in relation to the mean value of all
ReproducibilityofPulseWaveAnalysisandPulseWaveVelocityinHealthySubjects
223
measurements. The LA provides direct information
about the absolute measurement error. The standard
error of measurement takes the amount of
measurement error into consideration (Bartlett &
Frost, 2008). Statistical analysis was performed by
SPSS
®
software (SPSS Inc., Chicago, Illinois).
3 RESULTS
3.1 PWV Results
The normality of the variables distribution for each
trial/operator were assessed using the test of
normality Shapiro-Wilk, all the sets of PWV values
follow a normal distribution (Significance value
≥0.169, p<0.05). The correlation between the PWV
values obtained by both operators is plotted in
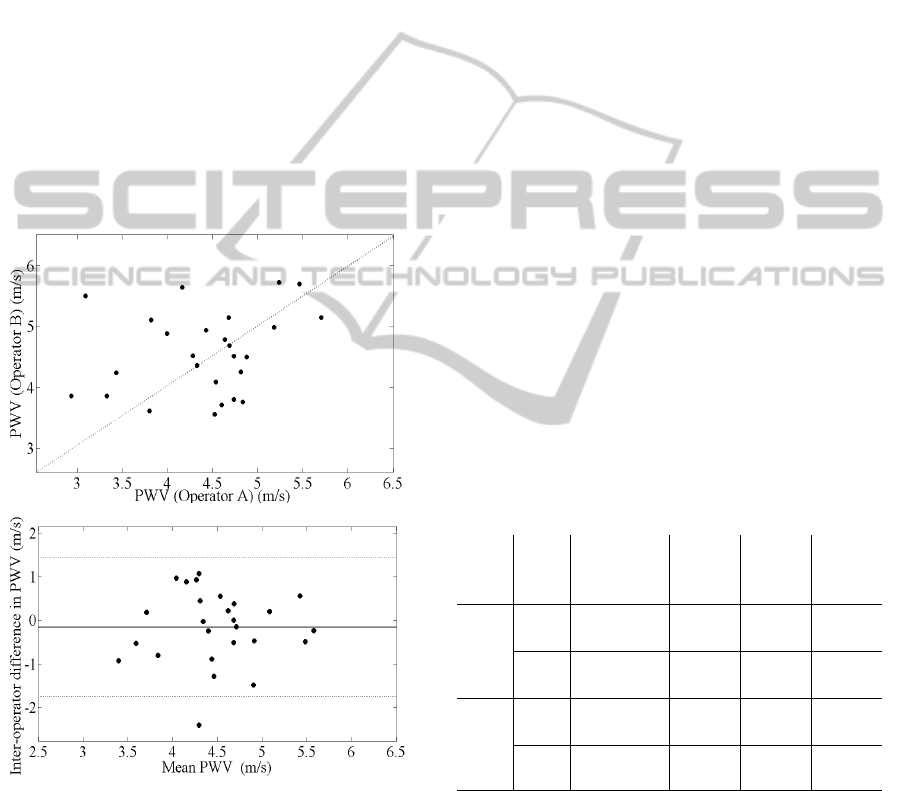
Figure 2a.
a)
b)
Figure 2: Comparison between two operators (A and B).
(a) Correlation between the operators for PWV
measurements. (b) Bland-Altman plot displays the inter-
operator difference for the two operators as a function of
the mean of the determined PWV.
The mean difference between the two operators is
0.1570 m/s with a SD of 0.8160 m/s as shown in a
Bland-Altman plot (Figure 2b). This difference
represents approximately 3.49% of the arithmetic
average of the means obtained by each operator per
trial.
Considering all measurements there is only one
that has a difference greater than 2 m/s, and just 4
measurements have a difference higher than 1 m/s.
According to Figure 2 the acceptable intra-operator
PWV differences (<1 m/s) are observed in 22
measurements (85%).
The between-operator ICC of 0.602 (95% from
0.12 to 0.82) revealed a moderate agreement between
classes (measurement made by operator ‘A’ and
operator ‘B’).
Considering variance results, in Table 2, there is
no evident variation depending on the operator.
However, considering the values between trials, the
trial 2 shows lower variance comparing to trial 1 for
each operator. Furthermore, the coefficients of
variation obtained for inter-observer and intra-
observer reproducibility were less than 15%.
The graph represented in Figure 3 shows that
values obtained by operator ‘A’ are very similar to
the operator ‘B’. Also the mean values for PWV
from different trials of each operator have very close
values.
In spite of this apparent difference, the ICC for
both trials per operator shows that for operator ‘A’
there is a moderate agreement between trial 1 and 2
(ICC=0.674; 95% CI from 0.01 to 0.82) and for
operator ‘B’ this coefficient has a similar value of
agreement (ICC=0.654; 95% CI from -0.17 to 0.89).
Table 2: PWV mean values obtained by each operator A
and B, per trial.
Trial Ope
Range
(min-max)
(m/s)
Mean
(m/s)
SD
(m/s)
Var
1
A
(3.090-
5.463)
4.263 0.734 0.539
B
(3.616-
5.699)
4.629 0.714 0.510
2
A
(2.932-
5.710)
4.568
0.649
0.422
B
(3.558-
5.729)
4.517
0.663
0.440
Ope: operator; SD: standard deviation; Var: variance.
To better understand the variability of the PWV
values, the values obtained within each operator and
between trials are represented in the Figure 4.
No significant association between the PWV
intra-operators values was found after a correlation
analysis. The average difference between the two
trials assessed by the operator A was
-0.3049 m/s with a SD of 0.7388 m/s as shown in a
BIOSIGNALS2014-InternationalConferenceonBio-inspiredSystemsandSignalProcessing
224
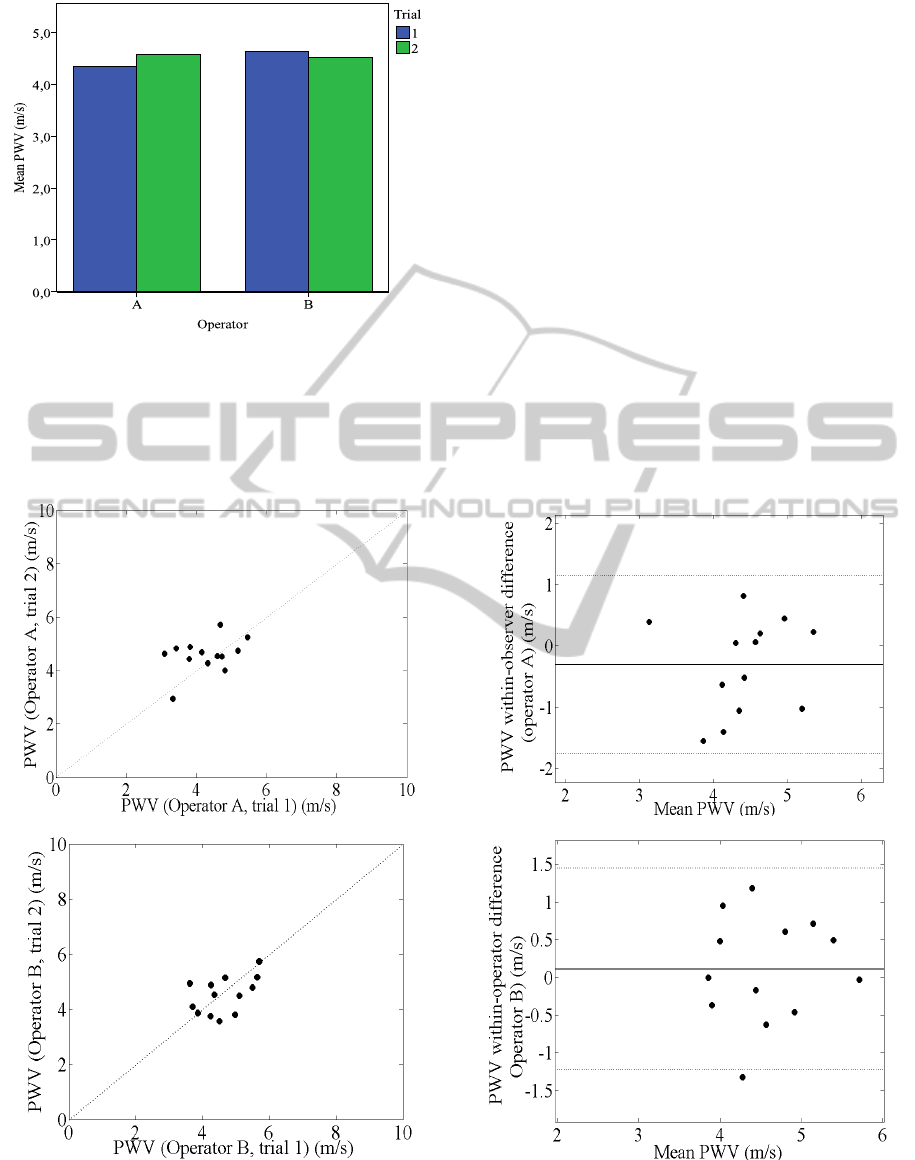
Figure 3: Bar graphs for mean values of PWV by operator.
with a SD of 0.7388 m/s as shown in a Bland-
Altman plot in Figure 4 b). This limit of agreement
(from -1.78 to 1.17 m/s) represents at most 6.9% of
the mean PWV for this operator.
The average difference between the two trials
assessed by operator B was 0.1123 m/s with a
0.6801 SD of m/s as shown in a Bland-Altman plot
in Figure 4 c). This limit of agreement (from -1.25 to
1.47 m/s) represents at most 7.6% of the mean PWV
value for operator B.
3.2 PWA Results
Relatively to the other PWA parameters the values
determined in this dataset by the optical system are
shown in Table 3.
The standard deviation of measurement errors is
therefore a reflection of the reliability of the test
response (Bartlett & Frost, 2008). The SEM is
expressed in the actual units of measurement,
making it easy to interpret, i.e. the smaller the SEM,
the greater the reliability and the values obtained for
HR, AIx and ETI parameter are low values, only in
the case of dP/dt
max
and SEVR were presents slightly
higher values for the SEM.
a) b)
c) d)
Figure 4: Comparison between two trials for two operators. (a) Correlation of PWV between two trials acquired by
Operator A. (b) Bland-Altman plot displays the intra-operator difference for the Operator A. c) Correlation of PWV
between the two trials acquired by Operator B. d) Bland-Altman plot displays the intra-operator difference for the Operator
A.
ReproducibilityofPulseWaveAnalysisandPulseWaveVelocityinHealthySubjects
225
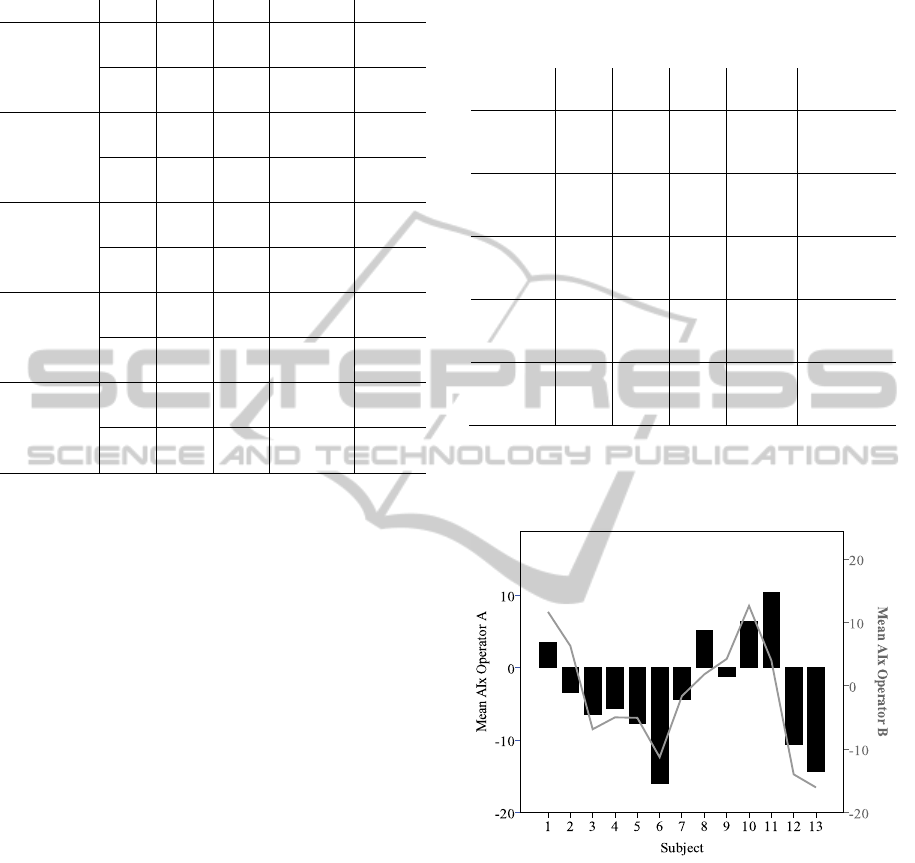
Table 3: Mean values of PWA hemodynamic parameters
for each operator.
Ope Mean SEM (95% CI) SD
HR (bpm)
A 65.41 1.47
62.48 to
68.35
11.18
B 64.95 1.79
61.34 to
68.57
11.90
AIx (%)
A -1.57 1.70
-5.15 to
2.00
13.61
B -4.19 1.89
-7.99 to -
0.39
12.51
SEVR (%)
A 149.4 9.38
130.98 to
168.53
71.20
B 152.9 13.04
126.63 to
179.84
86.53
dP/dt
max
(mmHg/s)
A 328.4 20.75
286.92 to
370.00
158.00
B 347.7 19.59
308.29 to
387.25
129.94
ETI (%)
A 42.24 1.96
38.31 to
46.16
14.93
B 42.61 2.27
38.04 to
47.18
15.04
3.2.1 Inter-Operator Repeatability
The proximity of the mean values Inter-operator is
expressed in the ICC results (Table 4). Some
parameters showed good agreement. As one can
observe, the HR and dP/dt
max
had shown high ICC
values, concordant with almost perfect agreement.
On the other hand for SEVR and ETI parameters,
the determined low ICC is congruent with fair
agreement. Concerning AIx, its corresponding ICC
values show a moderate level of between-operator
agreement.
In Figure 5 the results for AIx measurements for
all subjects for operator ‘A’ and operator ‘B’ are
represented. It is visible that there are not major
differences between AIx values obtained by the two
operators for each subject. The results in the figure
show a common trend between the values obtained
for AIx parameter by two operators measurement for
each subject.
A positive Augmentation Index could indicate a
case of arterial stiffness. With an increase in
stiffness there is a faster propagation of the forward
pulse wave as well as a more rapid reflected wave, a
positive AIx means that the reflected wave arrival
occurs earlier than the systolic peak is. Depending
on the AIx value (positive or negative) the pulse
wave type is defined as follows: when a negative
value occurs the pulse shows characteristic of
healthy subjects and when a positive value occurs
the pulse have characteristic of subjects suffering
from arterial stiffness (Almeida et al., 2013).
Table 4: Inter-operator repeatability of PWA: based in the
differences correspond to ‘Operator A’ measurement
minus ‘Operator B’ measurement).
ICC
a
(95%
CI)
Mean
diff
SD
(2SD)
Limits of
agreement
b
HR (bpm) 0.976
0.95
to
0.99
-0.279
3.52
(7.03)
-7.31 to
6.75
AIx (%) 0.734
0.41
to
0.88
-1.929
10.01
(20.02)
-21.95 to
18.09
SEVR
(%)
0.472
-0.20
to
0.77
7.173
152.26
(304.52)
-151.75 to
166.09
dP/dt
max
(mmHg/s)
0.581
0.09
to
0.81
-2.660
14.96
(29.91)
-263.61 to
345.44
ETI (%) 0.442
-0.24
to
0.75
0.014
0.09
(0.19)
-32.57 to
27.25
a
Intraclass correlation coefficient (ICC) using an absolute
agreement definition.
b
Limits of agreement for differences= mean difference ± 2SD.
Mean diff means Mean of difference between measures.
Figure 5: Trends in AIx measurements: mean of values for
each subject by operator A and operator B.
3.2.2 Intra-Operator Repeatability
Comparing the ICC results from Table 5 with those
presented in Table 4, which are referent to within-
operator differences, one could see that there are no
major discrepancies, except for AIx that has a lower
ICC and dP/dt
max
that is slightly higher.
BIOSIGNALS2014-InternationalConferenceonBio-inspiredSystemsandSignalProcessing
226

Table 5: Intra-operator repeatability of PWA, based in the
differences corresponds to ‘trial 1’ measurement minus
‘trial 2’ measurement.
ICC
a
(95%
CI)
Mean
diff
SD
(2SD)
Limits of
agreement
b
HR (bpm) 0.926
0.83
to
0.97
1.837
5.73
(11.46)
-9.62 to
13.30
AIx (%) 0.448
-0.23
to
0.75
-2.398
13.00
(26.00)
-28.40 to
23.61
SEVR
(%)
0.473
-0.20
to
0.77
-4.804
79.53
(159.05)
-163.86 to
154.25
dP/dt
max
(mmHg/s)
0.678
0.27
to
0.86
6.902
141.85
(283.70)
-276.80 to
290.60
ETI (%) 0.494
-0.16
to
0.78
0.740
14.63
(29.27)
-28.53 to
30.00
4 CONCLUSIONS
The reproducibility study was performed in 13
volunteers by two trained operators. Both operators
measured BP before each measurement and acquired
trials in alternate order. This measurements
reproducibility study has demonstrated a subjective
component based on the measurement techniques
used by different operators.
The main limitations of this study are its small
size and the inclusion of healthy volunteers rather
than patients. However it is common to evaluate
emerging techniques in volunteers initially and these
studies are important platforms for further method
improvement and subsequent patient studies.
The PWA repeatability results are considered
high for HR, strong for AIx, moderate for dP/dt
max
and low for SEVR and ETI. Actually, for all analysis
the resulting values for dP/dt
max
and SEVR differ
substantially from the ones presented as reference
and show the lower values for reproducibility
evaluation, probably originated by the calibration
method used.
The PWV results had a good inter and intra-
operator reproducibility judged by the Bland-Altman
plots as well as the test of differences between
measures. The two photodetectors (placed at a
precise and well-known distance of 20 mm), detect
the pulse wave propagation, along the arterial
segment. This distance could be a limitation only in
cases was a small segment of carotid artery is
accessible, which difficult the position of two
photodetectors centered on the artery.
The factors such as the position of two
photodetectors in the carotid vessel, tremors in the
hands of an operator, respiratory movements of the
volunteers could introduce differences in the
measurements between operators and trials. These
factors might affect the measurements and are
possible to quantify making changes in the probe by
the introducing an accelerometer or a respiratory
band in the volunteers, however escaped to the
objective of this work.
The newly developed optical system showed
good reproducibility as evaluated by both inter-
operator and intra-operator methods. This study
could be extended by comparing PWV and PWA
values from patients with vascular risks.
The cohort size is only 13 but it is enough to
draw conclusions about both inter-operator and
intra-operator variability analysis, however the
present results and clinical implications need to be
confirmed by larger studies that enable the predicted
ability of the optical system and including
population with heterogeneity characteristics: age,
blood pressure, BMI, cardiovascular diseases.
ACKNOWLEDGEMENTS
The authors acknowledge the support from
Fundação para a Ciência e Tecnologia (FCT) for
funding (SFRH / BD / 79334 / 2011). Project
developed under the initiative of QREN, funding by
UE/FEDER, through COMPETE - Programa
Operacional Factores de Competitividade.
REFERENCES
Almeida, V., Vieira, J., Santos, P., Pereira, T., Pereira, H.,
Correia, C., … Cardoso, J. (2013). Machine Learning
Techniques for Arterial Pressure Waveform Analysis.
Journal of Personalized Medicine, 3(2), 82–101.
Bartlett, J. W., & Frost, C. (2008). Reliability,
repeatability and reproducibility: analysis of
measurement errors in continuous variables.
Ultrasound in obstetrics & gynecology : the official
journal of the International Society of Ultrasound in
Obstetrics and Gynecology, 31(4), 466–75.
Chemla, D., Nitenberg, A., Teboul, J.-L., Richard, C.,
Monnet, X., le Clesiau, H., … Brahimi, M. (2008).
Subendocardial viability ratio estimated by arterial
tonometry: a critical evaluation in elderly hypertensive
patients with increased aortic stiffness. Clinical and
experimental pharmacology & physiology, 35(8), 909–
15.
Crilly, M., Coch, C., Bruce, M., Clark, H., & Williams, D.
ReproducibilityofPulseWaveAnalysisandPulseWaveVelocityinHealthySubjects
227

(2007). Indices of cardiovascular function derived
from peripheral pulse wave analysis using radial
applanation tonometry: a measurement repeatability
study. Vascular medicine (London, England), 12(3),
189–97.
Euser, A. M., Dekker, F. W., & le Cessie, S. (2008). A
practical approach to Bland-Altman plots and variation
coefficients for log transformed variables. Journal of
clinical epidemiology, 61(10), 978–82.
Frimodt-Moller, M., Nielsen, A. H., Kamper, A.-L., &
Strandgaard, S. (2008). Reproducibility of pulse-wave
analysis and pulse-wave velocity determination in
chronic kidney disease. Nephrology, dialysis,
transplantation : official publication of the European
Dialysis and Transplant Association - European Renal
Association, 23(2), 594–600.
Kara, S., Okandan, M., Usta, G., & Tezcaner, T. (2004).
Investigation of a new heart contractility power
parameter. Computer methods and programs in
biomedicine, 76(2), 177–80.
Kelly, R., & Fitchett, D. (1992). Noninvasive
determination of aortic input impedance and external
left ventricular power output: a validation and
repeatability study of a new technique. Journal of the
American College of Cardiology, 20(4), 952–963.
Korpas, D., Hálek, J., & Dolezal, L. (2009). Parameters
describing the pulse wave. Physiological research /
Academia Scientiarum Bohemoslovaca, 58(4), 473–9.
Laurent, S., Cockcroft, J., Van Bortel, L., Boutouyrie, P.,
Giannattasio, C., Hayoz, D., … Struijker-Boudier, H.
(2006). Expert consensus document on arterial
stiffness: methodological issues and clinical
applications. European heart journal, 27(21), 2588–
605.
Miller, R. S., Rudra, C. B., & Williams, M. a. (2007).
First-trimester mean arterial pressure and risk of
preeclampsia. American journal of hypertension,
20(5), 573–8.
Pereira, T, Cabeleira, M., Matos, P., Borges, E., Cardoso,
J., & Correia, C. (2011a). Optical Methods for Local
Pulse Wave Velocity Assessment. In 4th International
Joint Conference on Biomedical Engineering Systems
and Technologies Rome Italy (pp. 74–81).
Pereira, T, Santos, I., Oliveira, T., Vaz, P., Santos, H.,
Pereira, H., Cardoso, J. (2013a). Local PWV and other
Hemodynamic Parameters Assessment : Validation of
a New Optical Technique in an Healthy Population. In
6th International Joint Conference on Biomedical
Engineering Systems and Technologies, Barcelona
Spain (Vol. 1, p. 10).
Pereira, Tânia, Oliveira, T., Cabeleira, M., Matos, P.,
Pereira, H. C., Almeida, V., … Correia, C. (2011b).
Signal Analysis in a New Optical Pulse Waveform
Profiler for Cardiovascular Applications. Signal and
Image Processing and Applications / 716: Artificial
Intelligence and Soft Computing, (Sipa), 19–25.
Pereira, Tânia, Santos, I., Oliveira, T., Vaz, P., Correia, T.,
Pereira, T., Correia, C. (2013b). Characterization of
Optical System for Hemodynamic Multi-Parameter
Assessment. Cardiovascular Engineering and
Technology, 4(1), 87–97.
Protogerou, A. D., Papaioannou, T. G., Sfikakis, P. P.,
Blacher, J., Karatzis, E., Lekakis, J. P., … Safar, M. E.
(2012). Differences in pulse pressure day variability
between the brachial artery and the aorta in healthy
subjects. Artery Research, 6(1), 34–40.
Tânia Pereira, Manuel Cabeleira, Patrícia Matos, Elisabeth
Borges, Vânia Almeida, João Cardoso, C. C. (2012).
Non-contact Pulse Wave Velocity Assessment.
Springer-Verlag Berlin Heidelberg 2012, BIOSTEC
2011, CCIS 273, (2), 246–257.
Vanmolkot, F. H. M., & de Hoon, J. N. J. M. (2005).
Reproducibility of forearm vasodilator response to
intra-arterial infusion of calcitonin gene-related
peptide assessed by venous occlusion
plethysmography. British journal of clinical
pharmacology, 59(4), 387–97.
Vappou, J., Luo, J., Okajima, K., Di Tullio, M., &
Konofagou, E. E. (2011). Non-invasive measurement
of local pulse pressure by pulse wave-based ultrasound
manometry (PWUM). Physiological measurement,
32(10), 1653–62.
BIOSIGNALS2014-InternationalConferenceonBio-inspiredSystemsandSignalProcessing
228
