
Finding Regularities in Courses Evaluation with K-means Clustering
R. Campagni, D. Merlini and M. C. Verri
Dipartimento di Statistica, Informatica, Applicazioni, Universit`a di Firenze
Viale Morgagni 65, 50134, Firenze, Italia
Keywords:
Educational Data Mining, K-means Clustering, Courses Evaluation, Assessment.
Abstract:
This paper presents an analysis about the courses evaluation made by university students together with their
results in the corresponding exams. The analysis concerns students and courses of a Computer Science pro-
gram of an Italian University from 2001/2002 to 2007/2008 academic years. Before the end of each course,
students evaluate different aspects of the course, such as the organization and the teaching. Evaluation data
and the results obtained by students in terms of grades and delays with which they take their exams can be
collected and reorganized in an appropriate way. Then we can use clustering techniques to analyze these data
thus show possible correlation between the evaluation of a course and the corresponding average results as
well as regularities among groups of courses over the years. The results of this type of analysis can possibly
suggest improvements in the teaching organization.
1 INTRODUCTION
The evaluation of university education is an important
process whose results can be used in the program-
ming and management of the educational activities
by monitoring resources (financial, human, structural
and others), services (orientation for students and ad-
ministrative offices), students careers, courses and oc-
cupancy rate. In order to evaluate all these aspects, it
is important to analyse the opinion of the users of uni-
versity education, i.e. the students.
The evaluation of the learning process falls in the
context of the Educational Data Mining (EDM), an
emerging and interesting research area that aims to
identify previously unknown regularities in educa-
tional databases, to understand and improve student
performance and the assessment of their learning pro-
cess. As described in (Romero and Ventura, 2010),
EDM uses statistical, machine learning and data min-
ing algorithms on different types of data related to the
field of education. It is concerned with developing
methods for exploring these data to better understand
the students and the frameworks in which they learn
thus possibly enhancing some aspects of the qual-
ity of education. Data mining techniques have also
been applied in computer-based and web-based ed-
ucational systems (see, e.g., (Romero et al., 2010;
Romero et al., 2008)). In this paper, we use a data
mining approach based on
K-means
clustering to link
the evaluation of courses taken by students with their
results, in terms of average grade and delay in the cor-
responding exams. We also analyse the evaluation of
courses over the years in order to identify similar be-
haviors or particular trends among courses, by using
an approach similar to time series clustering (see, e.g.,
(Liao, 2005)).
This study deepens the analysis presented in
(Campagni et al., 2013) and is analogous to that used
in (Campagni et al., 2012a; Campagni et al., 2012b;
Campagni et al., 2012c). The analysis refers to a
real case study concerning an Italian University but
it could be applied to different scenarios, except for
a possible reorganization of the involved data. The
data set is not very large but allows us to illustrate a
quite general methodology on a real case study. Our
approach uses standard data mining techniques, but
we think very interesting the concrete possibility of
applying these techniques to find and analyse patterns
in the context of university courses evaluation, even
in large universities.
2 DATA FOR ANALYSIS
In this section, we describe how courses are evalu-
ated by students at the Universityof Florence, in Italy,
with the aim of providing a methodology to search
for regularities in data concerning courses evalua-
tion. Therefore, the steps we present can be ap-
26
Campagni R., Merlini D. and Verri M..
Finding Regularities in Courses Evaluation with K-means Clustering.
DOI: 10.5220/0004796000260033
In Proceedings of the 6th International Conference on Computer Supported Education (CSEDU-2014), pages 26-33
ISBN: 978-989-758-021-5
Copyright
c
2014 SCITEPRESS (Science and Technology Publications, Lda.)

plied also in other academic contexts. In particular,
we refer to a Computer Science degree of the Sci-
ence School, under the Italian Ministerial Decree n.
509/1999. This academic degree was structured over
three years and every academic year was organized in
two semesters; there were several courses in each of
these six semesters and at the end of a semester stu-
dents could take their examinations. Exams could be
taken in different sessions during the same year, after
the end of the corresponding courses, or later.
Table 1 illustrates an example of students data af-
ter a preprocessing phase which allow us to integrate
original attributes, such as the grade and the date of
the exam, with both the semester in which the course
was given, Semester1, and the semester in which the
exam was taken, Semester2. Finally, we can com-
pute the value Delay as the difference between the
semester of the course and the semester in which the
student took the exam. We highlight that the values of
attributes Semester1 and Semester2 are not usually
stored in the databases of the universities, therefore
this preprocessing phase may be onerous.
At the University of Florence, starting from the
academic year 2001/2002, a database stores informa-
tion about evaluation of the courses quality of various
degree programs, among which we find the degree
under consideration. The results of this process are
available at the address (SISValDidat), under permis-
sion of the involved teacher, and show for each course
several pieces of information, such as the name of the
teacher who took the course and the average rating
given by students on various topics. Before the end of
each course (at about 2/3 of the course), students com-
pile, anonymously, a module to express their opinion
on the course just taken. This form is divided into the
following five paragraphs:
• paragraph 1, concerns the organization of the de-
gree program;
• paragraph 2, concerns the organization of the
course;
• paragraph 3, concerns the teacher;
• paragraph 4, concerns classrooms and equipment;
• paragraph 5, concerns the general satisfaction
about the course.
Each paragraph is composed by some questions; stu-
dents can choose among four levels of answers, two
negative and two positive levels (disagree, slightly
disagree, slightly agree, agree). For details the in-
terested reader can see the sample of the module in
(SISValDidat).
For each course of an academic year and for each
paragraph, we can compute the percentage of positive
answers, that is, of type slightly agree and agree by
grouping together all questions belonging to the same
paragraph and their average percentage value.
To relate data of students careers with courses
evaluation, for each course we can compute the aver-
age grade and the average delay attained by students
who took the exam in the same year. An example
of this data organization is illustrated in the first four
columns of Table 2. As already observed, the eval-
uation of courses is anonymous and is done only by
students who really take the course, therefore, in this
kind of organization, it may happen to consider in-
formation concerning exams of students who may not
be the same students who evaluated the courses. As
a consequence, we can only compare the results of
courses evaluation in a specific year with the aggre-
gate results of students who took the corresponding
exams in the same period. However, this data orga-
nization does not change a lot if it was possible to
identify the students involved in the courses evalu-
ation in order to connect properly the results of the
evaluation with those of exams. Obviously, in this
case we should ensure the privacy of results, for ex-
ample by using a differential privacy approach (see,
e.g., (Dwork, 2008)).
After a preprocessing phase, we can organize stu-
dents and evaluation data into two different ways by
taking into account the following fields:
• Exam, the code which identifies an exam;
• Year, the year of the evaluation;
• AvgGrade, the average grade of the exam;
• AvgDelay, the average delay, in semesters, of stu-
dents exams;
• Park(t), the percentage of positive evaluations of
paragraph k at time t.
In particular, Table 2 illustrates a sample of the dataset
which can be used to compare examination results and
courses evaluation while Table 3 represents a sample
of data that can be used to analyze the evolution over
the years of courses evaluation. As we will illustrate
in Section 3, data organized as in Table 2 will be clus-
tered with
K-means
algorithm by using the Euclidean
distance to separate the multidimensional points rep-
resenting some characteristic of a course in a spe-
cific year; data organized as in Table 3 will be rep-
resented in the plane as trajectories corresponding to
the evaluation of courses over the years and will be
clustered with the Manhattan distance. Both these ap-
proaches can be used to find regularities in courses
evaluations and can highlight criticalities or suggest
improvements in the teaching organization.
FindingRegularitiesinCoursesEvaluationwithK-meansClustering
27

Table 1: A sample of students data: grades in thirtieths.
Student Exam Date Grade Semester1 Semester2 Delay
100 10 2001-01-14 24 1 1 0
100 20 2002-12-20 27 2 3 1
200 20 2002-06-04 21 2 2 0
300 10 2001-01-29 26 1 3 2
400 10 2002-02-15 26 1 2 1
.
.
.
.
.
.
.
.
.
.
.
.
.
.
.
.
.
.
.
.
.
Table 2: Data organization for comparing examination results and courses evaluation.
Exam Year AvgGrade AvgDelay Par1 ... Par5
10 2001 25 1 51 ... 60
10 2002 26 1 50 ... 61
.
.
.
.
.
.
.
.
.
.
.
.
.
.
.
.
.
.
.
.
.
10 2007 25 1 81 ... 67
20 2001 24 0.5 56 ... 77
20 2002 26 1 62 ... 59
.
.
.
.
.
.
.
.
.
.
.
.
.
.
.
.
.
.
.
.
.
3 K-MEANS CLUSTERING WITH
EUCLIDEAN AND
MANHATTAN DISTANCES
Among the different data mining techniques, cluster-
ing is one of the most widely used methods. The
goal of cluster analysis is to group together objects
that are similar or related and, at the same time, are
different or unrelated to the objects in other clusters.
The greater the similarity (or homogeneity)is within a
group and the greater the differences between groups
are the more distinct the clusters are.
K-means
is
a very simple and well-known algorithm based on a
partitional approach; it was introduced in (MacQueen,
1967) and a detailed description can be found in (Tan
et al., 2006). In this algorithm, each cluster is associ-
ated with a centroid and each point is assigned to the
cluster with the closest centroid by using a particular
distance function. The centroids are iteratively com-
puted until a fixed point is found. The number K of
clusters must be specified. In particular, in this paper
we use both the Euclidean and Manhattan distance;
in the first case, the centroid of a cluster is computed
as the mean of the points in the cluster while in the
second case the appropriate centroid is the median of
the points (see, e.g., (Tan et al., 2006)).
The evaluation of the clustering model resulting
from the application of a cluster algorithm is not a
well developedor commonly used part of cluster anal-
ysis; nonetheless, cluster evaluation, or cluster vali-
dation, is important to measure the goodness of the
resulting clusters, for example to compare clustering
algorithms or to compare two sets of clusters. In our
analysis we measured cluster validity with correla-
tion, by using the concept of proximity matrix and in-
cidence matrix. Specifically, after obtaining the clus-
ters by applying
K-means
to a dataset, we computed
the proximity matrix P = (P
i, j
) having one row and
one column for each element of the dataset. In par-
ticular, each element P
i, j
represents the Euclidean,
or Manhattan, distance between elements i and j in
the dataset. Then, we computed the incidence matrix
I = (I
i, j
), where each element I
i, j
is 1 or 0 if the ele-
ments i and j belong to the same cluster or not. We
finally computed the Pearson’s correlation, as defined
in (Tan et al., 2006, page 77), between the linear rep-
resentation by rows of matrices P and I. Correlation
is always in the range -1 to 1, where a correlation of
1 (-1) means a perfect positive (negative) linear rela-
tionship.
As a first example, Table 4 illustrates the final
grade and the graduation time, expressed in years,
of a sample of graduated students. By applying the
K-means
algorithm to this dataset, with K = 2, Fi-
nalGrade and Time as clustering attributes and by
using the Euclidean distance, we obtain the follow-
ing two clusters, in terms of the student identifiers:
C
1
= {100, 400, 600, 700} and C
2
= {200, 300, 500};
the centroids of the clusters have coordinates C
1
=
(107, 3.5) and C
2
= (96, 5.33), respectively. Tables
5 and 6 show the proximity matrix and the incidence
matrix corresponding to clustersC
1
and C
2
of the data
set illustrated in Table 4. The Pearson’s correlation
between the linear representation of these two matri-
ces is −0.59, a medium value of correlation.
CSEDU2014-6thInternationalConferenceonComputerSupportedEducation
28
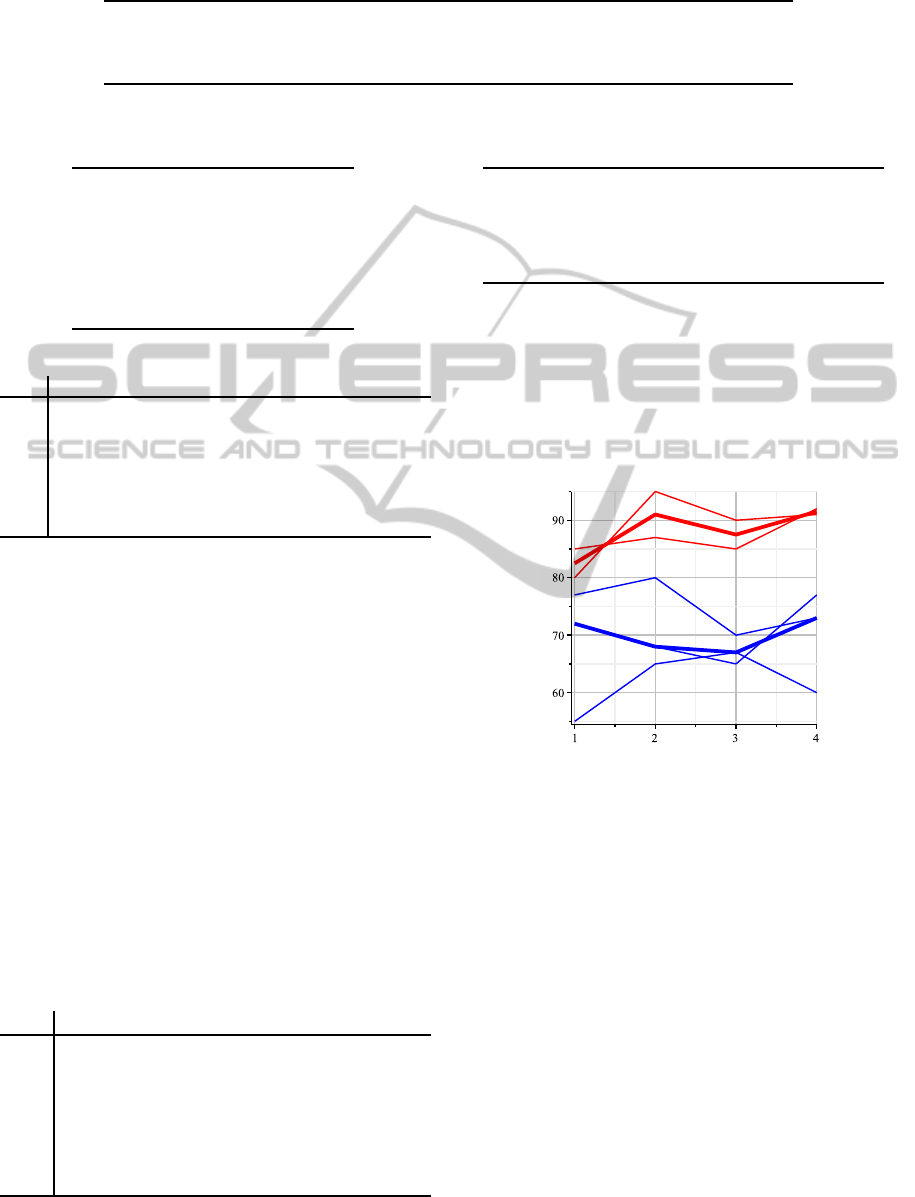
Table 3: Data organization for analyzing the trend over the years of courses evaluation.
Exam Par1(2001) ... Par1(2007) ... Par5(2001) .. . Par5(2007)
10 51 ... 81 ... 60 ... 67
20 56 ... 84 ... 77 ... 84
.
.
.
.
.
.
.
.
.
.
.
.
.
.
.
.
.
.
.
.
.
.
.
.
Table 4: A sample data set about students.
Student FinalGrade Time
100 110 3
200 95 5
300 100 5
400 103 4
500 98 6
600 106 4
700 109 3
Table 5: The proximity matrix for data of Table 4.
P
100 200 300 400 500 600 700
100 0
200
20.12 0
300
10.25 10 0
400
7.07 13.08 3.32 0
500
12.41 8.06 2.24 5.48 0
600
4.12 16.06 6.16 3 8.31 0
700
1 19.13 9.27 6.08 11.45 3.16 0
As another example, Table 7 shows a sample
of data concerning courses evaluation: in particu-
lar, each row contains the exam identifier and the
percentage of positive evaluation of a generic para-
graph at time t
i
, for i = 1, ··· , 4. We can apply the
K-means
algorithm to the dataset in Table 7, with
K = 2, Par(t
i
), for i = 1, · ·· , 4, as clustering at-
tributes and by using the Manhattan distance. This
means to represent each element of the data set as
a broken line connecting the points (t
i
,Par(t
i
)), for
i = 1, ··· , 4, in the cartesian plane. The Manhattan
distance between two broken lines thus corresponds
to the sum of the vertical distances between the ordi-
nates. By using the
K-means
algorithm, we obtain
the following two clusters in terms of course iden-
Table 6: The incidence matrix for clustering of data of Table
4.
I
100 200 300 400 500 600 700
100 1
200 0 1
300 0 1 1
400
1 0 0 1
500 0 1 1 0 1
600
1 0 0 1 0 1
700 1 0 0 1 0 1 1
Table 7: A sample data set about courses evaluation.
Exam Par(t
1
) Par(t
2
) Par(t
3
) Par(t
4
)
100 55 65 67 60
200 85 87 85 92
300 72 68 65 77
400 77 80 70 73
500 80 95 90 91
tifiers: C
1
= {200, 500} and C
2
= {100, 300, 400};
the centroids of the clusters are represented by
the sequences C
1
= [(1, 72), (2, 68), (3, 67), (4, 73)]
and C
2
= [(1, 82.5), (2, 91), (3, 87.5), (4, 91.5)], re-
spectively. Figure 1 illustrates the clustering result by
evidencing the centroids C
1
and C
2
.
Figure 1:
K-means
results with data of Table 7 with K = 2
and Manhattan distance, centroids in evidence.
Also in this case we can compute the Pearson’s
correlation by using the proximity and the incidence
matrices computed by using the Manhattan distance.
3.1 The Case Study
As already observed, the real datasets we analysed
concern courses and exams during the academic years
from 2001/2002 to 2007/2008 at the Computer Sci-
ence program of the University of Florence, in Italy.
In particular, the first data set is organized as illus-
trated in Table 2 and refers to the evaluation of 40
courses in seven different years. We explicitly ob-
serve that we did not consider in our analysis those
courses evaluated by a small number of students. For
clustering, we used the
K-means
implementation of
FindingRegularitiesinCoursesEvaluationwithK-meansClustering
29
Weka
(Witten et al., 2011), an open source software
for data mining analysis. The aim was to find if there
is a relation between the valuation of a course and
the results obtained by students in the correspond-
ing exam. We performed several tests with different
values of the parameter K and we selected different
groups of attributes. We point out that the attributes
selection is an important step and should be done ac-
cording to the preference of an expert of the domain,
for example the coordinator of the degree program.
For each choice of attributes, we applied the
K-means
algorithm with the Euclidean distance to identify the
clusters; then, we computed the Pearson’s correlation
by using the proximity and incidence matrices. The
tests we performed pointed out that the exams hav-
ing good results, in terms of average grade and delay,
correspond to courses having also a good evaluation
from students.
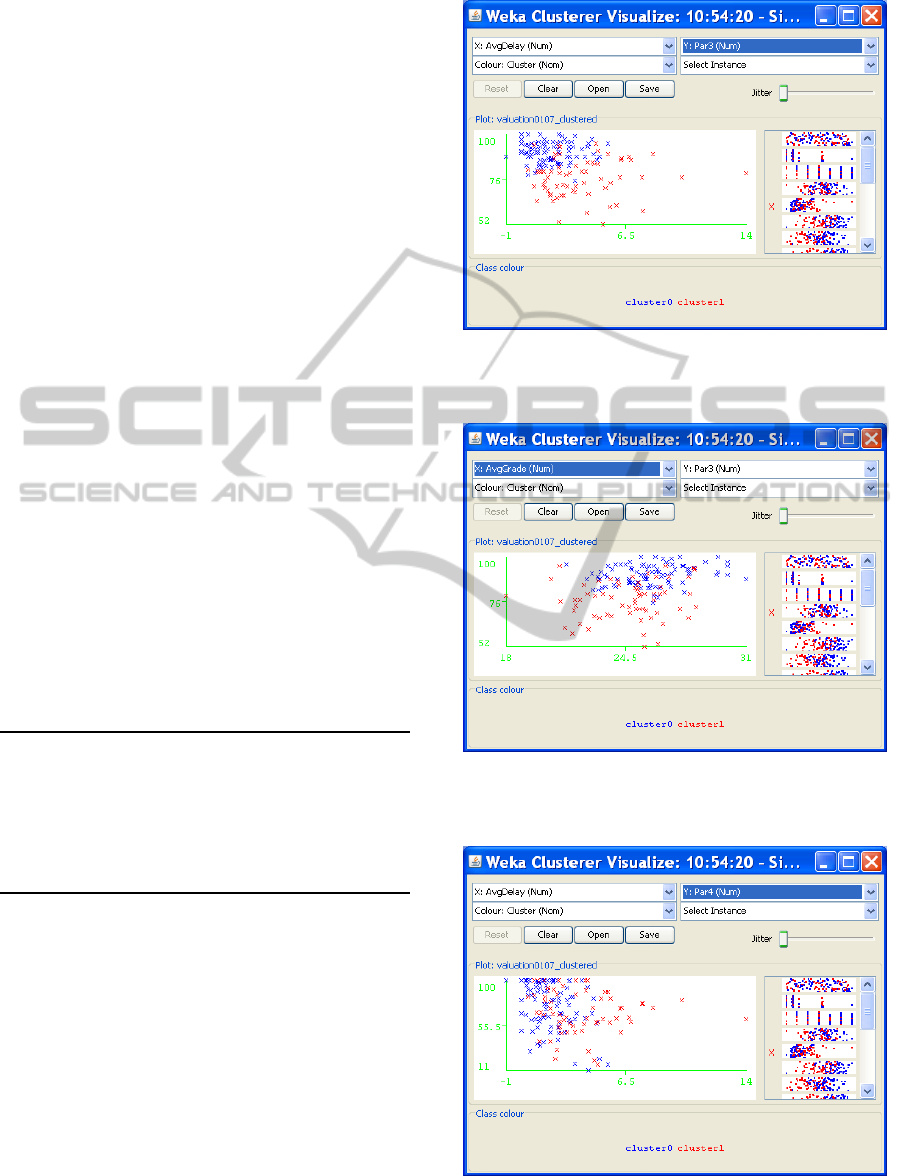
In particular, we used AvgGrade, AvgDelay,
Par1, Par2, Par3, Par4 and Par5 as clustering at-
tributes and K = 2, obtaining the clusters illustrated
in Figures 2, 3, 4 and 5; each figure represents the
projection of the clusters along two dimensions corre-
sponding to the following pairs of attributes AvgDe-
lay and Par3, AvgGrade and Par3, AvgDelay and
Par4 and, finally, AvgGrade and Par4. The cen-
troids of the resulting clusters are shown in Table 8,
which also contains the average values relative to the
full data set.
Table 8: The centroids of clusters in Figures 2, 3, 4, 5.
Attribute Full Data Cluster0 Cluster1
AvgGrade 25.31 25.85 24.58
AvgDelay 2.61 1.8 3.68
Par1 70.86 77.74 61.67
Par2 72.23 82.19 58.94
Par3 84.51 90.25 76.86
Par4 72.03 74.67 68.5
Par5 76.02 80.83 69.61
The cluster number 0, which correspond to 88
blue stars in the figures, contains the courses which
students took with small delay and that they evalu-
ated positively. On the other hand, cluster number 1,
corresponding to 66 red stars, contains those courses
which students took with a large delay and that they
evaluated less positively. We observe that the cen-
troids of the two clusters are very close relative to the
attribute Par4 which concerns classrooms and equip-
ment. This is also evidenced from Figures 4 and 5,
where the blue and red stars are less separated than
those in Figures 2 and 3. The Pearson’s correlation
corresponding to these clusters is equal to −0.35. We
obtained an improvement by excluding the attribute
Figure 2: Clusters of Table 8 with AvgDelay and Par3 in
evidence.
Figure 3: Clusters of Table 8 with AvgGrade and Par3 in
evidence.
Figure 4: Clusters of Table 8 with AvgDelay and Par4 in
evidence.
CSEDU2014-6thInternationalConferenceonComputerSupportedEducation
30
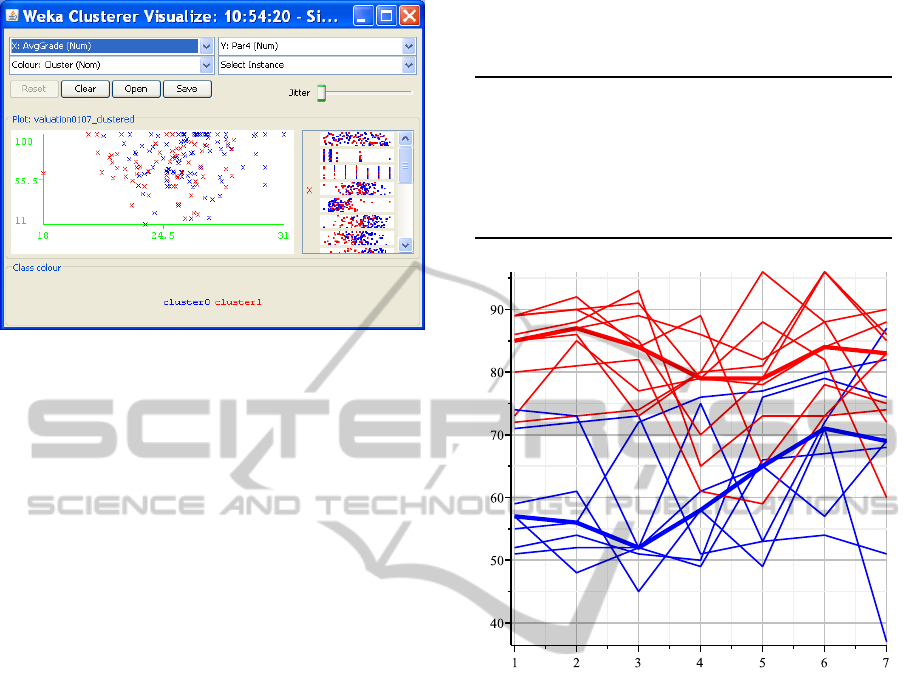
Figure 5: Clusters of Table 8 with AvgGrade and Par4 in
evidence.
Par4 from clustering, in fact in this case we find
a correlation equal to −0.51. In general, our tests
evidenced that the paragraphs evaluations which are
more correlated with students results regard attributes
Par2 and Par3, that is, those concerning the course
organization and the teacher. We point out that the
value K = 2 gave the best results in terms of correla-
tion.
Among the courses considered in the previous
data set, we selected those evaluated all seven years,
for a total of sixteen courses, some in Mathematics
and others in Computer Science. This time we are in-
terested in analysing data organized as in Table 3, by
considering the evaluation of a particular paragraph
over the years. The aim was to find if there are simi-
lar behaviors among courses, that is, if we can classify
courses according to their evaluations. We performed
several tests, by choosing a paragraph at a time. For
each choice of attributes, we applied the
K-means
al-
gorithm with the Manhattan distance to identify the
clusters; also in this case we computed the Pearson’s
correlation by using the proximity and incidence ma-
trices.
Figure 6 illustrates the result of
K-means
with K =
2, Manahattan distance and Par2(2001), Par2(2002),
·· ·, Par2(2007) as clustering attributes. The points
defining the centroid trajectories of the resulting clus-
ters are shown in Table 9, which also contains the me-
dian values relative to the full data set. The Pearson’s
correlation corresponding to these clusters is equal to
−0.64.
The figure puts well in evidence that the courses
are divided into two clusters with well distinct cen-
troids. The red cluster contains courses that have been
evaluated better over the years while the blue clus-
ter corresponds to courses that students rated worse.
Table 9: The points defining the centroid trajectories of
clusters in Figure 6.
Attribute Full Data Cluster0 Cluster1
Par2(2001) 73.5 85 57
Par2(2002) 77 87 56
Par2(2003) 73.5 84 52
Par2(2004) 72.5 79 58
Par2(2005) 74.5 79 65
Par2(2006) 78.5 84 71
Par2(2007) 75.5 83 69
Figure 6: Clusters of Table 9 with centroids in evidence:
each line represents the percentage of positive evaluations
about the organization of a course (paragraph 2) over the
years 2001-2007.
What is interesting, though not surprising, is that
all courses in the red cluster are Computer Science
courses while the blue cluster contains many Mathe-
matics courses. We highlight that the centroids show
rather clearly the behavior of the assessment over the
years. In particular, the evaluation of the courses in
the blue cluster has improvedoverthe years while that
of courses in the red cluster has remained more stable.
Also in this case the best results in terms of cor-
relation were found with K = 2; however, with K = 4
we found the courses rated worse distributed into two
clusters, one of which contains only the Mathemat-
ics courses. The corresponding centroid illustrates a
gradual improvement of the assessment for this type
of courses during the years under examination.
FindingRegularitiesinCoursesEvaluationwithK-meansClustering
31

4 CONCLUSION AND FUTURE
WORK
The results of the previous sections show, in a for-
mal way with data mining techniques, that there is
a relationship between the evaluation of the courses
from students and the results they obtained in the cor-
responding examinations. In particular, the analysis
performed on data related to the Computer Science
degree program under examination illustrates that the
courses which received a positive evaluation corre-
spond to exams in which students obtained a good
average mark and that they took with a small delay.
Conversely, the worst evaluations were given to those
courses which do not match good achievements by
students.
The analysis based on clustering with Manhattan
distance allows us to classify courses according to
the assessment received by students and can highlight
some regularities that emerge over the years or points
out some trend reversals due to changes of teachers.
In the Computer Science degree program just consid-
ered, for example, we observe the trend to give not
so good evaluation to Mathematics courses. Results
of this type point out a critical issue in the involved
courses and can be used to implement improvement
strategies.
We wish to emphasize that our analysis refers to
the courses evaluation that students make before tak-
ing the exams and knowing their grades. In fact, as
already observed, the evaluation module is given to
students before the end of the course. Surely, there
is the risk that their judgment is influenced by the
inherent difficulty of the course or by the comments
made by students of the previous years. To this pur-
pose, it is important that during the module compi-
lation the teacher explains that a serious assessment
of the course can increase the quality level of the in-
volved services. Students represent the end-users as
well as the principal actors of the formative services
offered by the University and the measure of their per-
ceived quality is essential for planning changes. How-
ever, the results of courses evaluation should always
be considered in a critical way and should not have the
goal of simplifying the contents to get best ratings.
In general, many other factors should be consid-
ered for evaluating courses and student success, as
addressed in (Romero and Ventura, 2010). The ap-
proach used in this work could be refined and deep-
ened if it was possible to identify the students in-
volved in the courses evaluation in order to connect
properly the results of the evaluation with those of ex-
ams. Moreover, it would be interesting to connect the
assessment of students with other information such
as the gender of students and teachers or the kind of
high school attended by students. Starting from the
academic year 2011/2012, the University of Florence
began to manage on line the evaluation module de-
scribed in Section 2. Therefore, in a next future, it
might be possible to proceed in this direction, tak-
ing into account appropriate strategies to maintain pri-
vacy.
An interesting additional source of information
could be given by social media sites, such as
Face-
book
or
Twitter
, used by students to post comments
about courses and teachers. It would be useful to link
this information with the results of students and their
official evaluations about teachings, in order to take
into account more feedbacks. In such a context, it
might be interesting to use text mining techniques to
classify the student comments and enrich the database
for an analysis similar to that illustrated in this work.
REFERENCES
Progetto SISValDidat. https://valmon.disia.unifi.it/
sisvaldidat/unifi/index.php.
Campagni, R., Merlini, D., and Sprugnoli, R. (2012a).
Analyzing paths in a student database. In The 5th
International Conference on Educational Data
Mining, Chania, Greece, pages 208–209.
Campagni, R., Merlini, D., and Sprugnoli, R.
(2012b). Data mining for a student database. In
ICTCS 2012, 13th Italian Conference on Theo-
retical Computer Science, Varese, Italy.
Campagni, R., Merlini, D., and Sprugnoli, R.
(2012c). Sequential patterns analysis in a student
database. In ECML-PKDD Workshop: Mining
and exploiting interpretable local patterns (I-Pat
2012), Bristol.
Campagni, R., Merlini, D., Sprugnoli, R., and Verri,
M. C. (2013). Comparing examination results
and courses evaluation: a data mining approach.
In Didamatica 2013, Pisa, Area della Ricerca
CNR, AICA, pages 893–902.
Dwork, C. (2008). Differential privacy: a survey of
results. In Theory and Applications of Models
of Computation, 5th International Conference,
TAMC 2008, pages 1–19.
Liao, T. W. (2005). Clustering of time series data: a
survey. Pattern Recognition, 38(11):1857–1874.
MacQueen, J. (1967). Some methods for classifica-
tions and analysis of multivariate observations.
In Proc. of the 5th Berkeley Symp. on Mathemat-
ical Statistics and Probability. University of Cal-
ifornia Press., pages 281–297.
CSEDU2014-6thInternationalConferenceonComputerSupportedEducation
32

Romero, C., Romero, J. R., Luna, J. M., and Ven-
tura, S. (2010). Mining rare association rules
from e-learning data. In The 3rd International
Conference on Educational Data Mining, pages
171–180.
Romero, C. and Ventura, S. (2010). Educational Data
Mining: A Review of the State of the Art. IEEE
Transactions on systems, man and cybernetics,
40(6):601–618.
Romero, C., Ventura, S., and Garc´ıa, E. (2008). Data
mining in course management systems: Moodle
case study and tutorial. Computers & Education,
51(1):368–384.
Tan, P. N., Steinbach, M., and Kumar, V. (2006). In-
troduction to Data Mining. Addison-Wesley.
Witten, I. H., Frank, E., and Hall, M. A. (2011). Data
Mining: Practical Machine Learning Tools and
Techniques, Third Edition. Morgan Kaufmann.
FindingRegularitiesinCoursesEvaluationwithK-meansClustering
33
