
Feasibility Estimation for Clinical Trials
Zhisheng Huang
1
, Frank van Harmelen
1
, Annette ten Teije
1
and Andre Dekker
2
1
Department of Computer Science, VU University, Amsterdam, The Netherlands
2
MAASTRO Clinic, Maastricht, The Netherlands
Keywords:
Clinical Trial, Decision Support System, Trial Feasibility.
Abstract:
At least 90% of clinical trials are extended by at least 6 weeks because investigators fail to enroll patients on
schedule (Ledford, 2011). It is therefore important at trial design-time to have good insight in how the choice
of the eligibility criteria affects the recruitment rate. Based on that insight, trial designers can then adjust the
eligibility criteria in order to ensure realistic recruiting rates. In this paper we propose a simple mathematical
model to determine how eligibility criteria determine the recruitment rate. Our model allows us to calculate
a newly proposed ”relative” measure for the effect of an eligibility condition on the recruitment rate: instead
of estimating the recruitment rate of the total set of conditions, our new relative measure calculates the effect
of adding, removing or changing an individual condition in the light of the other conditions. This allows for a
much more fine-grained insight into the effect of individual trial-conditions, and into the interactions between
the conditions. We have implemented this mathematical model in efficient algorithms, and we demonstrate our
model on both real and synthetic patient data. Our experiments show that almost all medical trials in our test
corpus contain logically redundant criteria, and that this redundancy can only be revealed with our new relative
feasibility measure (and not with the classical absolute feasibility measure). To increase the reproducibility of
our results, we have made our datasets available online.
1 INTRODUCTION
Motivation. Trial recruitment is challenging for med-
ical researchers, who frequently overestimate the pool
of qualified, willing participants (Galbreath et al.,
2008). A recent Nature paper reported that at least
90% of trials are extended by at least 6 weeks be-
cause investigators fail to enroll patients on schedule
(Ledford, 2011). But already over a decade ago, re-
cruitment challenges were reported to be the cause of
45% of study delays, with delays often exceeding six
months(Anderson, 2001), while another meta-study
at the time reported that 17% of trials studied failed
to reach even half their target recruitment (Haidich
and Ioannidis, 2001). These problems persist until
the present day: a recent report prepared for the UK
Parliament reports that of 114 trials studied, less than
one-third recruited their original target within the time
originally specified, and around one-third had exten-
sions (Campbell et al., 2007). The same report also
succinctly describes the problems caused by inade-
quate recruiting rates: “One of the most commonly
reported problems with the conduct of multicentre
RCTs, however, is that recruitment is slower or more
difficult than expected, with many trials failing to
reach their planned sample size within the timescale
and funding originally envisaged (Gates et al., 2009).
If the target sample size is not achieved, the trial has
less statistical power to detect potentially important
clinical differences between the groups, so the results
may be less useful. In addition, if recruitment has to
be extended to reach the required sample size, the trial
will cost more and take longer, delaying the use of the
results in clinical practice”.
Research Question. Given these persistent and
costly problems, it is clearly important that trial de-
signers are given the tools to perform an accurate esti-
mate of trial feasibility (Wang and Bakhai, 2006) in-
cluding accurate estimates of recruiting rates. Such
tools will help them to avoid overly restrictive trial
criteria, thereby avoiding low recruitment rates.
This leads us to the central question of this pa-
per: given the characteristics of the patient popula-
tion, which trial conditions will lead to which cohort
size?
Scope. A general notion of trial feasibility would
consider all relevant issues which may have effect on
the feasibility of a trial. These include issues such
as availability of medical equipment, costs, legal and
regulatory conditions, skills and availability of staff,
and many others (Rajadhyaksha, 2010). Such consid-
erations are out of scope of the current paper, where
68
Huang Z., van Harmelen F., Ten Teije A. and Dekker A..
Feasibility Estimation for Clinical Trials.
DOI: 10.5220/0004795500680077
In Proceedings of the International Conference on Health Informatics (HEALTHINF-2014), pages 68-77
ISBN: 978-989-758-010-9
Copyright
c
2014 SCITEPRESS (Science and Technology Publications, Lda.)

we focus exclusively on the estimation of recruitment
rates induced by the eligibility criteria of a clinical
trial, given properties of the cohort population.
Trial feasibility estimation is closely related to the
well-studied task of trial recruitment. Both feasibil-
ity estimation and recruitment rely on answering the
same question: does a set of trial conditions apply
to a given patient? Nevertheless, there are impor-
tant differences, which make trial feasibility estima-
tion substantially different from trial recruiting: pa-
tient recruitment considers how to apply a criterion to
a patient, whereas trial feasibility estimation investi-
gates the effects of applying a criterion to a patient for
recruitment rates. In recruitment, the trial criteria are
fixed, and the patient population changes as new pa-
tients arrive, while in feasibility estimation the (prop-
erties of the) patient population are fixed, and the trial
criteria can be varied in order to obtain the desired re-
cruitment rate. Finally, trial recruiting is considered
to be “on-line”, i.e., is executed in a clinical setting,
while trial feasibility is considered to be “off-line”,
i.e., is executing during the design phase of a trial.
Approach. In this paper, we will distinguish two
kinds of trial feasibility: absolute feasibility and rel-
ative feasibility. The former considers the effect of
a total set of conditions, whereas the latter considers
the effect of adding, removing or changing individ-
ual conditions in the presence of other conditions. In
this paper, we propose a simple mathematical model
of trial feasibility to explore the distinction between
absolute feasibility and relative feasibility. This will
show that our novel notion of relative feasibility is a
useful notion in the design of a clinical trial.
A workflow of trial feasibility usually consists of
the following steps:
1. Start with new or existing trial design
2. Determine required cohort size (statistical power)
3. Determine absolute feasibility of current design
4. Explore relative impact of modifying some condi-
tions
5. Repeat steps 3-4.
This workflow has been implemented and inte-
grated with SemanticCT, a semantically-enabled sys-
tem for clinical trials (Huang et al., 2013b; Huang
et al., 2013a). We have conducted several experi-
ments to test our approach to trial feasibility analy-
sis with a set of real patient data at a clinic in the
Netherlands, and with a set of synthetic patient data,
which are generated by using a knowledge-based pa-
tient data generator (Huang et al., 2013c). These ex-
periments show that the notion of relative feasibility is
indeed very useful for the analysis of trial feasibility.
Structure and Contributions of this Paper. The
rest of this paper is organized as follows: Section 2
gives a brief overview of the relatively small literature
devoted to trial feasibility analysis. Section 3 presents
a formal model of trial feasibility. Section 4 discusses
the implementation of trial feasibility. Section 5 re-
ports several experiments and make the evaluation on
the proposed approach. Section 6 discusses the find-
ings from our experiments, and the last Section 7 con-
cludes and briefly discusses future work.
2 RELATED WORK
(Weng et al., 2010) is an excellent review of formal-
ization of eligibility criteria. Often the formalization
of eligibility criteria is done for purposes of trial re-
cruitment, or for authoring criteria. In our work we
focus on the task of trial feasibility estimation, which
of course also needs a formalised version of criteria in
order to test eligibility statistics across a cohort. We
use a rule-based formalization for the eligibility crite-
ria (Huang et al., 2013a).
EligWriter (Gennari et al., 2001) and Design-a-
Trial (Nammuni et al., 2004) support the reuse of eli-
gibility criteria when authoring clinical trials, while
ERGO (Tu et al., 2009) supports the annotation of
such criteria during authoring. The system Design-
a-trial (Nammuni et al., 2004) helps to determine var-
ious statistical values that are needed for trial design
(for instance minimal number of participants), as well
as ethical issues (e.g. choosing a drug with the least
side effects) and preparing required documentation,
but it does not provide any support for trial feasibility
or design of eligibility criteria.
Epoch (Shankar et al., 2006) is a tool to support
clinical trials management. The increasing complex-
ity of clinical trials has generated an enormous re-
quirements for knowledge and information specifica-
tion at all stages of the trials, including planning, doc-
umentation, implementation, and analysis, justifying
the need for such a tool.
In (Thew et al., 2011), the authors have devel-
oped FARSITE (Feasibility Assessment and Recruit-
ment System for Improving Trial Efficiency), a sys-
tem to support the evaluation of trial feasibility by
providing accurate assessments of the number of pa-
tients eligible for a particular trial. FARSITE also
provides support for automated patient recruitment.
FARSITE runs recruitment criteria for on-going clin-
ical trials and compares the estimated number of eligi-
ble patients for the trial with actual recruitment rates.
A strong correlation is observed between protocols
with a low FARSITE recruitment estimation and trials
struggling to recruit participants.
Other tools that enable users to define the eli-
gibility criteria and return counts for patients that
match the criteria definitions are i2b2/SHRINE (We-
FeasibilityEstimationforClinicalTrials
69

Figure 1: Trial feasibility with two inclusion criteria and
two exclusion criteria.
ber et al., 2009) and VISAGE (Zhang et al., 2010).
However none of these systems has any notion of ab-
solute feasibility or relative feasibility, such as those
that we will introduce in this paper.
Qiagram
1
is a data exploration tool, designed to
make data more useful through visualisation of data-
queries. When applied to medical trials, Qiagram pro-
vides a visualisation of the inclusion and exclusion
criteria as complex queries. Again, there is no analy-
sis of the inclusion and exclusion criteria in depth by
using notion as absolute and relative feasibility.
From this brief survey, we therefore conclude that,
to the best of our knowledge, no notions of relative
feasibility has been defined in the literature, nor has
any such notion been effectively implemented.
3 A FORMAL MODEL OF TRIAL
FEASIBILITY
In this section, we propose a light-weight formal
model of trial feasibility. We consider a set of pa-
tients P, and a set of criteria C, which is the union
of two disjoint sets: the inclusion criteria IC, and
the exclusion criteria EC. The function p is a map-
ping from the criteria C into a subset of P, which
states those patients meet the condition. Formally,
p : C → Powerset(P) and p(c) ⊆ P for each c ∈ C.
We use the notation ep(IC,EC) to denote the set of
eligible patients with respect to the inclusion criteria
IC and the exclusion criteria EC.
If we consider two inclusion criteria ic
1
and ic
2
,
and two exclusion criteria ec
1
and ec
2
, the eligible pa-
tients are those that simultaneously meet both inclu-
sion criteria and do not meet any exclusion criterion.
This can be formalized as
ep({ic
1
,ic
2
},{ec
1
,ec
2
}) =
(p(ic
1
) ∩ p(ic
2
)) \ (p(ec
1
) ∪ p(ec
2
)).
which is shown in Figure 1.
1
http://www.slideshare.net/shc66columbia/clinical-trial
-feasibility-using-healthcare-data
In general, for the inclusion criteria IC and the ex-
clusion criteria EC, the eligible patients are those pa-
tients meet all the inclusion and none of the exclusion
criteria. It can be formalized as:
Definition 1 (Eligible Patients).
ep(IC,EC) =
\
i∈IC
p(i) \
[
e∈EC
p(e).
Thus, the absolute feasibility of a criterion AF(c)
is defined to be the percentage of patients that would
be eligible out of the total patient set. Thus, for an
inclusion criterion c, the absolute feasibility is the ra-
tio of eligible patients p(c) to the total patient set, i.e.,
the patient set P. Similarly, for an exclusion criteria,
p(c) denotes that the set of the patients meet the cri-
terion c. Thus, the eligible patients would be the set
P − p(c). Formally:
Definition 2 (Absolute Feasibility).
AF(c) = |p(c)|/|P| for c ∈ IC.
AF(c) = 1 − |p(c)|/|P| for c ∈ EC.
If the set of criteria C is an empty set, all patients
should be considered to be eligible. If p(c) is an
empty set, that means that no patients are eligible for
criterion c. In that case, the criterion c is said to be an
unsatisfiable criterion (with respect to the patient set
P). We have the following formal propositions about
the absolute feasibility:
Proposition 1.
(1) If an inclusion criterion c is unsatisfiable, then its
absolute feasibility is 0, i.e., AF(c) = 0.
(2) If an exclusion criterion e is unsatisfiable, then its
absolute feasibility is 1, i.e., AF(e) = 1.
The absolute feasibility of a criterion tells us about
the recruitment rate when the criterion is considered
in isolation. However, we are interested in the effect
of a single criterion with respect to other criteria. To
make this clear, consider the following two observa-
tions.
Observation 1. A bigger coverage of exclusion crite-
ria does not necessarily lead to a lower feasibility.
That observation can be seen in Figure 2, in which
a bigger exclusion criterion EC3 has no intersection
with the intersection of the two inclusion criterion IC1
and IC2. Thus, EC3 does not lead to any change in
the eligible patient set.
Similarly:
Observation 2. A bigger coverage of inclusion crite-
ria does not necessarily lead to a higher feasibility.
That observation can be seen in Figure 3, in which
a bigger inclusion criterion IC3 already covers the in-
tersection of the other two inclusion criteria IC1 and
HEALTHINF2014-InternationalConferenceonHealthInformatics
70

Figure 2: Observation 1.
Figure 3: Observation 2.
IC2. Thus, IC3 does not lead to any change in the el-
igible patient set. This shows that the interaction be-
tween inclusion/exclusion criteria play a crucial role.
We therefore propose the relative feasibility which
compares the differences with and without a criterion
in the light of all the other criteria. Consider a case
which is shown in Figure 4. Here, the relative fea-
sibility RF of the inclusion criterion IC1 is the ratio
of the cardinality of the set a to the cardinality of the
union set of a and b. Similarly, the relative feasibility
of the exclusion criteria EC1 is the ratio of the cardi-
nality of the set a to the cardinality of the union of the
set a and the set d. Namely,
RF(IC,EC, IC1) = |a|/|(a + b)|, for IC1 ∈ IC,
RF(IC,EC, EC1) = |d|/|(a +d)|, for EC1 ∈ EC.
As we have discussed above, the eligible patient
function ep(IC,EC) is defined as:
ep(IC,EC) =
d f
\
i∈IC
p(i) \
[
e∈EC
p(e).
We will now use the notation ep(IC, EC, c) to denote
the eligible patient set if the criterion c is not consid-
ered. Formally:
Definition 3 (Eligible patients without criterion c).
ep(IC,EC,c) =
d f
ep(IC \ {c},EC \ {c}).
Thus, we have:
ep(IC,EC,c) =
\
i∈IC\{c}
p(i) \
[
e∈EC\{c}
p(e).
It is easy to prove the following proposition:
Proposition 2. Removing a criteria never makes the
eligible patient set smaller (and possibly larger):
ep(IC,EC) ⊆ ep(IC,EC,c) for any c ∈ IC ∪ EC.
We define the relative feasibility RF for a criterion
c as follows:
Definition 4 (Relative Feasibility).
RF(IC,EC, c) =
if c ∈ IC :
|ep(IC,EC)|
|ep(IC,EC,c)|
if c ∈ EC :
|(ep(IC,EC,c) \ ep(IC,EC))|
|ep(IC,EC,c)|
RF(IC,EC, c) is defined as 0 when ep(IC,EC,c) =
/
0.
Assume that a trial-designer is removing a crite-
rion c to get from an existing (small) population to a
new (larger) recruited population, then ep(IC, EC) is
the “old” population, ep(IC, EC, c) is the “new” pop-
ulation, and ep(IC,EC,c) − ep(IC, EC) is the “gain”
in population by removing c. The definition above can
then be intuitively read as: for an inclusion criteria c,
RF(IC,EC, c) = old/new, and for an exclusion crite-
ria, RF(IC,EC, c) = (new − old)/new = gain/new.
The interpretation of RF(IC,EC, c) is very dif-
ferent for inclusion and exclusion criteria: for inclu-
sion criteria, the meaning of RF is the fraction of the
new population that was already in the old population.
Thus, if we aim to increase the population, we should
remove a c that has a small value of RF. For exclusion
criteria, the meaning of RF is the fraction of the new
population that was gained over the old population.
Thus, if we aim to increase the population, we should
aim to remove a c that has a large value of RF. So,
sometimes we must minimise RF to get a larger pop-
ulation (inclusion) and sometimes we must maximise
RF to get a larger population (exclusion).
In order to emphasise the asymmetry in the defi-
nition above, we can introduce two new notations for
relative feasibility RF as follows:
RF
i
(IC, c) =
|ep(IC,EC)|
|ep(IC,EC,c)|
for c ∈ IC, and
RF
e
(EC,c) =
|ep(IC,EC,c) \ ep(IC,EC)|
|ep(IC,EC,c)|
for c ∈ EC.
It is easy to see that the following propositions
hold, which are useful to tell us about the relative fea-
sibility and its relation with the absolute feasibility.
FeasibilityEstimationforClinicalTrials
71

Figure 4: Relative Feasibility.
Proposition 3.
1. (Unsatisfiability) If c is unsatisfiable and c ∈ IC,
then ep(IC,EC) =
/
0.
2. (Zero inclusion feasibility) If c is unsatisfiable and
c ∈ IC, then RF
i
(IC, c
0
) = 0 for c
0
∈ IC.
3. (Inclusion Singleton) RF({c},
/
0,c) = AF(c) for
any c.
4. (Exclusion Singleton) RF(
/
0,{c}, c) = 1 − AF(c)
for any c.
A criterion c is said to be implied by other crite-
ria if ep(IC, EC) = ep(IC,EC, c). This means that
removing an implied criterion will not lead to any
change on the feasibility (ie. the same population).
Thus, we have the following propositions:
Proposition 4.
1. (Implied Inclusion Criteria) For any c ∈ IC, if c is
implied by other criteria, then RF(c) = 1.
2. (Implied Exclusion Criteria) For any c ∈ EC, if c is
implied by other criteria, then RF(c) = 0.
The proposition above tells us that we should fo-
cus on those inclusion criteria for which the relative
feasibilities are not equal to 1 and those exclusion cri-
teria for which the relative feasibilities are not equal
to 0, if we want to increase the feasibility of a clinical
trial. Remember RF
i
(c) means the fraction of the new
population (=without c) that was already in the old
population (=with c). RF
e
(c) means the fraction of
the new population (=without c) that was gained over
the old population (=with c). A satisfiable inclusion
criterion c is said to be inconsistent with other criteria
if ep(IC,EC,c) 6=
/
0 and ep(IC,EC) =
/
0.
Proposition 5.
1. (Inconsistent Inclusion Criteria) For any c ∈ IC, if
c is inconsistent with other criteria, then RF
i
(IC, c) =
0.
2. (Inconsistent Exclusion Criteria) For any c ∈
EC, if c is inconsistent with other criteria, then
RF
e
(EC,c) = 0.
The proposition above tells us that we should
avoid those inconsistent criteria. Namely, removing
those inclusion criteria for which the relative feasi-
bilities are equal to 0 and those exclusion criteria for
which the relative feasibilities are equal to 1. We dis-
cuss those cases in the section about the experiments
of trial feasibility.
4 IMPLEMENTATION
We have implemented the proposed approach of trial
feasibility in SemanticCT
2
, a semantically-enabled
system for clinical trials (Huang et al., 2013b; Huang
et al., 2013a). The goal of SemanticCT is not only
to achieve interoperability by semantic integration of
heterogeneous data in clinical trials, but also to fa-
cilitate automatic reasoning and data processing ser-
vices for decision support systems in various settings
of clinical trials.
In SemanticCT, the trial feasibility service pro-
vides functionality to change eligibility criteria and
their parameters, and to support this process by cal-
culating the absolute and relative feasibility (Figure
5). The following different parameters are taken into
account in this process:
• Cohort Size: the number of patients required for
running the trial. This is typically determined as
the result of an analysis about the desired statisti-
cal power of the trial.
• Consent Rate: The percentage of patients that will
agree to take part in the trial. This is typically de-
termined on the basis of experience in other trials
at the same location, or of similar trials in other
locations.
• Dropout Rate: The percentage of patients that is
likely to stop participating during the trial. Again,
this number is typically determined by previous
experience and statistics.
2
http://wasp.cs.vu.nl/sct
HEALTHINF2014-InternationalConferenceonHealthInformatics
72

Figure 5: GUI of Trial Feasibility.
• Target Number: The number of patients that
should be approached, in order to meet the cohort
size, given consent rate and dropout rate.
TargetNr =
CohortSize
ConsentRate ∗ (1 − DropoutRate)
The user can select an initial set of trial eligibility
criteria either from scratch or by using a trial tem-
plate. Figure 5 shows an example which uses a pre-
viously defined trial NCT00001385
3
. The user can
also select different parameters for the cohort size, the
consent rate and the dropout rate. Typically, sophis-
ticated statistical techniques are used to determine
these, and in this paper, we assume that these are de-
termined by other services. The designers of a clin-
ical trial can then follow the workflow described in
the previous section to find a balance between medi-
cal specificity of the eligibility conditions and the trial
feasibility.
5 EXPERIMENTS
In this section, we present a set of experiments to
test the value of our trial feasibility measures. For
this experiment, we provide a set of clinical trials for
breast cancer from the NCI corpus of clinical trials
4
as well as a clinical trial for breast cancer at the Dutch
clinic MAASTRO
5
. In combination with these two
trials, we use two sets of patients data for our ex-
periments. The first data set ZSH2013A is artificial
data of 10,000 breast cancer patients, which are gen-
erated with a knowledge-based patient data generator
(Huang et al., 2013c). This generates patient data that
are artificial, but that are guaranteed to follow statisti-
cally realistic distributions of values, using rules that
are based on background knowledge from the medi-
cal literature. The second data set MST 2013A is real
3
from http://clinicaltrials.gov/
4
http://clinicaltrials.gov/
5
http://www.maastro.nl/
data of 3,312 breast cancer patients at the MAASTRO
clinic.
Using these data, we performed 16 experiments
of calculating trial feasibility with different criteria,
different parameters in those criteria, and different
cohort sizes. To simplify the description of the ex-
periments, we assume that those experiments use the
same consent rate (30%) and the same dropout rate
(20%). Of course, it is quite easy to use different
consent and dropout rates for different experiments.
To increase the reproducibility of our results, we have
made available both the full set of trials and our syn-
thetic patient-data
6
as well as the anonymised patient
data from the MAASTRO clinic
7
.
The results of the 16 experiments on trial feasi-
bility are shown in Table 1. In the table, we use
the sign ⇒ to denote that a criterion is modified
into another criterion. For example, stage(2,4) ⇒
stage(1,4) means that the criterion ’tumor stage from
2 to 4’ is modified into the criterion ’stage from 1 to
4’. We use the sign ’-’ to denote that a criterion is re-
moved. For example, menopausal(premenopausal)-
means that the criterion ’menopausal status is pre-
menopausal’ is removed. Similarly, we use the sign
’+’ to denote that a criterion is added.
For example, in the experiment no.1, we select the
trial NCT00001385 as the template, with a cohort size
of 200, a consent rate of 30% and a dropout rate of
20%, leading to the target number 833, according to
the equation above. The three inclusion criteria and
three exclusion criteria from experiment no. 1 are de-
scribed in Figure 6(a).
The experiment result shows that the target num-
ber is feasible with the absolute feasibility values
shown in Figure 6(a). Actually the system finds 2960
eligible patients for those criteria from the 10,000
patients in dataset ZSH2013A. Notice that ’gen-
der(female)’ has an absolute feasibility of 1, which
means that all patients satisfy this condition. In the
absolute feasibility graph shown in Figure 6(a), a high
score on an inclusion criterion means that the crite-
rion alone is not very selective, in other words most
patients are included. Similarly, a high score for an
exclusion criterion means that only very few patients
are excluded only based on that particular criterion,
for instance only 47 patients are excluded by only tak-
ing into account the pregnancy condition.
Figure 6(b) shows the relative feasibility rates of
the same experiment. This already reveals the more
discriminative power of relative feasibility: the abso-
lute feasibility of the ’diagnosis(invasive carcinoma)’
criterion (figure 6(a)) seems to suggest that this is a
strongly selective criterion (an absolute feasibility of
6
http://wasp.cs.vu.nl/apdg/download
7
http://www.cancerdata.org
FeasibilityEstimationforClinicalTrials
73

Table 1: Experiments of Trial Feasibility. PD=patient data set, CS=cohort size, TN= target number, EP=eligible patient, C
= total number of criteria, IC = nr. of inclusion criteria, EC = nr. of exclusion criteria, AF = absolute feasibility, F=feasible,
ZSH=ZSH2013A, MST=MST2013A.
No. PD TrialTemplate CS TN C IC EC EP AF F Modified Criteria
1 ZSH NCT00001385 200 833 6 3 3 2960 0.2960 yes none
2 ZSH NCT00001385 800 3333 6 3 3 2960 0.2960 no none
3 ZSH NCT00001385 800 3333 6 3 3 5626 0.2960 yes stage(2,4)⇒stage(1,4)
4 ZSH NCT00002720 200 833 7 7 0 468 0.0468 no none
5 ZSH NCT00002720 200 833 7 7 0 628 0.0628 no age(65,80)⇒age(45,80)
6 ZSH NCT00002720 200 833 7 7 0 1069 0.1069 yes age(65,80)⇒age(45,80),
stage(1,1)⇒stage(1,2)
7 ZSH NCT00005079 200 833 8 4 4 309 0.0309 no none
8 ZSH NCT00005079 200 833 8 3 4 5421 0.5421 yes menopausal(premenopausal)-,
9 ZSH NCT00005079 200 833 8 4 4 1013 0.1013 yes menopausal(premenopausal)-,
age(30,50)+
10 MST MST0000IRMA 200 833 9 5 4 1164 0.3510 yes none
11 MST MST0000IRMA 300 1250 9 5 4 1164 0.3510 no none
12 MST MST0000IRMA 300 1250 9 5 4 1182 0.3570 no wellbeing(0,2)⇒wellbeing(0,3)
13 MST MST0000IRMA 300 1250 9 5 4 1264 0.3820 yes wellbeing(0,2)⇒wellbeing(0,3),
t(0,3)⇒t(0,5)
14 ZSH MST0000IRMA 200 833 6 3 3 2633 0.2630 yes none
15 ZSH MST0000IRMA 800 3333 6 3 3 2633 0.2630 no none
16 ZSH MST0000IRMA 800 3333 6 3 3 3500 0.3500 yes t(0,3)⇒t(0,5)
(a) Absolute (b) Relative
Figure 6: Absolute and relative feasibility of experiment no.1.
just under 0.6). However, the relative feasibility from
figure 6(b) shows that in fact, in the light of the other
criteria, its selective power is nil (a relative feasibil-
ity rate of 1). This is so because the staging criterion
(’stage(2,4)’) already implies that the diagnosis must
be an invasive carcinoma. Thus, the relative feasi-
bility rate of 1 reveals that strictly speaking, the di-
agnostic eligibility criterion in trial NCT00001385 is
superfluous.
In the second experiment (the second row of Ta-
ble 1), we change the cohort size from 200 into 800.
That results in a new target number of 3333. It is easy
to see that the trial is not feasible with this new target
number, because 2,960 patients are eligible. Thus, we
have to change some criteria to make this trial feasi-
ble. From the list of absolute feasibility rates, we see
that both the staging criterion and the diagnostic cri-
terion have small absolute feasibility rates, seemingly
implying that changing either of them might result
in a higher recruitment rate. However, as explained
above, looking at the relative feasibility rates reveals
that the diagnostic criterion is already implied by the
other criteria, and hence changing the diagnostic cri-
terion is unlikely to have much effect on the recruiting
HEALTHINF2014-InternationalConferenceonHealthInformatics
74

rate, and only the staging criterion is a good candidate
for revising the trial definition in order to obtain the
required target number of patients.
Thus, in a new experiment (experiment no.3),
we change the criterion ’stage(2,4)’ into the criterion
’stage(1,4)’, which leads to a bigger set of 5626 eligi-
ble patients, which exceeds the target number of 3333
patients, and which therefore makes the trial feasible.
Similar experiments are done with a trial at the
MAASTRO clinic (trial no. MST0000IRMA) using
the data on actual MAASTRO patients (patient data
set MST2013A, experiment nr. 10-13) and the virtual
data set ZSH2013A (experiment nr. 14-16). The sce-
narios in those experiments again tell us that it is more
useful to check the relative feasibility if we encounter
multiple options to change criteria. The relative feasi-
bility exposes those criteria which have been implied
by other criteria, or which are inconsistent with other
criteria, so that we can focus on redesigning the crite-
ria that have a relative feasibility rate lower than 1.
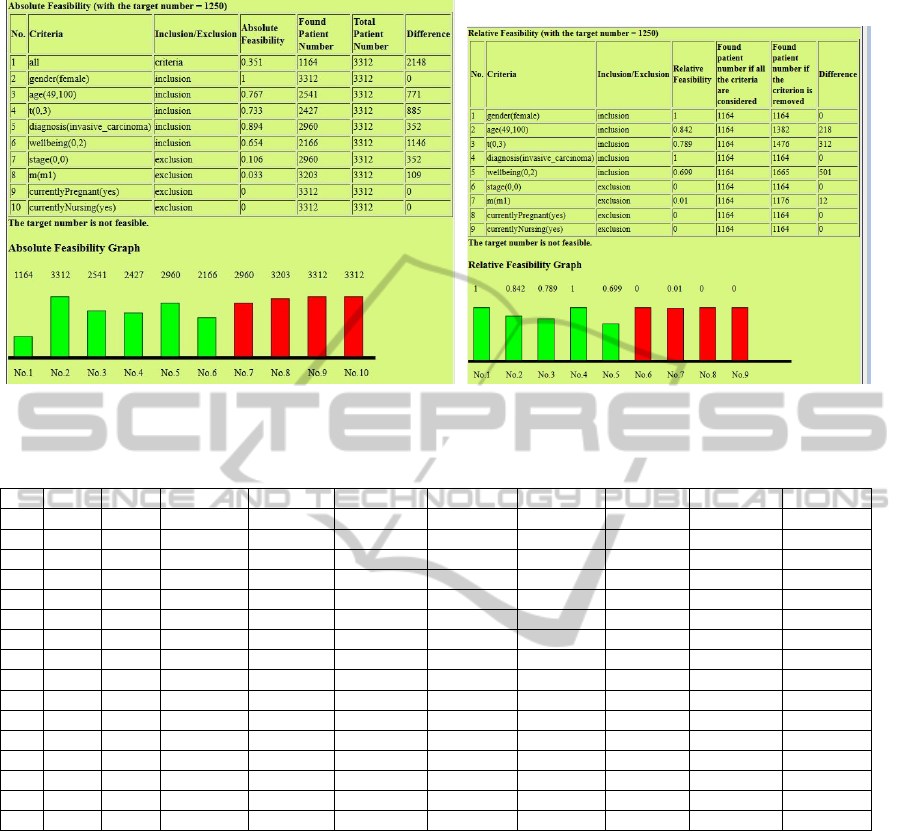
For example, Figure 7(a) and Figure 7(b) show
the absolute and the relative feasibility respectively
for the experiment of trial MST0000IRMA over the
MAASTRO patient data with the target number 1,250
(Experiment No. 11). Figure 7(b) makes it quite clear
that we should modify the criteria about tumor size
(’t(0,3)’) and wellbeing to increase trial feasibility.
Table 2 shows the list of the maximal and mini-
mal values for absolute and relative feasibility in our
16 experiments. In the table, RF=1 (AF=1) denotes
the number of criteria for which the relative feasibil-
ity (absolute feasibility) is 1. In the other columns,
AF and RF stand for absolute and relative feasibil-
ity, while I and E stand for inclusion and exclusion
criteria. Thus, maxAF(I) is the maximal absolute fea-
sibility value for inclusion criteria, and similar for the
other columns.
6 FINDINGS
Our experiments reveal a number of interesting find-
ings.
Redundant Criteria. First, every trial in our test-
set contains inclusion criteria whose relative feasibil-
ity equals 1 (second column of table 2). In fact, all of
the trials we looked at have even multipe of such in-
clusion critera, with the exception of trial no. 9, which
has just one. In other words: when measured over re-
alistic patient data, every one of the realistic trials that
we looked at contains criteria that are strictly speaking
superflous, because when removed from the trial def-
inition, the same set of realistic patients would have
been recruited anyway (see proposition 4). To em-
phasise: all of our trials are real definitions, and this
effect was also observed in our experiments on actual
patient data.
For exclusion criteria, essentially the same was
observed, namely allmost all trials have at least one
exclusion criterion with value 0 (again, see proposi-
tion 4). The exceptions are trials 1, 2 and 3. But more
importantly, all tests on actual patient data reveal ex-
clusion criteria that were redundant for that patient
population.
We can only conclude that there must have been
other reasons for including these logically superflous
criteria in the trial definitions, such as to include a
redundant backup test, or for explanatory purposes,
or to deal with very rare cases that did not happen
to occur in the patient populations on which we
determined the feasibility estimates.
Relative Feasibility is more revealing than Abso-
lute Feasibility. Remember that the presence of such
redundant criteria could be read of in table 2 from
the 2nd column (for inclusion criteria) and from the
last column (for exclusion criteria). However, notice
that the same effect is not revealed by looking at the
absolute feasibility rates: none of the figures in the
columns minAF(I) displays a 1, and none of the fi-
ures in the column maxAF(E) displays a 0. In other
words: even though on the entire population, all cri-
teria have an actually selective effect, this is not the
case when the criteria are considered in the context of
the other criteria.
This makes us speculate that the redundant
criteria were actually included unwittingly, because
their no-filtering effect can only be seen in the context
of the filtering effect of the other criteria, which is a
complex analysis for a human to perform, but which
is exactly what our relative feasibility computes.
Inclusion Criteria more Selective than exclusion
Criteria. Secondly, it turns out that in real trials, the
selective power of inclusion criteria is much greater
than the selective power of exclusion critera. The
change that can be obtained by removing an inclusion
criteria, determined by the minimal value of RF(I), is
often around 0.66 mark, meaning that the old popu-
lation makes up 2/3rd of the new population, in other
words: removing an inclusion criterion may increases
the recruitment rate by as much as a third. For exclu-
sion criteria on the other hand, we should look at the
maximal value of RF(E), which never gets above 0.1,
and is often lower. This means that removing an in-
clusion criteria can only get us a 10% increase in the
recruited population at most (again, using real trial
conditions and realistic patient data).
Thus, removing an inclusion criterion can have a
much larger effect on the recruiting rate than remov-
ing an exclusion criterion. It would be interesting to
FeasibilityEstimationforClinicalTrials
75
(a) Absolute (b) Relative
Figure 7: Absolute and Relative Feasibility in Experiment No. 11.
Table 2: Absolute Feasibility and Relative Feasibility (max and min).
No. RF=1 AF=1 maxAF(I) minAF(I) maxAF(E) minAF(E) maxRF(I) minRF(I) maxRF(E) minRF(E)
1 2 1 1 0.316 0.049 0.005 1 0.525 0.052 0.005
2 2 1 1 0.316 0.049 0.005 1 0.525 0.052 0.005
3 3 1 1 0.598 0.049 0.005 1 1 0.049 0.005
4 4 2 1 0.282 n/a n/a 1 0.474 n/a n/a
5 3 2 1 0.282 n/a n/a 1 0.005 n/a n/a
6 3 2 1 0.495 n/a n/a 1 0.490 n/a n/a
7 3 1 1 0.07 0.049 0.005 1 0.057 0.086 0
8 3 1 1 0.576 0.049 0.005 1 1 0.049 0
9 1 1 1 0.195 0.049 0.005 1 0.187 0.053 0
10 2 1 1 0.654 0.106 0 1 0.699 0.01 0
11 2 1 1 0.654 0.106 0 1 0.699 0.01 0
12 2 1 1 0.668 0.106 0 1 0.71 0.012 0
13 2 1 1 0.668 0.106 0 1 0.611 0.014 0
14 3 1 1 0.598 0.402 0.005 1 0.657 0 0
15 3 1 1 0.598 0.402 0.005 1 0.657 0 0
16 2 1 1 0.598 0.402 0.005 1 0.781 0 0
speculate why this is the case, but it is certainly im-
portant to have this knowledge when designing trials.
7 CONCLUSIONS AND FUTURE
WORK
In this paper, we have developed a lightweight model
of trial feasibility. Our model distinguishes the tra-
ditional notion of absolute feasibility from a new no-
tion of relative feasibility. Absolute feasibility simply
determines the number of eligible patients of a crite-
rion. Relative on the other hand computes how the
removal of a single criterion from a set of criteria af-
fects the recruiting rate of the remaining criteria. In
other words, absolute feasibility measures the selec-
tivity of a single criterion in isolation, while relative
feasibility measures the selectivity of a criterion in the
presence of the other criteria.
We have implemented our lightweight mathemati-
cal model as part of the SemanticCT system, and have
used it to determine the relative feasibility of different
criteria for a number of different real-life trials, on
both actual and synthetic (but realistic) patient data.
Every trial we looked at contains criteria that
could have been safely removed from the trial with-
out loss of specificity, a result that could not have
been found by using only the classical absolute fea-
sibility measure. To us, this is an unexpected result.
Furthermore, it seems that inclusion criteria typically
contibute much more to the specificity of a trial then
exclusion criteria. Although not unexpected, this re-
sult again can only be revealed by using our new rel-
ative feasibility estimator.
HEALTHINF2014-InternationalConferenceonHealthInformatics
76

Future Work. There is a lot of future work to make
our simple mathematical model more useful in actual
practice. Perhaps the most urgent issue is that the pro-
posed model does not consider missing values of pa-
tient data. In the future, both the formal model and the
SemanticCT tool will be adjusted to deal with such
missing values. That can be achieved by two options:
either by introducing credulous and skeptical upper-
and lowerbounds for missing values, or by estimating
likely values from other patient data.
Many more additional functionalities can be en-
visaged, such as: i) the ability to download exist-
ing trials (e.g. those from clinicaltrial.gov and/or
linkedct.org), ii) show more information for each se-
lected criterion (e .g. value distribution in selected co-
hort data), iii) advanced visualization of the selected
cohort data as a colored matrix of criteria x patients,
and as a stem-and-leave diagram integrated with a
query builder from other tools.
ACKNOWLEDGEMENTS
This work is partially supported by the European
Commission under the 7th framework programme
EURECA Project (FP7-ICT-2011-7, Grant 288048),
and by euroCAT (IVA Interreg).
REFERENCES
Anderson, D. (2001). A Guide To Patient Recruitment. Cen-
terWatch/Thomson Healthcare; Boston.
Campbell, M. K., Snowdon, C., Francis, D., Elbourne, D.,
McDonald, A. M., Knight, R., Entwistle, V., Garcia,
J., Roberts, I., Grant, A., Grant, A., and (2007). Re-
cruitment to randomised trials: strategies for trial en-
rollment and participation study. The STEPS study.
Health technology assessment (Winchester, England),
11(48).
Galbreath, A. D., Smith, B., Wood, P., Forkner, E., and Pe-
ters, J. I. (2008). Cumulative recruitment experience
in two large single-center randomized, controlled clin-
ical trials. Contemporary Clinical Trials, 29(3):335–
342.
Gates, S., Brocklehurst, P., Campbell, M., and Elbourne, D.
(2009). Recruitment to multicentre trials. BJOG: An
Int. J of Obstetrics and Gynaecology, 111:3 – 5.
Gennari, J., Sklar, D., and Silva, J. (2001). Cross-tool com-
munication: From protocol authoring to eligibility de-
termination. In Proc. of AMIA Symp., pages 199 –
203.
Haidich, A.-B. and Ioannidis, J. P. (2001). Patterns of pa-
tient enrollment in randomized controlled trials. J. of
Clinical Epidemiology, 54(9):877 – 883.
Huang, Z., den Teije, A., and van Harmelen, F. (2013a).
Rule-based formalization of eligibility criteria for
clinical trials. In 14th Conf. on AI in Medicine.
Huang, Z., ten Teije, A., and van Harmelen, F. (2013b). Se-
manticCT: A semantically enabled clinical trial sys-
tem. In Lenz, R., Mikszh, S., Peleg, M., Reichert,
M., Riano, D., and ten Teije, A., editors, Process Sup-
port and Knowledge Representation in Health Care.
Springer LNAI.
Huang, Z., van Harmelen, F., den Teije, A., and Dentler, K.
(2013c). Knowledge-based patient data generation. In
Lenz, R., Mikszh, S., Peleg, M., Reichert, M., Riano,
D., and ten Teije, A., editors, Process Support and
Knowledge Representation in Health Care. Springer
LNAI.
Ledford, H. (2011). Translational research: 4 ways to fix
the clinical trial. Nature, 477(7366):526–528.
Nammuni, K., Pickering, C., Modgil, S., Montgomery, A.,
Hammond, P., Wyatt, J. C., Altman, D. G., Dunlop,
R., and Potts, H. W. W. (2004). Design-a-trial: a rule-
based decision support system for clinical trial design.
Knowl.-Based Syst., 17(2-4):121–129.
Rajadhyaksha, V. (2010). Conducting feasibilities in clini-
cal trials: an investment to ensure a good study. Per-
spect Clin Res, 1(3):106–109.
Shankar, R. D., Martins, S. B., O’Connor, M. J., Parrish,
D. B., and Das, A. K. (2006). Epoch: an ontologi-
cal framework to support clinical trials management.
In International workshop on Healthcare information
and knowledge management, pages 25–32. ACM.
Thew, S., Leeming, G., Ainsworth, J., Gibson, M., and
Buchan, I. (2011). Farsite: evaluation of an automated
trial feasibility assessment and recruitment tool. Tri-
als, 12(Suppl 1).
Tu, S., Peleg, M., Carini, S., Rubin, D., and Sim, I. (2009).
Ergo: A templatebased expression language for en-
coding eligibility criteria. Technical report.
Wang, D. and Bakhai, A. (2006). Clinical Trials: A Practi-
cal Guide to Design, Analysis, and Reporting. Remed-
ica Medical Education and Publishing.
Weber, G., Murphy, S., McMurry, A., Macfadden, D., Ni-
grin, D., Churchill, S., and Kohane, I. (2009). The
shared health research information network (shrine):
A prototype federated query tool for clinical data
repositories. J Am Med Inform Assoc, 16(5):624 – 30.
Weng, C., Tu, S. W., Sim, I., and Richesson, R. (2010).
Formal representation of eligibility criteria: A litera-
ture review. J. of Biomedical Informatics, 43(3):451 –
467.
Zhang, G.-Q. Q., Siegler, T., Saxman, P., Sandberg, N.,
Mueller, R., Johnson, N., Hunscher, D., and Arabandi,
S. (2010). VISAGE: A query interface for clinical
research. AMIA Summits on Translational Science
proceedings AMIA Summit on Translational Science,
2010:76–80.
FeasibilityEstimationforClinicalTrials
77
