
Automated Analysis of Collagen Histology in Ageing Skin
Osman S. Osman
1,2
, Joanne L. Selway
1
, Parvathy E. Harikumar
1
,
Sabah Jassim
2
and Kenneth Langlands
1
1
The Clore Laboratory, University of Buckingham, Hunter Street, Buckingham U.K.
2
Department of Applied Computing, University of Buckingham, Hunter Street, Buckingham U.K.
Keywords: Skin, Dermis, Collagen, Image Analysis, Histology, Unsupervised, Picrosirius, Herovici, Fast Fourier
Transform, K-Means Clustering, Ageing, Aging.
Abstract: Traditionally, expert analysis is required to evaluate pathological changes manifested in tissue biopsies. This
is a highly-skilled process, notwithstanding issues of limited throughput and inter-operator variability, thus
the application of image analysis algorithms to this domain may drive innovation in disease diagnostics.
There are a number of problems facing the development of objective, unsupervised methods in
morphometry that must be overcome. In the first instance, we decided to focus on one aspect of skin
histopathology, that of collagen structure, as changes in collagen organisation have myriad pathological
sequelae, including delayed wound healing and fibrosis. Methods to quantify incremental loss in structure
are desirable, particularly as subclinical changes may be difficult to assess using existing criteria. For
example, collagen structure is known to change with age, and through the calculation of foci distances in
ellipses derived from the Fourier scatter, we were able to measure a decrease in collagen bundle thickness in
picrosirius stained skin with age. Another key indicator of skin physiology is new collagen synthesis, which
is necessary to maintain a healthy integument. To investigate this phenomenon, we developed a colour-
based image segmentation method to discriminate newly-synthesised from established collagen revealed by
Herovici’s polychrome staining. Our scheme is adaptive to variations in hue and intensity, and our use of
K-means clustering and intensity-based colour filtering informed the segmentation and quantification of red
(indicating old fibres) and blue pixels (indicating new fibres). This allowed the determination of the ratio of
young to mature collagen fibres in the dermis, revealing an age-related reduction in new collagen synthesis.
These automated colour and frequency domain methods are tractable to high-throughput analysis and are
independent of operator variability.
1 INTRODUCTION
Analysis of tissue biopsies by histopathological
methods provides the cornerstone of clinical
diagnosis, although the rigorous assessment of any
pathological features relies upon the experience of at
least one expert pathologist. The automated
classification of histological images would alleviate
the burden on health care services, and provide
unbiased and quantitative measurements to assist in
disease identification and prognostication.
Our group has a particular interest in diseases of
the skin, which are debilitating and their
management has huge financial implications. By
developing methods to allow morphometric analysis
of tissue samples, we hope to shed new light on the
pathophysiological processes underlying a range of
common disorders. In particular, we have chosen to
focus on the dermis and its rich collagen network,
changes in which are associated with effects such as
scarring, delayed wound healing and a loss of skin
integrity. Rather than a simple collagenous pad, the
dermis is composed of a highly-organised
extracellular matrix (ECM) of proteins and other
macromolecules, assembled into a meshwork of
primarily collagen fibres (McGibbon, 2006).
Traditionally, evaluation of this compartment was
made using electron microscopy (EM), which
requires both expensive equipment and extensive
tissue preparation, thus this analysis tends to be
research-focused. Our approach is to exploit
methods available to routine histopathology
laboratories, thereby broadening their utility.
In pathological states, or in ageing, the structure
of collagen in the skin diverges from a regular
‘basket-weave’, in which collagen fibres intersect at
41
Osman O., Selway J., Harikumar P., Jassim S. and Langlands K..
Automated Analysis of Collagen Histology in Ageing Skin.
DOI: 10.5220/0004786600410048
In Proceedings of the International Conference on Bioimaging (BIOIMAGING-2014), pages 41-48
ISBN: 978-989-758-014-7
Copyright
c
2014 SCITEPRESS (Science and Technology Publications, Lda.)

approximately 90° angles (van Zuijlen et al., 2003,
Rawlins et al., 2006), and the production of new
collagen may be perturbed (Varani et al., 2000,
Mays et al., 1991, Varani et al., 2006). The latter
may also be associated with dermal attrition (Al-
Habian, 2011). A range of histological stains are
used to identify collagens in tissue specimens, and
one may make qualitative assessments of ECM
integrity from photomicrographs. We and others
have developed methods to quantify collagen bundle
thickness and orientation, although a degree of user
intervention is required with some methods
(Noorlander et al., 2002), and wholly unsupervised
(thus unbiased) image analysis methods, as we have
previously described, are preferable (Osman et al.,
2013). Moreover, in our experience variation in
staining characteristics across specimens presents
considerable technical difficulties that are
exacerbated if tissues prepared by multiple
laboratories are to be analysed.
Methods that exploit frequency domain
transformations to measure fibre size have been
attempted (Verhaegen et al., 2012), although no
method has been developed to date that can provide
user-independent analysis (Menesatti et al., 2012).
We sought to improve upon existing methods in
several ways: firstly by improving pre-processing to
ensure uniformity between images and reduce
artefacts; secondly, we used cross-polar images of
picrosirius stained sections, rather than simple H&E
images, as these reveal the regular collagen matrix
structure rather than the loops and whirls revealed
with other techniques; and thirdly we used an ellipse
approximation of the fast Fourier transform (FFT)
spectrum scatter rather than gravity centres as used
previously (Verhaegen et al., 2012). This latter stage
allows for the inclusion of more data-points in the
scatter, and this is especially useful when younger
skin is analysed.
In addition to the use of frequency domain
analysis to establish collagen fibre size, we also
wanted to adapt colour segmentation methods to
allow the assessment of collagen dynamics.
Herovici’s polychrome is a particularly effective
connective tissue stain in that it discriminates young
from old collagen fibres. While this is, in principle, a
simple image analysis problem based around the
separation of two distinct hues, we found that
variation between images made it impossible to
achieve accurate quantification of red (mature
collagen) and blue (young collagen) staining areas
consistently. To resolve this, we implemented a
dynamic approach to improve colour segmentation
by exploiting K-means clustering.
Herein, we describe the development of
automated methods that utilise either the frequency
domain or colour space in order to assess collagen
bundle thickness and collagen dynamics
respectively, from images of skin sections stained
with histological dyes. These tools enabled us to
investigate the effects of chronological ageing on
collagen structure and synthesis in an animal model
of skin ageing.
2 BIOLOGICAL METHODS
2.1 Animal Models
All procedures were conducted in accordance with
the UK Government Animals (Scientific Procedures)
Act 1986, and approved by the University of
Buckingham Ethical Review Board. C57Bl6 mice
were maintained on chow diets fed ad libitum under
standard conditions (BeeKay Number 1, B&K
Universal Ltd, Leeds, UK). Mice were obtained
from Charles River (Manston, UK) aged 5-6wk.
Wild-type C57 mice were killed at 3mth, 8mth,
12mth and 20mth of age. Freely-fed males were
used for all studies, and tissues from at least 3
animals per group were studied.
2.2 Tissue
Once animals were euthanized, dorsal skin biopsies
were taken immediately and snap frozen in liquid
nitrogen prior to storage at -80°C until all samples
were ready for simultaneous processing to minimise
artefacts. Samples were transferred to cold (4°C)
10% neutral buffered formalin then fixed for 7-8h at
room temperature. This was followed by
dehydration, clearing and wax immersion in an
automated tissue processor as standard. Rectangular
pieces of skin were placed on their sides in moulds
such that sections were cut orthogonal to the
epidermal surface, before embedding in paraffin
wax. 4µm thick sections were cut using a rotary
microtome with a knife angle of 35° and a clearance
angle between 1° and 5°, before transfer to
positively-charged glass slides. Haematoxylin and
Eosin (H&E) staining was carried out as standard to
confirm tissue integrity and orientation in all
samples.
2.3 Histological Staining
Standard morphology was assessed with H&E
stained images captured in bright-field with an
BIOIMAGING2014-InternationalConferenceonBioimaging
42

Aperio whole-slide scanner (Aperio, Vista, CA,
USA). The depth of the dermis was measured in
Aperio ImageScope software (version 11.1.2.760)
using the ruler function. Dermal depth was measured
from the basement membrane (epidermal-dermal
junction) to the adipocyte-dermis junction. The
orientation of the measurement was dictated by the
basement membrane, and this followed the contour
of the epidermis. At least 3 animals per group were
studied, and from each animal least 3 images were
captured. A minimum of 5 depth measurements
were taken for each image.
Collagen organisation was studied by picrosirius
staining, performed as previously described
(Junqueira et al., 1979, Osman et al., 2013). Images
were captured at 90x magnification from at least 3
discrete locations per slide with a Nikon TEi
inverted microscope equipped with cross-polar
optics and a QImaging CCD camera (all supplied by
Nikon, Kingston, UK) coupled to Nikon NIS
Elements software (version 4.10.01). Collagen
dynamics were evaluated from whole-slide bright-
field captures of Herovici’s polychrome staining
(Friend, 1963, Cook, 1974). Standardised regions of
interest (ROIs) showing papillary dermis (inclusive
of the basement membrane, but excluding non-
dermal tissues such as hair follicles) where captured
using a 40x objective lens.
2.4 Statistical Analysis
Data analysis was performed using GraphPad Prism
5.0. One-way ANOVAs compared collagen patterns
in 3mth controls (by which age rates of collagen
synthesis are stable) (Taher et al., 2011, Yano et al.,
2001, Muller-Rover et al., 2001) to test groups.
Dunnett’s post-hoc analysis was performed where
the ANOVA demonstrated significance. Where
appropriate, Pearson’s correlation analysis was
performed (p<0.05). For all tests: * p<0.05; **
p<0.01; *** p<0.001; **** p<0.0001.
3 COMPUTATIONAL METHODS
3.1 Measurement of Collagen Bundle
Thickness and Spacing
All image processing and analysis was performed in
MATLAB (R2011b, MathWorks, Cambridge, UK)
equipped with the Image Processing Toolbox.
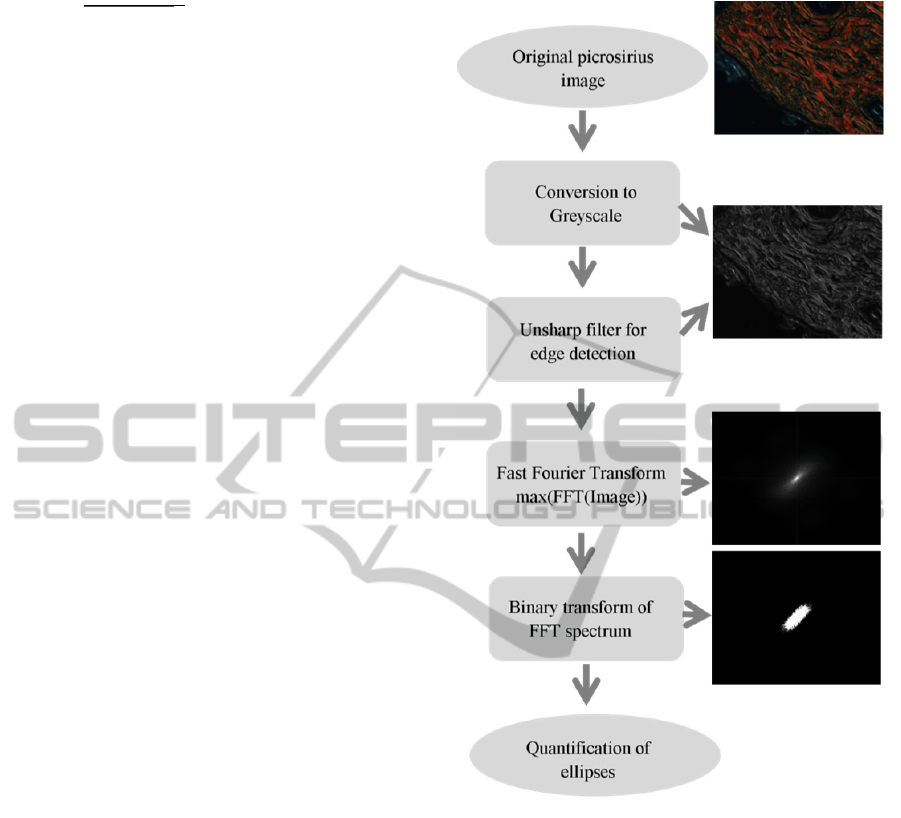
Images were pre-processed with an unsharp filter to
enhance edges (in various orientations) and other
high-frequency components (Humaimi et al., 2001,
Cheikh and Gabbouj, 1998). Specifically, the
unsharp filter was applied the the greyscale
conversion of the original picrosirius stained image
to create a mask. This mask was then subtracted
from the original greyscale image to produce a
sharper image with clear collagen edges. An usharp
mask filter was applied according to the formula (1):
,
,
,
(1)
where fsmooth(x,y) is the smooth version of original
image f(x,y).
The resulting sharpened image was produced by
formula (2):
,
,
⋅
,
(2)
where k is a scaling constant between 0.2 and 0.7
Each image was then converted to greyscale and
the discrete Fourier transform (DFT) was computed
with the Fast Fourier Transformation (FFT) function
in MATLAB. The FFT is an efficient algorithm that
returns the strength of the different frequency
waveforms contributing to the pixel values of the
entire image (Blanchet and Charbit, 2010).
The texture of the Fourier spectrum was used to
determine the relative organisation or directionality
of the original image texture. Power spectral
analysis of an image can be interpreted as an
averaging of the FFT spectrum at different
frequency sub-bands.
The highest frequency range sub-band of the
FFT was exploited to generate a power plot of the
FFT spectrum (Figure 1 and 3), this computed by
calculating the higher frequencies using the
MATLAB code in formula (3):
2
(3)
The resulting spectra were transformed into binary
through Otsu thresholding (Figure 1 and 3), and
elliptical measurements of the scatter pattern for
each spectrum were made. Briefly, the ellipse with
the same normalized second central moment as the
segmented binarised scatter was generated. The
variance in the region was calculated using a
MATLAB function (regionprops) to find the major
and minor axes of the fitted ellipse.
From the elliptical scatter, measurements of
average collagen bundle thickness were extracted
using the location of the foci of ellipses, and the
distances between the foci and the verteces of the
ellipses (Figure 1 and 3). Measurements of the axes
of the ellipses were not defined by spatial position,
but defined by the variance of the region. Formulas
(4) and (5) define this process:
AutomatedAnalysisofCollagenHistologyinAgeingSkin
43
(4)
(5)
where T is the distance between foci and the verteces of
any ellipse (representing bundle thickness), F is the
distance in µm from each focus to the centre and A and B
are the major and minor radii of the ellipse in µm. This
process is summarised in Figure 1. Typical FFT scatter
patterns and ellipses derived from an ageing mouse skin
model are shown in Figure 3.
3.2 Measurement of Collagen
Dynamics
Image segmentation based on red, green and blue
(RGB) pixel colour values informs the separation of
objects within a given colour space (Menesatti et al.,
2012, Hosea et al., 2011), allowing areas with
similar values to be quantified as one entity.
Although not universally exploited in biomedical
imaging, RGB-based segmentation is commonly
used in morphometry and we used this approach
herein. Specfically, we sought to develop colour
filter-based segmentation of Herovici stained skin
images towards the quantification of both newly-
synthesised and mature collagen.
Our approach involved the determination of pixel
intensity values for each of the red, green and blue
channels in the Herovici RGB image. This was
followed by segmentation of red and blue pixels
using two steps: reducing the multiplicity of colours
in the image and selecting all red (and “reddish”)
pixels, as well as all blue (and “bluish”) pixels,
followed by colour segmentation using discrete
criteria to segment all the pixels accurately.
Using this thresholding technique, we initially
applied a simple segmentation algorithm to a region
of interest (ROI) within the upper (papillary) dermis
to quantify red and blue fibres according to the
following formulae (6), (7) and (8).
Red if:
Value of R> (G+B)
⋅
C1; (6)
Blue if:
Value of B>(G+R)
⋅
C2; (7)
Pixel = 255 if not blue or red (8)
where R, G, and B are Red, Green and Blue
respectively, C1=0.75 and C2=0.9 (determined
empirically for each image set).
Due to the inherent variability in staining
properties between histological samples, our initial
attempts to simply segment the red and blue pixels
Figure 1: Flow chart for the measurement of collagen
bundle thickness in picrosirius images.
using standard thresholds according equations 5 and
6 were unsatisfactory (Figure 4C and 4D). In order
to improve this, we employed an iterative K-means
clustering method to refine pixel intensity values
derived from a range of images to allow more
accurate segmentation (Yerpude and Dubey, 2012,
Farivar et al., 2008).
This method is described in the flow chart in
Figure 2. Briefly, for each image a median 3x3 filter
was applied to the image to remove noise, then
contrast stretching was performed using the
MATLAB function “imadjust” (this acts to increase
the dynamic range of an image such that 1% of all
pixel values are saturated at low and high intensities
of the image). Subsequently, RGB images were
BIOIMAGING2014-InternationalConferenceonBioimaging
44
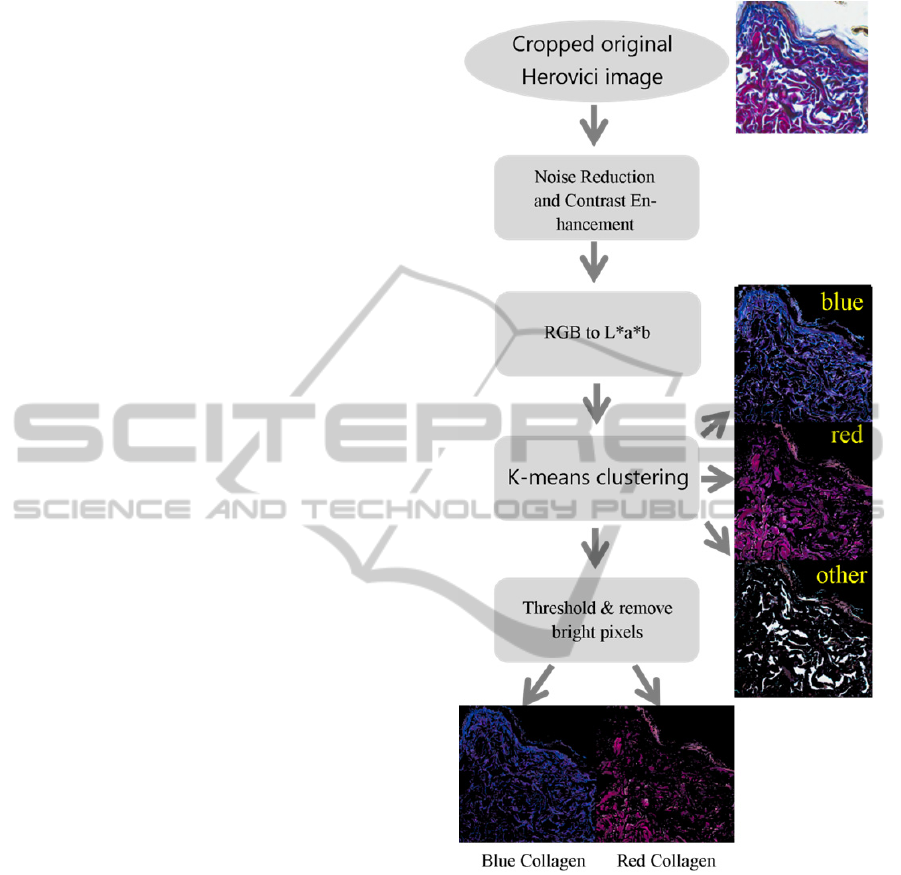
converted into CIE L*a*b* colour space, and K-
means clustering was performed to partition the data
points into three clusters. The centroids of the
clusters were computed and their associated Voroni
diagram was constructed. The data points were then
assigned to the cluster with the closest centroid
measured by Euclidian Distance. Once allocated,
centroids were recalculated, and the clustering
process was repeated until the groups stabilised
(Yerpude and Dubey, 2012, Farivar et al., 2008).
This process was followed by segmentation and
image histogram-based thresholding to remove
bright pixels from segmented images.
4 APPLICATION OF METHODS
4.1 Quantification of Collagen Changes
in Chronologically-aged Skin
We subjected replicate images derived from a model
of skin ageing to quantitative analysis. We and
others previously showed that both collagen
organisation and dynamics are compromised with
increasing age (Varani et al., 2006, Osman et al.,
2013). We initially attempted to use existing
methods to measure collagen bundle thickness using
gravity centres isolated from the FFT scatter created
from images of H&E stained skin (Verhaegen et al.,
2012). However, we found that we could not
replicate this analysis without significant user
interaction, for example in mapping gravity centres.
Moreover, as picrosirius images more effectively
reveal collagen structure, we wished to investigate
the possibility that the analysis of these images
would overcome problems associated with the
analysis of H&E images. Our approach is
summarised in Figure 2 and Figure 4.
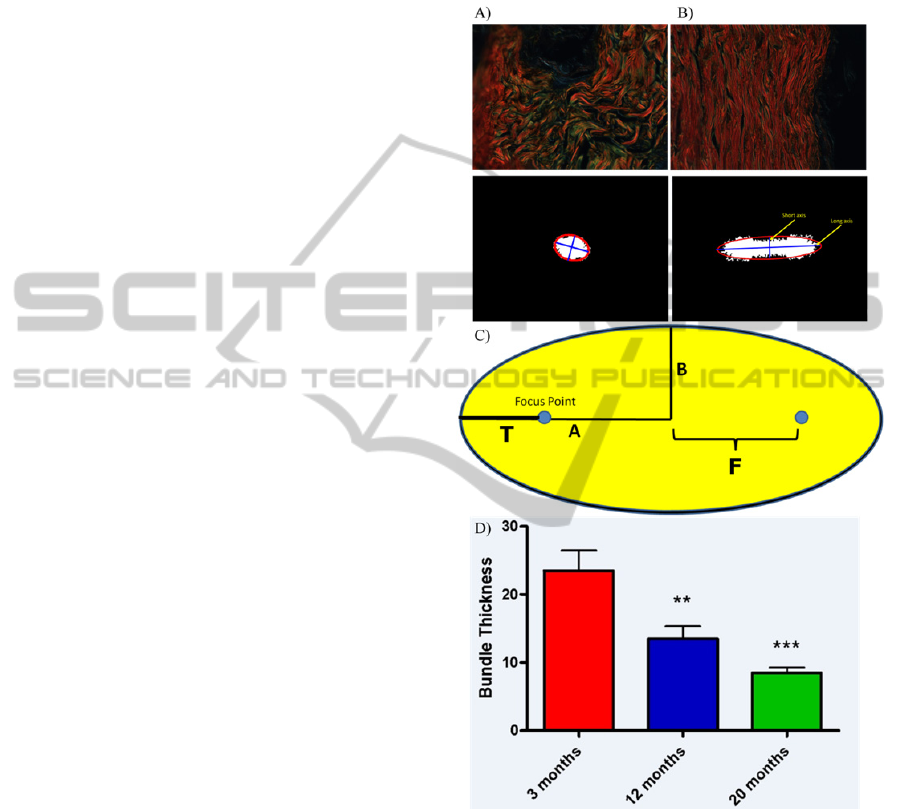
Our measurements revealed a correlation with
chronological ageing and reduction in fibre
thickness (Figure 4D). Not only were we able to
quantify gross changes associated with extremes of
age (i.e. between 3mth [the equivalent of young
adulthood] and 20mth [equivalent to extreme old age
in humans]), we were also able to resolve
incremental reductions in collagen bundle thickness
over shorter time-spans, with a significant negative
correlation observed between chronological age and
bundle size (r
2
=0.8268, p<0.05).
Rodent hair follicle cycling is synchronous in the
first few weeks post-partum, which is important as
collagen synthesis is coordinated with the growth,
resting and regenerative stages of the hair
follicle cycle (Taher et al., 2011, Yano et al., 2001,
Figure 2: Flow diagram of our K-means clustering based
method for the quantification of young (blue) and mature
(red) pixels in images of Herovici stained skin.
Rodent hair follicle cycling is synchronous in the
first few weeks post-partum, which is important as
collagen synthesis is coordinated with the growth,
resting and regenerative stages of the hair follicle
cycle (Taher et al., 2011, Yano et al., 2001, Muller-
Rover et al., 2001). For this reason, we analysed an
expanded panel of skin samples by Herovici’s
polychrome stain to investigate collagen dynamics
(Figure 4). If simple segmentation methods were
used (i.e. without a clustering step to optimise colour
values used to inform segmentation), then no
correlation could be established between collagen
AutomatedAnalysisofCollagenHistologyinAgeingSkin
45
synthesis and age (3 to 20mth inclusive; r
2
=0.8723,
p>0.05) due to the influence of inter-image variation
(Figure 4C and 4D). Conversely, the use of K-means
clustering to inform our quantification method did
reveal a correlation between a decrease in newly-
synthesised collagen relative to mature collagen and
time (between 3 and 20mth inclusive, r
2
=0.9438,
p<0.05; Figure 4E and 4F). The relative reduction in
new collagen synthesis observed in skin taken from
7 week old mice is most likely as a consequence of
the establishment of the adult dermis at this phase of
the mouse life cycle. After this time hair follicle
cycling becomes asynchronous, and collagen
synthesis stabilises.
5 CONCLUSIONS
Murine models of human disease are widely used by
the biomedical science community, and these
include studies of the skin. A loss of skin structure is
associated with a loss of function, and damage to the
dermal layers is seen in chronological ageing, in
response to environmental challenges such as sun
exposure, or in diseases such as diabetes. Objective
measurements of dermal structure following
therapeutic intervention (made by assessing collagen
integrity) would facilitate the evaluation of agents
effective in treating, for example, impaired wound
healing. Ideally, such analysis be completely
unsupervised and tractable to high-throughput
studies. However, one of the major obstacles to the
effective automation of morphometry is in handling
the variation in colour intensity and hue displayed
between images, even when every effort is made to
reduce such technical variation. In order to address
this, we have developed robust techniques to
determine collagen structure and dynamics in
histological preparations of mammalian skin. By
exploiting information in the frequency domain, and
by using a K-means clustering algorithm to stabilise
inter-image variation, we were able to quantify
subtle changes in structure in a model of ageing.
Further investigation of a wider range of biological
samples is required to ensure that these algorithms
are truely data-set independent, and we are in the
process of applying our methods to the annotation of
skin images generated by a high-throughput
phenotyping study. Such an undertaking would not
be possible if each image had to be assessed
independently and subjected to manual semi-
quantitative analysis.
We are confident that our methods are adaptable
to the quantification of pathological features in
human skin biopsies, and may eventually lead to the
creation of quantitative tools for pathologists and
basic researchers.
Figure 3: Measurement of collagen bundle thickness.
Representative cross-polar images of picrosirius stained
mouse skin A) 3mth and B) 20mth and corresponding
binarised FFT scatter with fitted ellipses and axes
superimposed. Images were captured at 90x original
magnification. C) Diagram explaining the generation of
ellipse parameters. D) Decrease in collagen bundle
thickness in an ageing skin series.
BIOIMAGING2014-InternationalConferenceonBioimaging
46
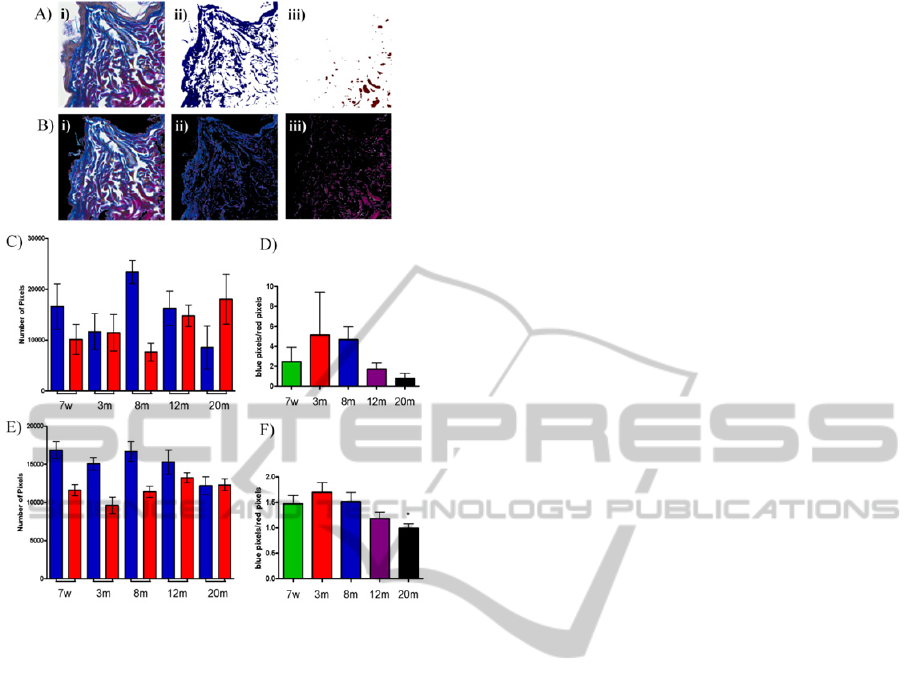
Figure 4: Quantification of collagen dynamics. Ai) Typical
original ROI from Herovici stained mouse skin (3mth; 90x
original magnification), ii) segmentation using blue
criteria, iii) segmentation using red criteria. Bi) Image
ready for K-means-informed segmentation (after removal
of background and epidermis by thresholding the
saturation channel of HSV colour space), ii) blue cluster
pixel segmentation, iii) red cluster pixel segmentation. C)
Pixel values obtained by simple blue and red segmentation
or by the K-means clustering method (E) in the ageing
series. D) and F) The ratio of blue to red pixels in images
achieved by either simple segmentation D) or K-means
clustering (F).
ACKNOWLEDGEMENTS
We are indebted to members of the Clore
Laboratory, in particular Mike Cawthorne, Claire
Stocker and Ed Wargent for continued support and
helpful advice.
REFERENCES
Al-Habian, A. Z., M. S.; Stocker, C. J.; Kepczynska, M.
A.; Wargent, E. T.; Cawthorne, M. A.; Langlands, K
2011. Abstract: Increasing insulin resistance correlates
with progressive skin damage in murine models of
obesity and diabetes. Journal of Investigative
Dermatology, 131, S34.
Blanchet, G. & Charbit, M. 2010. Digital Signal and
Image Processing Using MATLAB, Wiley.
Cheikh, F. & Gabbouj, M. 1998. Directional Unsharp
Masking-Based Approach for Color Image
Enhancement. In: Marshall, S., Harvey, N. & Shah, D.
(eds.) Noblesse Workshop on Non-Linear Model
Based Image Analysis. Springer London.
Cook, H. C. 1974. Manual of histological demonstration
techniques, Boston, Butterworths.
Farivar, R., Rebolledo, D., Chan, E. & Campbell, R. Year.
A parallel implementation of k-means clustering on
GPUs. In: Proceedings of International Conference on
Parallel and Distributed Processing Techniques and
Applications (PDPTA), 2008. 340-345.
Friend, W. G. 1963. A polychrome stain for differentiating
precollagen from collagen. Stain Technology, 38, 204-206.
Hosea, S. P., Ranichandra, S. & Rajagopal, T. 2011. Color
Image Segmentation–An Approach. Color Image
Segmentation–An Approach, 2.
Humaimi, M. N., Razif, M. R. M. & Nagoor, M. T. A.
2001. Comparison between Median, Unsharp and
Wiener filter and its effect on ultrasound stomach
tissue image segmentation for Pyloric Stenosis.
International Journal of Applied Science and
Technology, 1, 218-226.
Junqueira, L. C., Bignolas, G. & Brentani, R. R. 1979.
Picrosirius staining plus polarization microscopy, a
specific method for collagen detection in tissue
sections. Histochem J, 11, 447-455.
Mays, P. K., Mcanulty, R. J., Campa, J. S. & LAURENT,
G. J. 1991. Age-related changes in collagen synthesis
and degradation in rat tissues. Importance of
degradation of newly synthesized collagen in
regulating collagen production. Biochem J, 276 ( Pt 2),
307-313.
Mcgibbon, D. 2006. Rook's Textbook of Dermatology, 7th
edition. Clinical and Experimental Dermatology, 31,
178-179.
Menesatti, P., Angelini, C., Pallottino, F., Antonucci, F.,
Aguzzi, J. & Costa, C. 2012. RGB color calibration
for quantitative image analysis: the "3D thin-plate
spline" warping approach. Sensors (Basel), 12, 7063-
7079.
Muller-Rover, S., Handjiski, B., Van Der Veen, C.,
Eichmuller, S., Foitzik, K., Mckay, I. A., Stenn, K. S.
& Paus, R. 2001. A comprehensive guide for the
accurate classification of murine hair follicles in
distinct hair cycle stages. J Invest Dermatol, 117, 3-15.
Noorlander, M. L., Melis, P., Jonker, A. & Van Noorden,
C. J. 2002. A quantitative method to determine the
orientation of collagen fibers in the dermis. J
Histochem Cytochem, 50, 1469-1474.
Osman, O. S., Selway, J. L., Harikumar, P. E., Stocker, C.
J., Wargent, E. T., Cawthorne, M. A., Jassim, S. &
Langlands, K. 2013. A novel method to assess
collagen architecture in skin. BMC Bioinformatics, 14,
260.
AutomatedAnalysisofCollagenHistologyinAgeingSkin
47

Rawlins, J. M., Lam, W. L., Karoo, R. O., Naylor, I. L. &
Sharpe, D. T. 2006. Quantifying collagen type in
mature burn scars: a novel approach using histology
and digital image analysis. J Burn Care Res, 27, 60-
65.
Taher, L., Collette, N. M., Murugesh, D., Maxwell, E.,
Ovcharenko, I. & LOOTS, G. G. 2011. Global gene
expression analysis of murine limb development.
PLoS One, 6, e28358.
Van Zuijlen, P. P., Ruurda, J. J., Van Veen, H. A., Van
Marle, J., Van Trier, A. J., Groenevelt, F., KREIS, R.
W. & Middelkoop, E. 2003. Collagen morphology in
human skin and scar tissue: no adaptations in response
to mechanical loading at joints. Burns, 29, 423-31.
Varani, J., Dame, M. K., Rittie, L., Fligiel, S. E., Kang, S.,
Fisher, G. J. & Voorhees, J. J. 2006. Decreased
collagen production in chronologically aged skin: roles
of age-dependent alteration in fibroblast function and
defective mechanical stimulation. Am J Pathol, 168,
1861-1868.
Varani, J., Warner, R. L., Gharaee-Kermani, M., Phan, S.
H., Kang, S., Chung, J. H., Wang, Z. Q., Datta, S. C.,
Fisher, G. J. & Voorhees, J. J. 2000. Vitamin A
antagonizes decreased cell growth and elevated
collagen-degrading matrix metalloproteinases and
stimulates collagen accumulation in naturally aged
human skin. J Invest Dermatol, 114, 480-486.
Verhaegen, P. D., Marle, J. V., Kuehne, A., Schouten, H.
J., Gaffney, E. A., Maini, P. K., Middelkoop, E. &
Zuijlen, P. P. 2012. Collagen bundle morphometry in
skin and scar tissue: a novel distance mapping method
provides superior measurements compared to Fourier
analysis. J Microsc, 245, 82-89.
Yano, K., Brown, L. F. & Detmar, M. 2001. Control of
hair growth and follicle size by VEGF-mediated
angiogenesis. J Clin Invest, 107, 409-17.
Yerpude, A. & Dubey, S. 2012. Colour image
segmentation using K–Medoids Clustering. Int. J.
Computer Techology & Applications, 152-154.
BIOIMAGING2014-InternationalConferenceonBioimaging
48
