
Local Texton Dissimilarity with Applications on Biomass Classification
Radu Tudor Ionescu
1
, Andreea-Lavinia Popescu
2
, Dan Popescu
2
and Marius Popescu
1
1
Faculty of Mathematics and Computer Science, University of Bucharest,
14 Academiei Street, Bucharest, Romania
2
Faculty of Automatic Control and Computer Science, Politehnica University of Bucharest,
313 Splaiul Independentei Street, Bucharest, Romania
Keywords:
Texture Dissimilarity, Texture Classification, Biomass Classification, Biomass Type Identification, Textons,
Texton-based Technique.
Abstract:
Texture classification, texture synthesis, or similar tasks are an active topic in computer vision and pattern
recognition. This paper aims to present a novel texture dissimilarity measure based on textons, namely the
Local Texton Dissimilarity (LTD), inspired from (Dinu et al., 2012). Textons are represented as a set of fea-
tures extracted from image patches. The proposed dissimilarity measure shows its application on biomass
type identification. A new data set of biomass texture images is provided by this work, which is available
at http://biomass.herokuapp.com. Images are separated into three classes, each one representing a type of
biomass. The biomass type identification and quality assessment is of great importance when one in the
biomass industry needs to produce another energy product, such as biofuel, for example. Two more experi-
ments are conducted on popular texture classification data sets, namely Brodatz and UIUCTex. The proposed
method benefits from a faster computational time compared to (Dinu et al., 2012) and a better accuracy when
used for texture classification. The performance level of the machine learning methods based on LTD is
comparable to the state of the art methods.
1 INTRODUCTION
Computer vision researchers have developed sophis-
ticated methods for image related tasks, such as im-
age retrieval, image categorization, image segmenta-
tion or image synthesis. Indeed, many of the most
powerful of these methods are patch-based (Barnes
et al., 2011). Such methods divide the image into
many small patches and then manipulate or analyze
the image based on its patches. Some of these meth-
ods have been designed or adapted to work on tex-
tures, where vector quantized image patches are also
referred to as textons (Leung and Malik, 2001), (Xie
et al., 2010).
Texture classification, texture synthesis, or similar
tasks are an active topic in computer vision and pat-
tern recognition, having many practical applications.
This paper aims to present a novel texture dissimilar-
ity measure based on textons, namely the Local Tex-
ton Dissimilarity (LTD), inspired from (Dinu et al.,
2012). Textons are represented as a set of features ex-
tracted from image patches. Similar textons will be
represented through similar features. Thus, images
patches are implicitly quantized into textons. Textons
provide a lighter representation of patches, allowing
for a faster computational time and broader applica-
tion to practical problems. LTD sums the spatial off-
sets of similar textons to measure the similarity be-
tween two texture images.
Several experiments are conducted on three tex-
ture data sets. LTD shows its first application on
biomass type identification, a direct application of
texture classification. A new data set of biomass tex-
ture images is provided by this work. Images are sep-
arated into three classes, each one representing a type
biomass. A method to determine the biomass type
has practical motivations for the biomass industry.
Such methods are of great importance when one in
the biomass industry needs to produce another energy
product, such as biofuel or bioenergy, for example. Is
the type of biomass appropriate to efficiently obtain
the bioproduct? Is the biomass conversion method
the right one for this type of biomass? Answering
such questions can help reduce the operating costs of
biomass power plants. But, such questions can be an-
swered with the help of a simple biomass type iden-
tification method, such as the one presented in this
work. The other experiments are conducted on two
593
Ionescu R., Popescu A., Popescu D. and Popescu M..
Local Texton Dissimilarity with Applications on Biomass Classification.
DOI: 10.5220/0004740105930600
In Proceedings of the 9th International Conference on Computer Vision Theory and Applications (VISAPP-2014), pages 593-600
ISBN: 978-989-758-003-1
Copyright
c
2014 SCITEPRESS (Science and Technology Publications, Lda.)

popular texture classification data sets, namely Bro-
datz and UIUCTex. The proposed method benefits
from a faster computational time compared to (Dinu
et al., 2012) and a better accuracy when used for tex-
ture classification. The performance level of the ma-
chine learning methods based on LTD is comparable
to the state of the art methods.
The paper is organized as follows. Related work
about texton-based and patch-based techniques, and
biomass classification is discussed in Section 2. LTD
is described in Section 3. Experiments with machine
learning methods based on LTD are presented in Sec-
tion 4. Finally, the conclusions are drawn in Section 5.
2 RELATED WORK
2.1 Patches and Textons
For numerous computer vision applications, the im-
age can be analyzed at the patch (or texton) level
rather than at the individual pixel level or global level.
Patches and textons contain contextual information
and have advantages in terms of computation and gen-
eralization. For example, patch-based methods pro-
duce better results and are much faster than pixel-
based methods for texture synthesis (Efros and Free-
man, 2001). However, patch-based techniques are
still heavy to compute with current machines (Barnes
et al., 2011).
The authors of (Lazebnik et al., 2005b) develop
a texture representation that is invariant to geomet-
ric transformations based on descriptors defined on
affine invariant regions. A probabilistic part-based ap-
proach for texture and object recognition is presented
in (Lazebnik et al., 2005a). Textures are represented
using a part dictionary obtained by quantizing the ap-
pearance of salient image regions.
In (Leung and Malik, 2001) texture images are
classified by using 3D textons, which are cluster cen-
ters of filter response vectors corresponding to differ-
ent lighting and viewing directions of images. The au-
thors of (Varma and Zisserman, 2005) model textures
by the joint distribution of filter responses. This dis-
tribution is represented by the frequency histogram of
textons. For most texton based techniques, the textons
are usually learned by k-means clustering. In (Xie
et al., 2010) the authors propose a novel texture clas-
sification method via patch-based sparse texton learn-
ing. The dictionary of textons is learned by applying
sparse representation to image patches in the training
data set. In (Barnes et al., 2011) the authors present
a new randomized algorithm for quickly finding ap-
proximate nearest neighbor matches between image
patches.
2.2 Biomass Classification
In a general sense, biomass refers to the biological
material from living, or recently living organisms. In
this work, the term biomass refers to a renewable en-
ergy source, that can be directly converted into an-
other type of energy product. The Biomass Tex-
ture data set provided by this work is a collection of
close-up photos of different samples of three types of
biomass: municipal solid waste, corn, and wheat. The
goal is to build a classifier that is able to distinguish
between these three types of biomass. This is a totally
different approach and understanding of the biomass
classification problem, compared to other researches.
Usually, biomass classification refers to land cover
type or forest biomass classification. Land cover clas-
sification (Dash et al., 2007) and forest biomass esti-
mation (Wulder et al., 2008) are active research topics
in the area of remote sensing. The authors of (Hoek-
man and Quinnones, 2000) show that remotely sensed
image classification systems may be designed to ac-
curately monitor processes of deforestation, land and
forest degradation and secondary forest regrowth.
3 LOCAL TEXTON
DISSIMILARITY
To compute LTD between two gray-scale texture im-
ages, the idea is to sum up all the offsets of similar
textons between the two images. The LTD algorithm
is briefly described next. For every texton in one im-
age, the algorithm searches for a similar texton in the
other image. First, it looks for similar textons in the
same position in both textures. If those textons are
similar, it sums up 0 since there is no spatial offset
between textons. If the textons are not similar, the
algorithm starts exploring the vicinity of the initial
texton position in the second image to find a texton
similar to the one in the first image. If a similar tex-
ton is found during this process, it sums up the off-
set between the two textons. The spatial search goes
on until a similar texton is found or until a maximum
offset is reached. The maximum texton offset must be
set a priori. The computation of LTD is similar the al-
gorithm presented in (Dinu et al., 2012). In practice,
this computation is too heavy for a large set of im-
ages. To speed up the algorithm, textons are extracted
and compared using a dense grid over the image.
Notice that the algorithm proposed in (Dinu et al.,
2012) compares image patches by using the mean eu-
clidean distance. LTD differs in the way it compares
VISAPP2014-InternationalConferenceonComputerVisionTheoryandApplications
594

these patches. First, texture specific features are ex-
tracted from each patch. A patch can then be repre-
sented by a feature vector. Similar patches will be
represented through similar features. Thus, images
patches are implicitly quantized into textons. Textons
are compared using the Bhattacharyya coefficient be-
tween their feature vectors. Section 3.1 describes the
features extracted from image patches. The algorithm
is presented in Section 3.2.
3.1 Texture Features
Before computing LTD between texture images, a set
of several image features is extracted from each patch
to obtain the texton representation. There are 9 fea-
tures extracted from patches, that are described next.
An interesting remark is that the more features are
added to the texton representation, the better the ac-
curacy of the LTD method gets. However, a lighter
representation, such as the one based on 9 features,
results in a faster and more efficient algorithm. One
may choose to add or remove features in order to ob-
tain the desired trade-off between accuracy and speed.
The texton representation based on the 9 features that
are about to be presented next gives state of the art ac-
curacy levels in several experiments presented in Sec-
tion 4.
The first two statistical features extracted are the
mean and the standard deviation. These two basic
features can be computed indirectly, in terms of the
image histogram. The shape of an image histogram
provides many clues to characterize the image, but the
features obtained from an image histogram are not al-
ways adequate to discriminate textures, since they are
unable to indicate local intensity differences.
One of the most powerful statistical methods for
textured image analysis is based on features extracted
from the Gray-Level Co-Occurrence Matrix (GLCM),
proposed in (Haralick et al., 1973). The GLCM is
a second order statistical measure of image variation
and it gives the joint probability of occurrence of gray
levels of two pixels, separated spatially by a fixed vec-
tor distance. Smooth texture gives co-occurrence ma-
trix with high values along diagonals for small dis-
tances. The range of gray level values within a given
image determines the dimensions of a co-occurrence
matrix. Thus, 4 bits gray level images give 16 × 16
co-occurrence matrices. Relevant statistical features
for texture classification can be computed from a
GLCM. The features proposed by (Haralick et al.,
1973), which show a good discriminatory power, are
the contrast, the energy, the entropy, the homogene-
ity, the variance and the correlation. Among these
features that show a good discriminatory power, LTD
uses only four of them, namely the contrast, the en-
ergy, the homogeneity, and the correlation.
Another feature that is relevant for texture analysis
is the fractal dimension. It provides a statistical index
of complexity comparing how detail in a fractal pat-
tern changes with the scale at which it is measured.
The fractal dimension is usually approximated. The
most popular method of approximation is box count-
ing (Falconer, 2003). The idea behind the box count-
ing dimension is to consider grids at different scale
factors over the fractal image, and count how many
boxes are filled over each grid. The box counting
dimension is computed by estimating how this num-
ber changes as the grid gets finer by applying a box
counting algorithm. An efficient box counting algo-
rithm for estimating the fractal dimension was pro-
posed in (Popescu et al., 2013). The idea of the algo-
rithm is to skip the computation for coarse grids, and
count how many boxes are filled only for finer grids.
LTD includes this efficient variant of box counting in
the texton representation.
The work of (Daugman, 1985) found that cells in
the visual cortex of mammalian brains can be mod-
eled by Gabor functions. Thus, image analysis by
the Gabor functions is similar to perception in the hu-
man visual system. A set of Gabor filters with differ-
ent frequencies and orientations may be helpful for
extracting useful features from an image. The lo-
cal isotropic phase symmetry measure (LIPSyM) pre-
sented in (Kuse et al., 2011) takes the discrete time
Fourier transform of the input image, and filters this
frequency information through a bank of Gabor fil-
ters. The work of (Kuse et al., 2011) also notes that lo-
cal responses of each Gabor filter can be represented
in terms of energy and amplitude. Thus, Gabor fea-
tures, such as the mean-squared energy and the mean
amplitude, can be computed through the phase sym-
metry measure for a bank of Gabor filters with various
scales and rotations. These features are relevant be-
cause Gabor filters have been found to be particularly
appropriate for texture representation and discrimina-
tion.
Finally, textons are represented by the mean and
the standard deviation of the patch, the contrast, the
energy, the homogeneity, and the correlation extracted
from the GLCM, the (efficient) box counting dimen-
sion, and the mean-squared energy and the mean am-
plitude extracted by using Gabor filters. These texton
features can be extracted from all images before com-
paring them with LTD. Thus, the LTD computation
can be divided in two main steps, one for texton fea-
ture extraction, and one for dissimilarity computation.
After the feature extraction step, features should be
normalized. In practice, the described features work
LocalTextonDissimilaritywithApplicationsonBiomassClassification
595

best on squared image patches of a power of two size.
3.2 Local Texton Dissimilarity
Algorithm
Algorithm 1 computes the LTD between gray-scale
texture images img
1
and img
2
, using the underlying
Bhattacharyya coefficient to compute the similarity
between texton feature vectors.
Algorithm 1. Local Texton Dissimilarity
Input:
img
1
– a gray-scale texture image of h
1
× w
1
pixels;
img
2
– another gray-scale texture image of h
2
× w
2
pixels;
n – the number of features that represent a texton;
gridStep – the skip step that generates a dense grid
over the image;
offsetStep – the skip step used for comparing patches
at different offsets;
w – a vector of feature weights (some features can be
more important than others);
th – the texton similarity threshold.
Initialization:
dist = 0
h = min{h
1
,h
2
} − p + 1
w = min{w
1
,w
2
} − p + 1
Computation:
for x = 1:gridStep:h
for y = 1:gridStep:w
get texton
l
at position (x,y) in img
1
d = 0
while NO texton at offset d similar to texton
l
get texton
r
at offset d from (x, y) in img
2
s
1
=
1
n
n
∑
i=1
w
i
·
q
texton
l
i
− w
i
·
p
texton
r
i
2
if s
1
< th
dist = dist + d
break
endif
if all textons at offset d were tested
d = d+ offsetStep
endif
endwhile
get texton
r
at position (x,y) in img
2
d = 0
while NO texton at offset d similar to texton
r
get texton
l
at offset d from (x, y) in img
1
s
2
=
1
n
n
∑
i=1
w
i
·
p
texton
r
i
− w
i
·
q
texton
l
i
2
if s
2
< th
dist = dist + d
break
endif
if all textons at offset d were tested
d = d+ offsetStep
endif
endwhile
endfor
endfor
Output: dist – the dissimilarity between textures
img
1
and img
2
.
Algorithm 1 needs a few input parameters besides
the two images. The number of features gives the size
of the feature vector. In this work, the 9 features de-
scribed in Section 3.1 were used. In the algorithm,
texton
i
represents the i-th feature of the texton repre-
sentation, and w
i
represents the weight associated to
the i-th feature.
The results of the LTD algorithm can further be
improved by adding more features or probably by us-
ing completely different features. The parameter that
generates a dense grid over the image, and the skip
step used for comparing patches at different offsets
are used to speed up the LTD algorithm without loos-
ing too much accuracy. These parameters induce a
sparse representation of the images. Using a sparse
representation is indeed necessary, since patch-based
algorithms are heavy to compute with current com-
puters because they usually manipulate millions of
patches (Barnes et al., 2011). The texton similarity
threshold is a value in the [0, 1] interval, that deter-
mines when two textons are considered to be similar.
All these parameters need to be adjusted with regard
to the data set size and to the image dimensions, in or-
der to obtain a good trade-off between accuracy and
speed.
4 EXPERIMENTS
In the experiments, LTD is evaluated with different
kernel methods to show that good performance levels
are due to the use of LTD. Two data sets of texture im-
ages are used to assess the performance of several ker-
nel methods based on LTD, namely the Brodatz data
set and the UIUCTex data set. Another experiment is
performed to show the application of LTD on biomass
type identification. All the experiments presented in
this work aim at showing that LTD has general ap-
plications for texture classification, and that LTD is
indeed a robust dissimilarity measure.
4.1 Data Sets
The first data set used for testing the dissimilarity
presented in this paper is the Brodatz data set (Bro-
VISAPP2014-InternationalConferenceonComputerVisionTheoryandApplications
596
datz, 1966). This data set is probably the best known
benchmark used for texture classification, but also one
of the most difficult, since it contains 111 classes with
only 9 samples per class. Samples of 213 × 213 pix-
els are cut using a 3 by 3 grid from larger images of
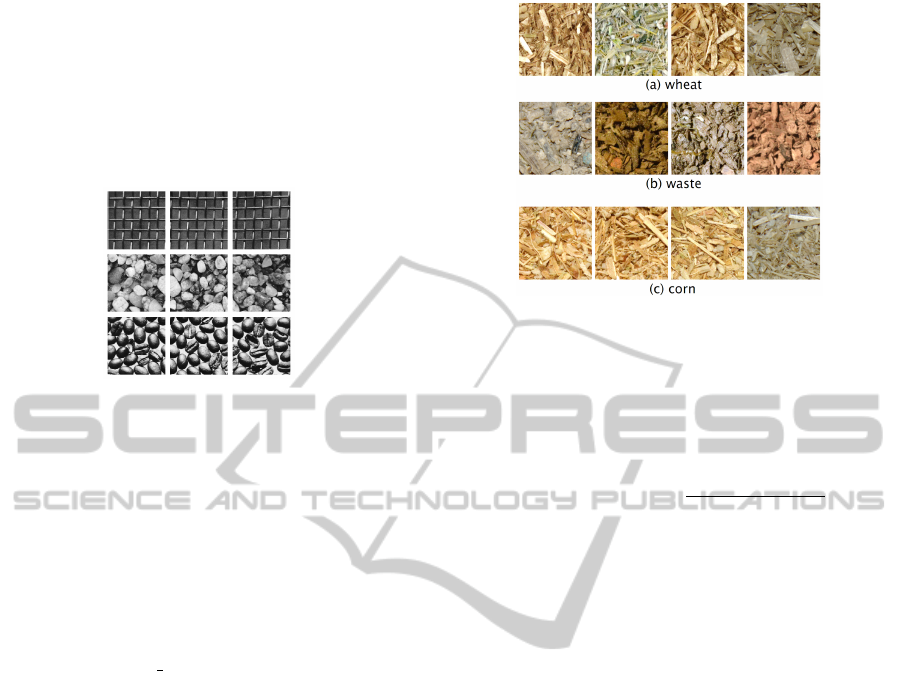
640 × 640 pixels. Figure 1 presents three sample im-
ages per class of three classes randomly selected from
the Brodatz data set.
Figure 1: Sample images from three classes of the Brodatz
data set.
The second experiment is conducted on the
UIUCTex data set of (Lazebnik et al., 2005b). It con-
tains 1000 texture images of 640 × 480 pixels rep-
resenting different types of textures such as bark,
wood, floor, water, and more. There are 25 classes
of 40 texture images per class. Textures are viewed
under significant scale, viewpoint and illumination
changes. Images also include non-rigid deformations.
This data set is available for download at http://www-
cvr.ai.uiuc.edu/ponce grp.
The third experiment is conducted on a new data
set of biomass texture images provided by this work.
It contains 270 images of 512 × 512 pixels represent-
ing close up photos of three types of biomass resulted
after the processing of wheat, municipal waste and
corn, respectively. Photos where taken at different
zoom levels under various lighting conditions. Fig-
ure 2 show a few random samples of biomass im-
ages. There are 90 images per class. The goal is
to build a classifier that is able to identify the three
types of biomass: wheat, waste, and corn, respec-
tively. The Biomass Texture data set is available for
use at http://biomass.herokuapp.com.
4.2 Learning Methods
To use LTD for texture classification, it should be
plugged into a similarity-based learning method. Sev-
eral similarity-based classifiers are proposed. The
first one is the Nearest Neighbors model (k-NN). It
was chosen because it directly reflects the discrimina-
tory power of the dissimilarity measure. Several state
of the art kernel methods are also used, namely the
Kernel Ridge Regression (KRR), the Support Vector
Machines (SVM), the Kernel Discriminant Analysis
Figure 2: Sample images from the Biomass Texture data
set.
(KDA), and the Kernel Partial Least Squares (KPLS).
Kernel methods are based on similarity. LTD can be
transformed into a similarity measure by using the
Gaussian-like kernel (also known as the RBF kernel):
k(img
1
,img
2
) = exp
−
LTD(img
1
,img
2
)
2σ
,
where img
1
and img
2
are two gray-scale texture im-
ages. The parameter σ is usually chosen to match the
number of features so that values of k(img
1
,img
2
) are
well scaled.
For a particular classification problem, some ker-
nel methods may be more suitable than others. The
accuracy level depends on many aspects such as class
distribution, the number of classes, data noise, size
of the training data, and so on. For example, the
KRR classifier can be used with success for problems
with well-balanced classes. But, in some particular
cases, when the number of classes is greater than 2,
there is a serious problem with the regression meth-
ods. More precisely, some classes can be masked by
others. The KDA classifier is able to improve accu-
racy by avoiding the masking problem (Hastie and
Tibshirani, 2003).
4.3 Brodatz Experiment
The baseline method proposed for this experiment is
a 1-NN model that is based on the Bhattacharyya co-
efficient computed on the 9 texture features described
in Section 3.1. The features are extracted from entire
images. The second proposed model is a 1-NN clas-
sifier based on LTD. The baseline is useful to assess
the performance gained by the use of LTD. The other
proposed classifiers are the KRR, the KPLS, the SVM
and the KDA, all based on LTD. The KDA method is
particularly suitable for problems with many classes,
such as Brodatz.
LocalTextonDissimilaritywithApplicationsonBiomassClassification
597

In (Lazebnik et al., 2005b), the accuracy rate re-
ported on the Brodatz data set using 3 training sam-
ples per class is 88.15%. Table 1 compares accuracy
rates of the proposed classifiers with the accuracy rate
of the state of the art method described in (Lazebnik
et al., 2005b), using the same setup with 3 random
samples per class for training. The accuracy rates pre-
sented in Table 1 are actually averages of accuracy
rates obtained over 20 runs for each method. The 1-
NN based on LTD model has a far better accuracy
than the baseline, proving that LTD helps the learning
method to achieve better results. All the kernel meth-
ods based on LTD are above the state of the art clas-
sifier. The best classifier among them is KDA, which
has an accuracy of 90.87%. It is 5.46% better than the
1-NN based on LTD, and 2.72% better that the state of
the art method. It seems that LTD is a good dissimilar-
ity measure for texture classification. Combined with
suitable learning methods, LTD gives results compa-
rable to state of the art method. Despite better tex-
ture classification methods exist (Zhang et al., 2007),
the classifiers based on LTD can also be improved by
adding more features to the texton representation.
Table 1: Accuracy rates on the entire Brodatz data set using
3 random samples per class for training. Learning methods
based on LTD are compared with the state of the art method.
Method Accuracy
baseline 1-NN 77.68%
Best of (Lazebnik et al., 2005b) 88.15%
1-NN + LTD 85.41%
KRR + LTD 89.43%
SVM + LTD 89.48%
KPLS + LTD 89.57%
KDA + LTD 90.87%
In this experiment, LTD was computed on patches
of 32 × 32 pixels, using a similarity threshold of 0.02
and a maximum offset of 80 pixels. Patches were ex-
tracted on a dense grid with a gap of 32 pixels. Fea-
ture weighting can improve accuracy by almost 1%.
Thus, adjusting feature weights is not very impor-
tant, but it helps the classifier. However, the feature
weights were manually adjusted to increase the im-
portance of Gabor features and fractal dimension by
a factor of two, and to decrease the importance of the
mean and the standard deviation by a factor of two.
The weights were tuned on the baseline 1-NN model,
which also uses feature weighting in the reported re-
sults. The parameter σ of the LTD kernel was cho-
sen to be 10
−3
. All the parameters were chosen by
cross validation on a subset of the Brodatz data set.
An interesting remark is that these parameters do not
change by too much on the other data sets.
Using these parameters, it takes less than 1 second
to compute LTD between two images on a computer
with Intel Core Duo 2.26 GHz processor and 4 GB
of RAM memory using a single Core. Reported ac-
curacy rates can be improved by a few percents using
a more dense grid and a greater maximum offset, but
the LTD computation will also take more time. How-
ever, with the current parameters, LTD is much faster
than Local Patch Dissimilarity, which takes about 5
minutes to compare two images from the Brodatz data
set with similar parameters, without skipping overlap-
ping patches.
4.4 UIUCTex Experiment
In this experiment, the same classifiers evaluated on
the Brodatz data set are also evaluated on the UIUC-
Tex data set. More precisely, the evaluated classi-
fiers are the baseline 1-NN model based on the Bhat-
tacharyya coefficient, the 1-NN classifier based on
LTD, and the kernel classifiers based on LTD, namely
the KRR, the KPLS, the SVM, and the KDA. These
classifiers are compared with the state of the art clas-
sifier of (Lazebnik et al., 2005b). The best accuracy
level of the state of the art classifier on the UIUCTex
data set, reported in (Lazebnik et al., 2005b) using 20
training samples per class, is 97.41%.
Table 2 compares accuracy rates of the classifiers
based on LTD with the accuracy rate of the state of
the art classifier of (Lazebnik et al., 2005b), using
the same setup with 20 random samples per class for
training. The accuracy rates are averaged over 20
runs for each method. The accuracy of the 1-NN
model based on LTD is 9.32% better than accuracy of
the baseline 1-NN, proving again that LTD is able to
achieve much better results. However, the accuracy of
the 1-NN based on LTD is far behind the state of the
art classifier. Even the kernel methods have accuracy
rates that are roughly 4% lower than the state of the
art classifier. The best classifier based on LTD is the
KPLS, with an accuracy of 93.79%, which is 3.62%
lower than the state of the art method. The accuracy
of these kernel methods depend on LTD, which de-
pends in turn on the features extracted from images to
obtain textons. Better features will result in a dissim-
ilarity measure capable of making finer distinctions,
and, consequently, in a better kernel classifier. But
even with the 9 features proposed in Section 3.1, LTD
seems to give results that are comparable to the state
of the art method.
In this experiment, LTD was computed on patches
of 64 × 64 pixels, using a similarity threshold of 0.02
and a maximum offset of 240 pixels. Patches were
extracted on a dense grid with a gap of 64 pixels. The
same feature weights as in the Brodatz experiment
VISAPP2014-InternationalConferenceonComputerVisionTheoryandApplications
598
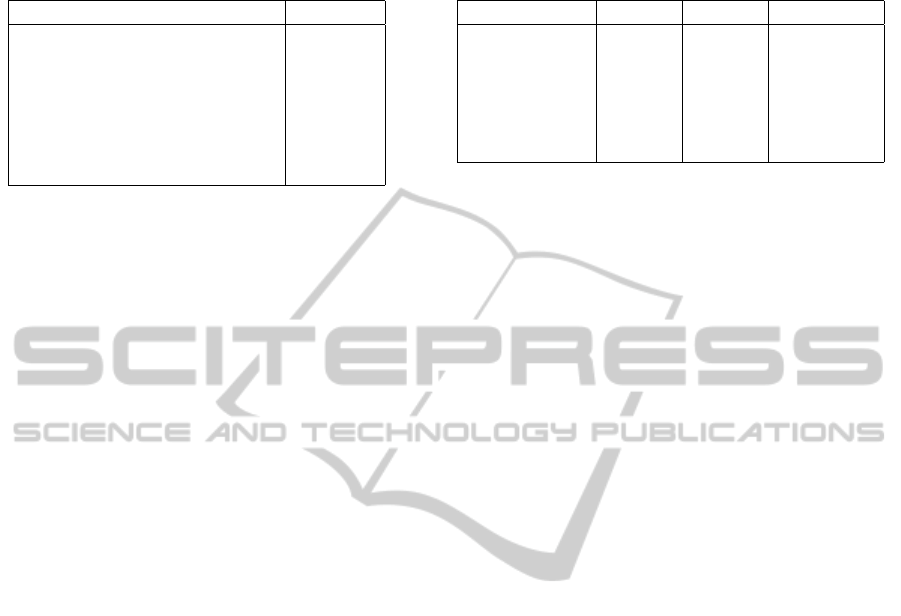
Table 2: Accuracy rates on the UIUCTex data set using 20
random samples per class for training. Learning methods
based on LTD are compared with state of the art method.
Method Accuracy
baseline 1-NN 79.34%
Best of (Lazebnik et al., 2005b) 97.41%
1-NN + LTD 88.66%
KRR + LTD 93.51%
SVM + LTD 93.62%
KPLS + LTD 93.79%
KDA + LTD 93.38%
were used. The parameter σ of the LTD kernel was
chosen to be 10
−3
. All the parameters were chosen
by cross validation on a subset of the UIUCTex data
set.
4.5 Biomass Experiment
The classifiers evaluated in this experiment are the
baseline 1-NN model based on the Bhattacharyya co-
efficient, the 1-NN classifier based on LTD, and the
kernel classifiers based on LTD, namely the KRR,
the KPLS, the SVM, and the KDA. These classifiers
must identify the three classes of biomass from the
Biomass Texture data set.
Table 3 presents accuracy rates of the proposed
classifiers using three different setup procedures. The
first setup is to use 20 random samples per class for
training and the rest of 70 samples for testing. The
second setup is to use 30 random samples per class
for training and 60 samples for testing. The last setup
is to use 40 random samples per class for training and
50 samples for testing. The accuracy rates are aver-
aged over 50 runs for each method. As expected, the
accuracy of each method improves when more train-
ing samples are used. For example, the accuracy of
the baseline method grows by 6.83% from 20 training
samples to 40 training samples. However, the classi-
fiers based on LTD are more stable, since the accu-
racy of each classifier grows only by roughly 3 − 4%
from 20 training samples to 40 samples. The learning
methods based on LTD show a significant improve-
ment in accuracy over the baseline. The best classi-
fier based on LTD is KPLS. In all the test cases, the
KPLS based on LTD has an accuracy of at least 10%
better than the accuracy of the baseline 1-NN. Over-
all, the kernel classifiers achieve roughly similar ac-
curacy levels. The empirical results show again that
LTD is a powerful dissimilarity measure for texture
classification.
In this experiment, LTD was computed on patches
of 64 × 64 pixels, using a similarity threshold of 0.02
and a maximum offset of 256 pixels. Patches were ex-
tracted on a dense grid with a gap of 64 pixels. Again,
Table 3: Accuracy rates on Biomass Texture data set using
20, 30 and 40 random samples per class for training and 70,
60 and 50 for testing, respectively.
Method 20/70 30/60 40/50 Acc.
baseline 1-NN 80.35% 84.72% 87.18%
1-NN + LTD 88.09% 90.20% 91.28%
KRR + LTD 93.72% 96.40% 97.64%
SVM + LTD 93.98% 96.58% 97.72%
KPLS + LTD 94.48% 96.90% 97.97%
KDA + LTD 94.08% 96.40% 97.67%
feature weights were adjusted to increase the impor-
tance of Gabor features and fractal dimension by a
factor of two, and to decrease the importance of the
mean and the standard deviation by a factor of two.
The parameter σ of the LTD kernel was chosen to be
10
−3
. All the parameters were chosen by cross vali-
dation on a subset of the Biomass Texture data set.
5 CONCLUSIONS AND FURTHER
WORK
This work presented a texture dissimilarity measure
based on textons, called Local Texton Dissimilarity.
It is based on the idea of comparing textons that are
represented as a set of features extracted from image
patches. Experiments showed that LTD can be used
to obtain accuracy levels comparable to state of the art
methods. The proposed dissimilarity measure showed
its application on biomass type identification. To as-
sess the performance level of LTD on biomass clas-
sification, a new data set of biomass texture images
was provided by this work. On this data set, the accu-
racy level of a classifier based on LTD can be as high
as 97.97%, which is more than enough for a practical
application.
In future work, LTD can be improved by adding
more features to the texton feature set, or by chang-
ing the features completely. For example, textons can
be obtained by vector quantizing local image descrip-
tors, such as the SIFT descriptor (Lowe, 1999). Fi-
nally, a system for biomass type identification will be
designed to analyze photos taken on mobile devices.
A classifier based on LTD will be integrated in this
system.
ACKNOWLEDGEMENTS
The contribution of the authors to this paper is equal.
LocalTextonDissimilaritywithApplicationsonBiomassClassification
599

REFERENCES
Barnes, C., Goldman, D. B., Shechtman, E., and Finkel-
stein, A. (2011). The PatchMatch Randomized Match-
ing Algorithm for Image Manipulation. Communica-
tions of the ACM, 54(11):103–110.
Brodatz, P. (1966). Textures: a photographic album for
artists and designers. Dover pictorial archives. Dover
Publications, New York, USA.
Dash, J., Mathur, A., Foody, G. M., Curran, P. J., Chip-
man, J. W., and Lillesand, T. M. (2007). Land cover
classification using multi-temporal MERIS vegetation
indices. IJRS, 28(6):1137–1159.
Daugman, J. G. (1985). Uncertainty relation for resolution
in space, spatial frequency, and orientation optimized
by two-dimensional visual cortical filters. Journal of
the Optical Society of America A, 2(7):1160–1169.
Dinu, L. P., Ionescu, R., and Popescu, M. (2012). Lo-
cal Patch Dissimilarity for Images. Proceedings of
ICONIP, 7663:117–126.
Efros, A. A. and Freeman, W. T. (2001). Image quilting for
texture synthesis and transfer. Proceedings of SIG-
GRAPH ’01, pages 341–346.
Falconer, K. (2003). Fractal Geometry: Mathematical
Foundations and Applications. Wiley, 2 edition.
Haralick, R. M., Shanmugam, K., and Dinstein, I. (1973).
Textural Features for Image Classification. IEEE
Transactions on Systems, Man and Cybernetics,
3(6):610–621.
Hastie, T. and Tibshirani, R. (2003). The Elements of Sta-
tistical Learning. Springer, corrected edition.
Hoekman, D. H. and Quinnones, M. J. (2000). Land cover
type and biomass classification using AirSAR data fro
evaluation of monitoring scenarios in the Colombian
Amazon. IEEE Transactions on Geoscience and Re-
mote Sensing, 38:685–696.
Kuse, M., Wang, Y.-F., Kalasannavar, V., Khan, M., and
Rajpoot, N. (2011). Local isotropic phase symmetry
measure for detection of beta cells and lymphocytes.
Journal of Pathology Informatics, 2(2):2.
Lazebnik, S., Schmid, C., and Ponce, J. (2005a). A Maxi-
mum Entropy Framework for Part-Based Texture and
Object Recognition. Proceedings of ICCV, 1:832–
838.
Lazebnik, S., Schmid, C., and Ponce, J. (2005b). A Sparse
Texture Representation Using Local Affine Regions.
PAMI, 27(8):1265–1278.
Leung, T. and Malik, J. (2001). Representing and Recogniz-
ing the Visual Appearance of Materials using Three-
dimensional Textons. IJCV, 43(1):29–44.
Lowe, D. G. (1999). Object Recognition from Local Scale-
Invariant Features. Proceedings of ICCV, 2:1150–
1157.
Popescu, A. L., Popescu, D., Ionescu, R. T., Angelescu, N.,
and Cojocaru, R. (2013). Efficient Fractal Method for
Texture Classification. Proceedings of ICSCS, (Ac-
cepted).
Varma, M. and Zisserman, A. (2005). A Statistical Ap-
proach to Texture Classification from Single Images.
IJCV, 62(1-2):61–81.
Wulder, M. A., White, J. C., Fournier, R. A., Luther, J. E.,
and Magnussen, S. (2008). Spatially Explicit Large
Area Biomass Estimation: Three Approaches Using
Forest Inventory and Remotely Sensed Imagery in a
GIS. Sensors, 8(1):529–560.
Xie, J., Zhang, L., You, J., and Zhang, D. (2010). Texture
classification via patch-based sparse texton learning.
Proceedings of ICIP, pages 2737–2740.
Zhang, J., Marszalek, M., Lazebnik, S., and Schmid, C.
(2007). Local Features and Kernels for Classification
of Texture and Object Categories: A Comprehensive
Study. IJCV, 73(2):213–238.
VISAPP2014-InternationalConferenceonComputerVisionTheoryandApplications
600
