
Transformer Working Condition Assessment using Laser Raman
Spectroscopy
Toshihiro Somekawa
1
, Makoto Kasaoka
2
, Fumio Kawachi
2
,
Yoshitomo Nagano
2
, Masayuki Fujita
1,3
and Yasukazu Izawa
1,3
1
Institute for Laser Technology, 2-6 Yamadaoka, Suita, Osaka 565-0871, Japan
2
Kanden Engineering Corporation, 3-1-176 Fukuzaki, Minato-ku, Osaka 552-0013, Japan
3
Institute of Laser Engineering, Osaka University, 2-6 Yamadaoka, Suita, Osaka 565-0871, Japan
Keywords: Raman Spectroscopy, Transformer, C
2
H
2
, Furfural.
Abstract: Analyses of dissolved gas and furfural in the insulating oil are a very efficient tool for assessing the working
conditions of transformer. We propose the in-situ transformer health diagnosis without the need for oil
sampling by measuring the Raman signals from C
2
H
2
and furfural concentrations present in transformer oils.
Raman signals in oil at ~1972 cm
-1
and ~1705 cm
-1
originating from C
2
H
2
and furfural, respectively, were
detected. The results show that laser Raman spectroscopy is a useful alternative method to diagnose the
transformer faults.
1 INTRODUCTION
Transformers are important components in any
power system and their condition monitoring is
essential for ensuring reliable operation of the
system. In general, power transformer coils are
insulated with a cellulose paper and immersed in
mineral oil. Under the normal operating conditions,
insulating mineral oils in the transformers include
small amounts of gases, but failure of the
transformer is known to be preceded by significant
evolution of hydrogen(H
2
), carbon monoxide(CO),
carbon dioxide(CO
2
), methane(CH
4
), ethane(C
2
H
6
),
ethylene(C
2
H
4
), and acetylene(C
2
H
2
) gases caused
by corona discharges, overheating, and arcing.
Therefore, a dissolved gas analysis (DGA) of the
insulating oils has become the most widely used
method for investigating incipient faults in
transformers (Duval, 1989). Dissolved gases
extracted from oil aliquots due to pressure reduction
or substitution by inert gases are measured by gas
chromatography. In addition, it is known that
furfural in oil comes only from the decomposition of
insulation paper. So the furfural content in insulation
oil is an important indicator for assessing the
degradation of insulating paper in transformer
(Morais et al., 1999). Furfural concentration in oil
was generally extracted by methanol and measured
by high performance liquid chromatograpy. These
methods usually offer sensitive detection limits at
ppm levels that are suitable for monitoring the
transformer conditions, but require time consuming
preprocessing steps and include risks of sample
contamination during sampling.
We recently reported detections of C
2
H
2
dissolved in the insulation oil using laser Raman
spectroscopy technique (Somekawa et al., 2013).
C
2
H
2
is mainly produced at very high temperatures
that occur in presence of arcing. C
2
H
2
is not detected
in transformers during normal operation, but
concentrations as high as 1% are detected in
presence of huge arcing (Duval and dePablo, 2001).
Therefore, C
2
H
2
is introduced as an effective
indicator. Our approach does not require gas
separation in oils and the gas content in the
insulating oil is directly measured by irradiating
laser. Based on this technique, on-line and in-situ
detection of dissolved gases and byproduct materials
can be adapted for diagnosis of transformer faults.
In this paper, we demonstrate that C
2
H
2
and
furfural in insulating oils can be directly detected by
Raman spectroscopy. We found that Raman signals
of C
2
H
2
(~1972 cm
-1
) and furfural (~1705 cm
-1
) can
be used for monitoring the transformer condition
with no interfering peaks overlapping from the
insulating oil. Hence, Raman spectroscopy could be
a useful technique for in-situ transformer health
diagnosis without the need for oil sampling.
21
Somekawa T., Kasaoka M., Kawachi F., Nagano Y., Fujita M. and Izawa Y..
Transformer Working Condition Assessment using Laser Raman Spectroscopy.
DOI: 10.5220/0004710800210025
In Proceedings of 2nd International Conference on Photonics, Optics and Laser Technology (PHOTOPTICS-2014), pages 21-25
ISBN: 978-989-758-008-6
Copyright
c
2014 SCITEPRESS (Science and Technology Publications, Lda.)

2 EXPERIMENTAL
2.1 Raman Spectroscopy
Figure 1 shows the schematic diagram of Raman
spectroscopy. The laser was a standard Q-switched
Nd:YAG laser (Continuum, Surelite: 10 ns pulse-
width with 100 mJ pulse energy at 10 Hz repetition
rate) operating at its second harmonic wavelength of
532 nm. A non-focused laser beam having about 8
mm diameter was used to avoid laser induced
damage of oil sample. The Raman signals from
samples are collected using an achromatic lens at an
angle of 25° from the forward direction of the laser
beam. This design provides a longer optical path
length than a conventional detection geometry at
90°, offering an order of magnitude increase in
Raman scattering intensity. After passing through
the edge and notch filters at 532 nm, the Raman
signal is coupled into an optical fiber bundle by
using an achromatic lens. The collected Raman
signal is dispersed by a spectrometer (Acton,
SpectraPro-2300i) with an entrance slit width set to
15 μm and detected with a liquid nitrogen-cooled
charge-coupled device (CCD) camera (Princeton
Instruments, SPEC-10). The exposure time was 90
ms. Accumulation numbers of C
2
H
2
and furfural
measurements were 3000 and 500, respectively.
Higher accumulation number in the C
2
H
2
detection
was required to reduce the random noise in Raman
spectra and improve the S/N ratio. The spectral
resolution of this system was estimated to be about 5
cm
-1
.
2.2 Sample Preparation
The insulating oil used in this work was a mixture of
naphthenic(41.6%), paraffinic(50.0%), and
aromatic(8.4%) oils. The used insulating oil
samples were optically clear in visible region. The
insulating oils were stored in glass bottles with
diameters of 3 cm. We confirmed that the glass
bottles had no effect on Raman spectra. After
complete degassing in vacuum for 4 hours, high-
purity C
2
H
2
gas (more than 99%) was introduced via
a gastight syringe. The C
2
H
2
concentrations of the
samples under the investigation were measured by
the gas chromatography and had 1.9%, 5.7%, and
10% concentrations, respectively.
Furfural is only slightly soluble in this oil.
Therefore, toluene solvent is added to oil. The
concentration of toluene in oil was constant at
approximately 9% for quantitative analysis. Furfural
used in this experiment becomes yellow on exposure
to air and light, but the spectrum obtained using 532
nm excitation is not dominated by fluorescence.
Edge+notchfilters
Surelite
(532nm,1W,10Hz)
Spectrometer+CCD
Oil,Furfural,To luene
25°
Polarizer
Half‐waveplate
M
M
M
M
Figure 1: Schematic diagram of the experimental setup.
3 RESULTS AND DISCUSSION
3.1 Raman Spectrum of Oil
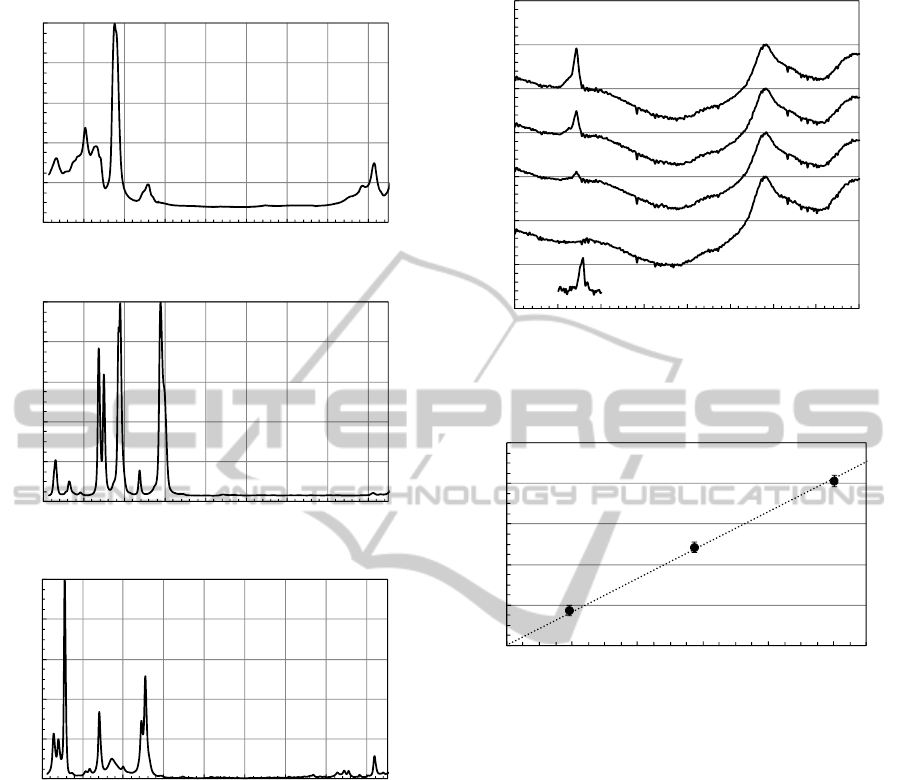
Figure 2(a) shows the Raman spectra of oil. In short
and long edges of the spectrum, it exhibits numerous
features that are specific to complex oil structures
(Somekawa et al., 2013), however, it has no large
Raman spectral features and relatively low
background baseline between 1700 to 2500 cm
-1
range. The large peak centered at 1450 cm
-1
corresponds to CH
3
-CH
2
bending mode, and the set
of peaks at 1302 and 1350 cm
-1
corresponds to
paraffin C-H twisting modes. The peak at 1610 cm
-1
is due to an aromatic C=C stretching mode. The
band at 2725 cm
-1
can be assigned to the C-H
stretching mode. In higher wavenumber side not
shown here, the Raman spectrum of oil shows only
C-H stretching mode around 3000 cm
-1
, but no
signals in the region between 3100 and 4200 cm
-1
.
Figures 2(b) and 2(c) show the Raman spectra of
furfural and toluene, respectively, as discussed
below.
3.2 Raman Spectrum of C
2
H
2
Dissolved
in Oil
Figure 3 shows the spectra of C
2
H
2
gas at different
concentrations dissolved in the insulation oil. These
Raman spectra were normalized at ~2191 cm
-1
Raman signal intensity peaks. Weak Raman signals
were detected at 2191 cm
-1
, which were assigned to
the oil-derived Raman signal since its Raman peak
intensity remained almost unchanged as the C
2
H
2
concentration increased in the oil. On the other hand,
Raman peak intensity of relatively sharp line at
~1972 cm
-1
increased linearly versus increasing
C
2
H
2
concentration. We assign the peak around 1972
PHOTOPTICS2014-InternationalConferenceonPhotonics,OpticsandLaserTechnology
22
(a)Oil
0
0.2
0.4
0.6
0.8
1
1100 1300 1500 1700 1900 2100 2300 2500 2700
Intensity(count arb.unit)
Wavelength(nm)
(b)Furfural
0
0.2
0.4
0.6
0.8
1
1100 1300 1500 1700 1900 2100 2300 2500 2700
Intensity(count arb.unit)
Wavelength(nm)
0
0.2
0.4
0.6
0.8
1
1100 1300 1500 1700 1900 2100 2300 2500 2700
Intensity(count arb.unit)
Ramanshift(Δcm
‐1
)
(c)Tol u e n e
Figure 2: Raman spectra of (a) oil, (b) furfural and (c)
toluene.
cm
-1
to the C≡C stretching mode of C
2
H
2
(Fast and
Welsh, 1972). We conclude from Fig. 3 that the
Raman band of C
2
H
2
located at ~1972 cm
-1
can be
used for monitoring the C
2
H
2
dissolved in the
insulation oils. In Fig. 3, Raman spectrum of 10%
C
2
H
2
and 90% N
2
gas mixture is also presented.
When C
2
H
2
is dissolved in oil, the gas phase band
position at ~1979 cm
-1
is shifted to ~1972 cm
-1
in
oil. This shift could be attributed to the variation of
vibration modes in oils (Somekawa et al., 2013).
Quantitative analysis in Raman spectroscopy was
performed with a band intensity ratio. This is
because the Raman scattering intensity is a weak
signal and the reproducibility of a Raman spectrum
0
0.05
0.1
0.15
0.2
0.25
0.3
0.35
1900 1950 2000 2050 2100 2150 2200 2250 2300
Intensity(arb.unit)
Ramanshift(Δcm
‐1
)
10%
0%
1.9%
5.7%
10%C
2
H
2
/90%N
2
gasmixture
Figure 3: Raman spectra of C
2
H
2
gas at different
concentrations dissolved in the insulation oil.
0
0.2
0.4
0.6
0.8
1
0246810
Ramanpeakintensityratio
C
2
H
2
concentration(%)
Figure 4: Raman peak intensity ratio (I
1972cm-1
/I
2191cm-1
) as
a function of dissolved C
2
H
2
concentration in oil.
is degraded due to the variation in the excitation
laser intensity and changes in the sample matrix. The
oil-derived Raman signals at ~2191 cm
-1
were used
for these analyses. Figure 4 shows Raman peak
intensity ratios, I
1972cm-1
/I
2191cm-1
, as a function of
C
2
H
2
concentration. The error bars were evaluated
using the standard deviation of 10 consecutive
spectra. The slope of the linear fit is 0.0825.
Therefore, the C
2
H
2
concentration is determined by
this slop and the Raman peak intensity ratio. Also,
we estimated the detection limit of the present
system to be 3σ
C2H2
~0.37%, where σ
C2H2
is the
standard deviation of the Raman spectra from C
2
H
2
free oil sample (0%) in 1952-1977 cm
-1
spectral
range. Thus, the high C
2
H
2
concentrations (~1%)
observed in actual insulating oils are detectable with
current Raman system. On the other hand, the
detection limits could be improved by using longer
path length oil sample, higher average power CW
laser, and more sensitive CCD detector.
TransformerWorkingConditionAssessmentusingLaserRamanSpectroscopy
23
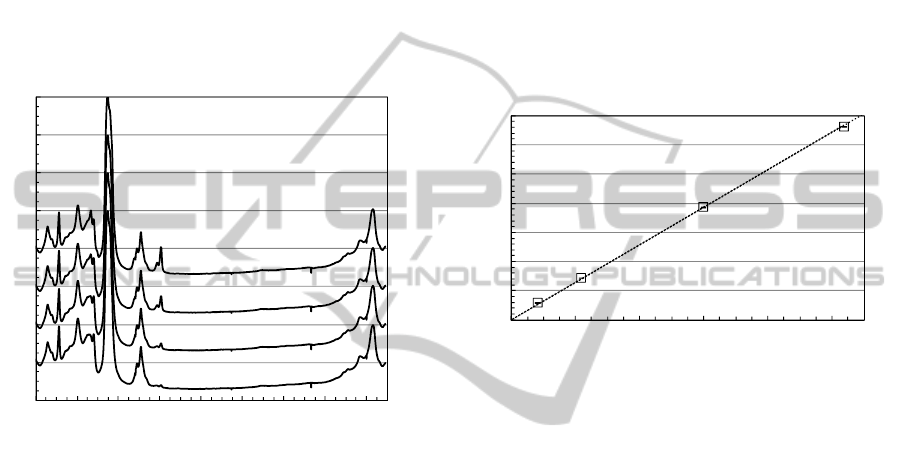
3.3 Raman Spectrum of Furfural in Oil
Figure 2 shows the Raman spectra of (b) furfural and
(c) toluene. The furfural Raman spectrum shows a
H-C-C/O bending mode at 1372 cm
-1
, C-C
stretching mode at 1398 cm
-1
, C=C stretching modes
at 1478 and 1573 cm
-1
, C=O stretching modes at
1675-1705 cm
-1
(Kim et al., 2011). As shown in Fig.
2(c), the measured Raman spectrum of toluene
includes no spectral interferences caused by Raman
band overlap over ~1600 cm
-1
. Detailed toluene
mode assignments can be found elsewhere (Hameka
and Jensen, 1996).
0
0.2
0.4
0.6
0.8
1
1.2
1.4
1.6
1100 1300 1500 1700 1900 2100 2300 2500 2700
Intensity(count arb.unit)
Ramanshift(Δcm
‐1
)
0.08%
0.22%
0.60%
1.04%
Figure 5: Raman spectra of furfural at different
concentrations in oil in the presence of toluene (~9%) as a
solvent.
The furfural spectrum clearly shows an
additional C=O stretching mode at 1675-1705 cm
-1
,
which is not found in oil. Thus, we can easily
distinguish furfural from oil using this Raman band.
Figure 5 shows Raman spectra of furfural at
different concentrations in oil, in the presence of
toluene (~9%) as a solvent. Raman peak intensity at
~1705 cm
-1
increased linearly versus increasing
furfural concentration. The spectral shape
differences between Fig. 2(b) and Fig. 5 can be
observed at 1675-1705 cm
-1
, which may be due to
strong solvent interference (Allen and Bernstein,
1955).
Figure 6 shows Raman peak intensity ratios,
I
1705cm-1
/I
1608cm-1
, as a function of furfural
concentration. The Raman ratio at 1705 cm
-1
shows
a linear dependence on the furfural concentration in
contrast to the non-linear relationship between the
Raman ratio at 1687 cm
-1
and furfural concentration.
In this study, as a furfural-concentration-invariant
signal, we choose the Raman peak of oil and toluene
mixture at 1608 cm
-1
. The error bars were evaluated
using the standard deviation of 5 consecutive spectra
and were hidden in the plot symbols. These ratios
can be reasonably well fitted by a line with a slope
of 0.643. We estimated also the detection limit of the
present system to be 3σ
F
~65 ppm, where σ
F
is the
standard deviation of the Raman spectra from 0.08%
furfural sample between 1720 to 1750 cm
-1
range.
However, the permissible concentrations of furfural
in oil are 1.5 and 15 ppm at caution and danger
levels, respectively (Okabe et al., 2013). Therefore,
further development of the measurement system is
needed to improve sensitivity.
0
0.1
0.2
0.3
0.4
0.5
0.6
0.7
0 0.2 0.4 0.6 0.8 1
Ramanpeakintensityratio
Furfuralconcentration(%)
Figure 6: Raman peak intensity ratio (I
1705cm-1
/I
1608cm-1
) as
a function of furfural concentration in oil.
4 CONCLUSIONS
We demonstrated in-situ application of Raman
spectroscopy for detection of C
2
H
2
and furfural in
the insulating oil to diagnose the transformer health.
Our method also has the advantage of simplicity,
time savings and non-requirement of sample
preprocessing. In addition, the Raman spectroscopy
could simultaneously monitor multi-trace gases and
byproduct materials to get relevant information
about the transformer condition.
In future research, sensitivity improvements of
our Raman spectroscopy system will be performed.
We believe it can be generally applied for assessing
the transformer conditions.
REFERENCES
Allen, G., Bernstein, H. J., 1955. Internal Rotation VII.
The infrared and Raman spectra of furfural. In Can. J.
Chem., 33, 1055-1061.
PHOTOPTICS2014-InternationalConferenceonPhotonics,OpticsandLaserTechnology
24

Duval, M., 1989. Dissolved Gas Analysis: It Can Save
Your Transformer. In IEEE Electr. Insul. Mag., 5, 22-
27.
Duval, M., dePable, A., 2001. Interpretation of Gas-In-Oil
Analysis Using New IEC Publication 60599 and IEC
TC 10 Databases. In IEEE Electr. Insul. Mag., 17, 31-
41.
Fast, H., Welsh, H. L., 1972. High-Resolution Raman
Spectra of Acetylene, Acetylene-d1, and Acetylene-d2.
In J. Mol. Spectrosc., 41, 203-221.
Hameka, H. F., Jensen, J. O., 1996. Theoretical studies of
the methyl rotational barrier in toluene. In J. Mol.
Struct. (Theochem), 362, 325-330.
Kim, T., Assary, R. S., Curtiss, L. A., Marshall, C. L.,
Stair, P. C., 2011. Vibrational properties of levulinic
acid and furan derivatives: Raman spectroscopy and
theoretical calculations. In J. Raman Spectrosc., 42,
2069-2076.
Morais, R. M., Mannheimer, W. A., Carballeira, M.,
Noualhaguet, J. C., 1999. Furfural Analysis for
Assessing Degradation of Thermally Upgraded Papers
in Transformer Insulation. In IEEE Trans. Dielectr.
Electr. Insul., 6, 159-163.
Okabe, S., Ueta, G., Tsuboi, T., 2013. Investigation of
Aging Degradation Status of Insulating Elements in
Oil-immersed Transformer and its Diagnostic Method
Based on Field Measurement Data. In IEEE Trans.
Dielectr. Insul., 20, 346-355.
Somekawa, T., Kasaoka, M., Kawachi, F., Nagano, Y.,
Fujita, M., Izawa Y., 2013. Analysis of dissolved
C2H2 in transformer oils using laser Raman
spectroscopy. In Opt. Lett., 38, 1086-1088.
TransformerWorkingConditionAssessmentusingLaserRamanSpectroscopy
25
