
Portable Sensing of Organic Vapours based on a Single
Semiconductor Sensor
Andrzej Szczurek and Monika Maciejewska
Faculty of Environmental Engineering, Wroclaw University of Technology,
Wybrzeże Wyspiańskiego 27, 50-370 Wrocław, Poland
Keywords: Gas Sensor, Portable Device, VOC, Measurement.
Abstract: A notable need for lightweight, simple-to-use portable gas analysers with facilities aimed at wide range of
applications is observed in the market of measuring instruments today. In this work, a concept of portable
sensing of organic vapours is presented. As the most reliable, the semiconductor gas sensor technology was
chosen. However, due to high power consumption of this kind of sensors only a single sensor option is
currently feasible for the portable device. In view of partial selectivity of the metal oxide based gas sensors,
the unsatisfactory analytical abilities of the device could be anticipated. But, we showed that a single
semiconductor gas sensor may be used for identification and quantification of the organic compounds
vapours. In our solution, this goal is accomplished by applying active gas sampling. It was demonstrated
that variable exposure conditions of a sensor, which are induced by the gas flow, allow for obtaining the
sensor signal that has high information content. It is sufficient to characterize the test gases qualitatively and
quantitatively. The achieved accuracy is very good for a screening device.
1 INTRODUCTION
The detection of volatile organic compounds
(VOCs) or smells has become increasingly
important in industry and for an assessment of
indoor air quality (Postolache et al., 2005). A wide
range of analytical instruments can be used for the
measurement of these species today. They present
different applications and performance
characteristics. These equipments comprise:
laboratory analytical instruments, fixed-point gas
monitoring systems, portable and transportable gas
analysers or detectors.
Recently, there is a widespread need for
lightweight, simple-to-use portable gas analysers
with facilities aimed at a wide range of applications
in process control, quality control and safety in work
areas of factories, research institutions and domestic
premises.
Portable gas analyzers can work on the basis of
different analytical methods and techniques. For
example, portable gas chromatographs and
spectrophotometers are used for qualitative and
quantitative analysis of gaseous substances, while
photoionization and flame ionization detection is
widely applied for the determination of total volatile
organic compounds.
The most common gas sensing technology for
the measurement of VOCs is based on metal oxide
(MOX) gas sensors (Yamazoe, 2009). The
prominent reasons for the selection of these devices
are: wide commercial availability, relatively low
price, possibility of on-line operation and high
sensitivities in detecting very low concentrations of
a wide range of gaseous chemical compounds. In
addition, they are robust, lightweight and small.
Semiconductor gas sensors also present several
important shortcomings, e.g. lack of selectivity and
relatively high power consumption. These
disadvantages limit seriously their application in the
analytical instruments, particularly in portable
analyzers. In practice, this type of sensors is used for
continuous, periodic or instantaneous detection of
specific toxic and flammable volatile substances.
They are applied first of all in fire detectors, leakage
detectors, controllers of ventilation in cars and
planes, alarm devices warning the overcoming of
threshold concentration values of hazardous gases in
the work places.
The aim of this work is to show that single
semiconductor gas sensors can be used in portable
313
Szczurek A. and Maciejewska M..
Portable Sensing of Organic Vapours based on a Single Semiconductor Sensor.
DOI: 10.5220/0004697303130322
In Proceedings of the 3rd International Conference on Sensor Networks (SENSORNETS-2014), pages 313-322
ISBN: 978-989-758-001-7
Copyright
c
2014 SCITEPRESS (Science and Technology Publications, Lda.)

devices for identification and quantification of
organic compounds vapours. This proposition is
located in category of devices for screening tests.
The development of this type of equipment is
motivated by their wide range of applications.
2 EXPERIMENTAL
2.1 Materials
In this work vapours of volatile organic compounds
(VOCs) in air were identified and quantified. The
following substances were used in measurements:
hexane, heptane, octane, cyclohexane, benzene,
toluene, xylene and ethylbenzene. Chemicals were
purchased from Sigma-Aldrich. The details about
the examined concentrations are included in Table 1.
Table 1: The VOCs concentrations used in the
experiments.
Concentration [ppm]
Benzene 25 76 151 302
Toluene 21 64 127 255
Xylene 18 55 111 222
Ethylbenzene 18 55 110 220
Hexane 17 51 102 204
Heptane 15 46 92 183
Octane 14 41 83 165
Cyclohexane 21 62 124 249
2.2 Experimental Setup
We assumed in our concept that a portable analyzer
based on a semiconductor gas sensor should be
relatively cheap and easy in use. Therefore it is to
consist of the following elements (functional
blocks): (1) gas sampling device, (2) single sensor
installed in a measurement chamber, (3) voltage
supplier, (4) interface circuits containing a load
resistor for an electrical signal generation, (5) digital
voltmeter, (6) data acquisition card, (7) display, (8)
user interface, (9) software for signal processing and
pattern recognition tasks implemented.
This concept was tested using an experimental
setup. The sampling device consisted of a diaphragm
pump and a rotameter. It was used to measure and
control the flow rate of the gas sample. Sensors were
placed inside measurement chambers, individually.
Small, airtight measurement chambers were made of
aluminium. They were specially designed for flow-
type measurements. The measurement chambers
were fitted with all the necessary pneumatic and
electrical connections. Fifteen commercially
available Taguchi Gas Sensors made by Figaro
Engineering Japan were tested in this work. These
were: TGS 821, TGS 822, TGS 824, TGS 825, TGS
826, TGS 880, TGS 883, TGS 800, TGS 2201
(gasoline), TGS 2201 (diesel), TGS 2106, TGS
2104, TGS 2602, TGS 2620 and TGS 2600. The
sensors were chosen because of their satisfactory
performance, e.g. sensitivity, response time,
robustness, low price and simplicity of use in many
applications involving measurements of volatile
compounds at different concentrations. The sensor
was connected to the voltage supplier and the
interface circuits containing a load resistor. The
proper working temperature of the sensors was
assured by applying constant voltages to their
heaters. The values of the heaters voltages were
selected in accordance with the recommendations of
the sensors' producer. These were: TGS 821 (5 V),
TGS 822 (5 V), TGS 824 (5 V), TGS 825 (5 V),
TGS 826 (5 V), TGS 880 (5 V), TGS 883(5 V), TGS
800 (5 V), TGS 2201 (gasoline) (7 V), TGS 2201
(diesel) (7 V), TGS 2106, TGS 2104 (7 V), TGS
2602 (5 V), TGS 2620 (5 V) and TGS 2600 (5 V).
The data on the actual sensor operating temperatures
while applying these heater voltages was not
available. The lower bound of the operating
temperature range, usually quoted for semiconductor
gas sensors in general, is 350 °C. For the measuring
purposes, the load resistor was selected separately to
each sensor. The voltage variations measured on the
load resistor by voltmeter constituted the sensor
output signal. The experiments were carried out at a
constant bias voltage. The data acquisition card
converted the output signal into digital numeric
values which were manipulated by a computer. The
signal sampling was performed every 1 s.
The important element of each measurement
system is a calibration procedure. The preparation of
gas standards is a key issue in a case of gas analyzer
calibration. We proposed the procedure, which can
be routinely exploited in each laboratory. The
evaporation method was applied for preparing gas
mixtures of the predefined composition (Szczurek et
al., 2013). It consisted in evaporating the defined
amount of liquid analyte into the known amount of
purified air, collected into the tedlar bag. The
concentration of the analyte was determined by its
dosage, the airflow and its duration. The evaporation
method was successfully validated by comparing it
with a Kin-Tek gas standards generator (491 M).
2.3 Description of the Operation Mode
In this work we have focused our attention on the
SENSORNETS2014-InternationalConferenceonSensorNetworks
314

dynamic response of the sensor exposed to the test
gas in various physical and chemical conditions. The
operation mode was based on the measuring
procedure which consists of three, sequentially
performed stages. The duration of each stage was
420 s and this time was fixed for all measurements
(see Fig. 1). However, in general, different durations
may be chosen. Before the sensor exposure to gas
under test this device attained a steady state in the
stream of pure air. The first step of the operation
mode consisted in the dynamic exposure of the gas
sensor to the stream of air which contained the
organic compound vapours. The test sample was
delivered to the sensor chambers and it was allowed
to continuously flow through. The gas flow rate in
the sensor system was kept constant (1 l/min).
During the second phase of operation, the gas flow
was stopped and the sample was retained in the
measurement chamber. The last step of the operation
mode had two functions: the gas sensor recovery
process occurred and the analytical information was
also acquired. The gas line and the measurement
chamber were cleaned with a stream of pure air. A
constant gas flow rate was maintained during that
operation.
3 METHODS
The key issues in the development of portable
analyzers, based on a semiconductor sensor, are the
methods used for: (1) gas sampling, (2) conversion
of chemical entity into the analytical signal, (3)
feature vector construction, (4) identification and
quantification of the test sample.
3.1 Gas Sampling
Gas sampling is one of the most important stages of
a measurement process (Conner at al., 2006). In
sensor systems it can be based on a natural diffusion
or on the dynamic method. Generally speaking the
diffusive sampling is preferred when limitations in
dimension, payload or energy consumption do not
allow the adoption of a sampling system where the
sensors are hosted in a chamber with controlled
airflow, temperature and humidity.
An active sampling involves an air mover to
draw a sample into the instrument, where it enters
the sensor chamber for analysis, and is then
exhausted back to the atmosphere or a vent line
(Lodge, 1989). In this approach the sensors are
enclosed inside a chamber, where the environmental
conditions and gas exposure times are known and
controlled. Usually the gas sample is automatically
aspirated by the motor driven pump at a prescribed
rate for a prescribed time. The intrinsically safe or
explosion-proof pump has to be employed in some
applications. The active sampling is performed by a
suitable pneumatic system. It consists of a sample
probe and a delivery system which is designed to
transfer the gas from the source to a sensor array.
Usually, the delivery system includes a gas line,
flow indication, valves to control sample draw and
calibration gas delivery, a gas mover (e.g. a pump or
a fan). All gas sensors measure partial pressure, and
a sample actively brought to the sensor is at a
slightly elevated pressure, while a diffusion sensor
operates at ambient pressure, therefore the output
sensitivity of the sample draw sensors is usually
higher than in case of diffusion sensors. This can be
important for many toxic gases with low regulatory
levels. The active sampling is pretty much
independent of environment conditions. When
diffusive sampling is applied, the sensors are located
at or near the points where there is the possibility of
gas release. However, among many detection points
of typical application, there may be locations that are
simply not suited to a sensor installation, either
because one cannot be mounted close enough, or the
maintenance would be difficult or impossible at that
particular spot. In this case the sample draw system
is the most appropriate. The advantages of active
sampling caused that in our concept this approach
was chosen. The power consumption of a
micropump may be estimated based on the demand
for the voltage supply in a range from 3.2 to 26.0
VDC and for the average current of 130180 mA.
3.2 Conversion of Chemical Entity into
an Analytical Signal
Two factors decide about the conversion of chemical
entity into an analytical signal in portable gas
analyzers: sensors and operation mode. Majority of
semiconductor gas sensors are not selective enough
to detect a single chemical species in gaseous
mixture, because of limitations originating from the
principles of the sensing mechanism (Yamazoe and
Shimanoe, 2011). The resistance responses of these
devices to the tested gases are induced indirectly
through oxidation reactions occurring over the
sensing materials. As it is impossible to oxidize only
one specific gas in a mixture of reducing gases
adsorbed by the sensing layer, sensor response may
be influenced by many constituents of gaseous
mixture. This disadvantage cannot be eliminated
completely, but there are methods to improve the
PortableSensingofOrganicVapoursbasedonaSingleSemiconductorSensor
315

selectivity of semiconductor gas sensors. One of
them is based on a sensor array (Szczurek and
Maciejewska, 2012).
This approach is established on an assumption
that cross-sensitivity of the gas sensors is
unavoidable. Static signals include one-dimensional
information; therefore they are inadequate for
distinguishing between the response to a target gas
and to other interfering chemical species. For that
reason, instead of trying to eliminate this feature,
partially selective semiconductor gas sensors are
linked as independent sensing elements in an array
configuration. The selectivity of each sensing
element is admittedly low, but the combination of
the responses of different sensors presents a
characteristic pattern that can be treated as a unique
‘signature’ (“electronic fingerprint”) of individual
chemical species. A subsequent signal processing
and pattern recognition techniques allow for
extracting both qualitative and quantitative
information about the composition of the measured
mixture. In practice, the number of individual gases
that can be quantified using any sensor array is at
most 2 – 3.
Traditional sensor arrays cannot be applied in the
portable devices, because of high power
consumption. Semiconductor gas sensors are the
devices which have to operate at high temperature
for achieving the desired sensitivity and selectivity
to the gases under test. Depending on the material
used and the gases that need to be detected, typical
operating temperatures are between 300°C and
900°C. In commercial portable analyzers, power
consumption has to be minimized, because batteries
are usually the only and unavoidable power source
that can be used with these devices. Thus, the main
effort must be focused on finding the best power-
optimization strategy to permit the device to operate
as long as possible.
One of the strategies is based on instruments
which are designed with low power sensors. The
power consumption of the metal oxide gas sensors
varies based on the design of these devices. A
simple semiconductor gas sensor is basically
composed of a substrate in alumina or silicon (on
which the sensing layer is deposited), the electrodes
(to measure the resistance changes of the sensing
film) and the heater (commonly a Pt resistive type
heater) to reach the optimum sensing temperature.
Sensors on Si bulk substrates (quartz glass spacer as
heat sink, contact via Au bonding) require
approximately 1.3 W of power (at 350°C). The
power consumption can be reduced to approx. 700
mW, when a sensor is suspended in housing and
contacted via Pt welding. One of the most broadly
utilized semiconductor gas sensors is the
semiconductor gas sensor based on tin oxide
ceramic, which is commercialized by Figaro, Japan.
Even though this material is very reliable and shows
a good stability of the sensing properties, its
disadvantage is high power consumption, from 400
mW to 1 W (Table 2), due to heating the massive
ceramic tube. This level of power consumption has a
limit for the sensors to be adopted in a battery
operation portable device.
The most effective method to reduce power
consumption is by the thermal decoupling of the
sensor from the housing, for example through the
use of micromechanical structures (micromachined
heaters), called “micro-hotplates” and contact via Au
bonding (Semancik et al., 2001). The characteristic
feature of these structures is the active area that
comprises a heater, sensor electrodes and the gas
sensitive layer situated in the centre of a thin
membrane, which itself is supported by an outer
frame, made of silicon.
Table 2: Power consumption of the most
energyconsuming element of the semiconductor gas
sensors. There are listed TGS sensors used in the
experiments.
Sensor
Heater power consumption
[mW]
TGS 821 660
TGS 822 660
TGS 824 660
TGS 825 660
TGS 826 833
TGS 880 835
TGS 883 1000
TGS 800 660
TGS 2201(benzene) 505
TGS 2201(diesel) 505
TGS 2106 539
TGS 2104 640
TGS 2602 280
TGS 2620 210
TGS 2600 210
The resistively heated dielectric membrane
provides the thermal insulation between the active
area heated up to high temperature and the silicon.
This approach allows for a low power consumption,
not exceeding 150 mW for operation at 450°C, and
0.3 – 15 mW for operation at 300 °C (Kimon et al,
2001). This small amount of heating power is caused
by the reduction in the heated surface area as well as
by the excellent thermal isolation provided by the
SENSORNETS2014-InternationalConferenceonSensorNetworks
316

thin dielectric membranes. On the other hand, silicon
micromachined gas sensors show some drawbacks
which prevent them from accessing the high volume
market. For example, the robustness of the device is
lower than in case of the alumina devices.
Our proposition is based on an assumption that
the successful using of the sensor array requires the
availability of significant energy resources. The
level of power consumption 100200 mW seems to
be good enough for the battery powered portable
device, which is able to run for about 10 h without
recharging the battery. Therefore, the sensor array is
exchanged into the “virtual sensor array”, which
comprises an appropriately selected single sensor
and a measurement procedure. Our approach was
inspired by the temperature modulation, which was
proposed to increase or decrease sensor sensitivity
and selectivity towards specific gases. In (Raman
and Gutierrez-Osuna, 2004) there were presented
virtual sensors created from single temperature
modulated MOS sensors by varying the operating
temperature. The temperature modulation technique
is particularly interesting for metal oxide sensors as
their selectivity is greatly influenced by the
operating temperature (Gutierrez-Osuna et al.,
2001).
Different volatile substances have characteristic
optimum oxidation and reduction temperatures and
therefore they give rise to characteristic resistance-
temperature profile. It means that for each analyte
and semiconductor gas sensor there may be
determined the characteristic relationship between
the sensing material resistance and temperature.
Thus if the response of one sensor is measured at n
temperatures, the sensor response to gas under test
becomes analogous to an array of n “virtual
sensors”. In other words, the information content of
a measurement with one single sensor can be
dramatically increased when the temperature
modulation is applied. A survey on temperature
modulation can be found in (Lee and Reedy, 1999).
The major drawback of this method is the poor
repeatability of the output signals. Besides, it
requires a precise temperature control and additional
equipment. Therefore we proposed another
approach. It is based on the assumption that n
“virtual sensors” can be distinguished by the
simultaneous diversification of a wide spectrum of
working parameters and operating conditions in a
given period of sensor exposure to the tested gas. In
practice, this idea was accomplished by the suitable
operation mode. This term means a manner or the
way employed to operate a device. In practice, it is a
description of conditions under which the analytical
equipment works. Usually, the operation mode is
characterized by an applied procedure, sensor
environment, method of sensor response (output
signal) measurement and working parameters. The
operation mode may affect the performance
characteristics of semiconductor sensors since it
determines the state of these devices during
measurements. In our concept, “virtual sensors”
originate from the rapid change of sensor exposure
conditions to gas under test.
The operation mode applied in this work is
illustrated in Fig. 1. It is characterized together with
the typically obtained shape of the output signal. The
first stage of operation mode consisted in dynamic
exposure of the sensor to the tested sample. During
this stage, the output signal was strongly affected by
the kinetics of the processes which evoked the gas
sensor response (Nakata et al., 2001). Initially, the
concentration of the test gas quickly increased in the
measurement chamber, which also caused gas
concentration change at the sensing surface. The
semiconductor conductivity changes were caused by
properties of the gas surrounding and interacting
with the sensing material of the sensor as well as by
a number of time-dependent processes such as: the
transport of the reactive species into the sensor
surface, the diffusion of gas molecules inside pores
of the sensing material, adsorption and desorption,
the catalyzed red–ox reactions on the surface of the
sensing layer (mainly their kinetics) and the
electrical/electronic effects in the semiconductor. At
the very beginning of the test gas delivery, the
sensor signal rapidly increased. Later, the
atmosphere around the sensor stabilized, which
allowed for attaining dynamic equilibrium and a
quasi-steady state of the sensing material. During the
second phase of operation, the gas flow was stopped
and the sample was retained in the sensor chambers.
In this period of time the sensor temperature and the
partial pressure of the analyte in the sensor chambers
were continuously changed due to oxidation
reactions taking place at the sensing surface. The
associated sensor output signals usually exhibited
decrease in time. The rate of decay was
approximately constant. During the last step of the
operation mode, the sensor was again in dynamic
conditions. The processes, which influenced the
output signals, were similar as during the first stage.
However, the chemical composition of the gas
stream was changed due to the test compound
removal from the sensor chambers. The dynamics of
the sensor signal was initially high, followed by an
asymptotic decrease towards the sensor signal
baseline.
PortableSensingofOrganicVapoursbasedonaSingleSemiconductorSensor
317

Three advantages decided that we proposed this
mode of operation. (1) It may be easily performed.
(2) The alteration of the sensor exposure conditions
causes the change of many working parameters.
Each of these changes encodes additional chemical
information in the output signal. (3) The alteration of
the exposure conditions does not induce deep change
of the sensor physical state. Therefore the
performance characteristics can be quickly
recovered.
Figure 1: The output signal of TGS2600 recorded when
applying sensor operation mode presented in this work.
The non-linear, transient signal induced by the
alteration of the sensor exposure conditions to gas
under test is a source of chemical information,
because it is a function of variables such as: physical
and chemical properties of the target gas,
concentration and time of the sensor response. Each
change of exposure conditions affects the
characteristic shape of the transient signal that
depends on the particular analyte to which the sensor
is exposed. Therefore, signal measured in unsteady
state of the sensing material conveys multi-
dimensional information leading to an enhancement
in the discriminating ability of the gas sensor. This
fact allows create “virtual sensor array”. In our
approach, each “virtual sensor” is determined by
the strictly defined time point of the sensor response.
In other words, “virtual sensor array” is a set
(collection) of data that represent discrete values of
the output signal in a function of time.
It refers to a
large number of distinct responses gathered from a
single sensor. It is obvious that by combining data
from different ”virtual sensors” one can obtain
more information about a given gas mixture than an
individual sensor signal would provide.
Since
pattern classifiers are blind to the physical source of
their data, “virtual sensor array” may be used to
generate the patterns of target gas in a portable
analyzer. Compared to the conventional approach,
virtual sensor array based on one-single sensor
offers low power consumption, volume and cost,
which open new markets for portable devices.
3.3 Feature Vector Construction
The output signal of a single sensor is defined as the
time-ordered sequence of measurements, which
convey information. Usually, signal processing is
performed in order to extract this information. This
operation is a complicated process and it consists of
baseline manipulation, data compression,
dimensionality reduction, feature extraction or
selection. In our work, the sensor signal is
considered as a “virtual sensor array”. It means that
the feature vector is a combination of the responses
of “virtual sensors”. The requirements considering
simplicity of the portable analyzer cause that none
feature selection is performed in our approach. The
feature vector consists of raw measurement data
obtained in response to the test gas.
3.4 Identification and Quantification of
the Sample
In our concept it is assumed that the portable device
is able to identify the kind of organic vapours and to
determine the concentration category. Both
problems are solved using a classification approach.
In the first case, the class in defined by the kind of
the chemical compound. In the second case, the
class is defined as a concentration range.
We accomplished the classification task using
the kNN classifier (Polikar et al., 2001). This method
was chosen for a number of reasons. First of all,
kNN is the best known non-parametric approach to
classification. It is favourable when the probability
distributions in distinct classes are difficult to
estimate. One faces this problem in particular, when
the number of training patterns is relatively small.
This case is frequently encountered in gas sensor
measurements, because the collection of numerous
patterns may be very time consuming. Second, the
kNN classifier actually lacks the training phase and
all calculations are deferred to the classification
stage. That simplifies its application. The principle
of classification is quite simple. Basically, in order
to classify a test pattern the closest k patterns are
found in the training dataset. Following, the class
which is predominant among these k labelled
neighbours is selected as the class of the investigated
pattern. The algorithm which realizes kNN
classification is simple mathematically and it may be
SENSORNETS2014-InternationalConferenceonSensorNetworks
318
easily implemented in a microcontroller. This is very
important, due to numerous criteria the portable
device has to fulfil, especially the ones regarding
size, weight and easiness of operation.
On a number of occasions the kNN method was
shown to offer very good classification performance
in qualitative gas recognition based on sensor
measurements (Alippi et al., 2006; Maciejewska et
al., 2010; Perera et al., 2002; Szczurek et al., 2011).
An interesting example of quantitative application
was the discrimination of gases based on
concentration categories by means of adaptive kNN
(Roncaglia et al., 2004).
In our examinations, the only parameter of kNN
method was k=2. This choice assured best
performance of the classifier.
In this work, the training data was prepared in a
way to account for the potential deficiencies of the
measurements performed with a portable device. We
assumed that when measuring the same test gas on a
number of occasions, the sensor signal may shift
around the original record. The magnitude of the
shift was taken from the normal distribution with the
zero mean and the standard deviation equal 30 % of
the steady state sensor signal value. By this
operation, the original training data set was
increased fifty times.
The classification performance was evaluated in
terms of misclassification rate using ten-fold cross-
validation procedure.
4 RESULTS AND DISCUSSION
The gas sensing performance, when using a single
sensor, was examined in respect of recognizing the
kind of organic vapour and the concentration
category. Every VOC (Table 1) was recognized in a
framework of oneagainst all classification
problems. Regarding quantitative assessment, there
were defined four concentration categories for each
VOC. The kernels of categories were the
concentrations shown in Table 1. They could be
interpreted as corresponding to: low, medium-low,
medium-high and high concentration range.
Assuming the variability of the information
content along the sensor signal, we compared the gas
sensing performance utilizing entire sensor signal
and its fragments associated with different stages of
exposure (I, II and III). For each classification
problem three best sensors out of fifteen were found,
involving at least one sensor with low heater power
consumption (Table 2).
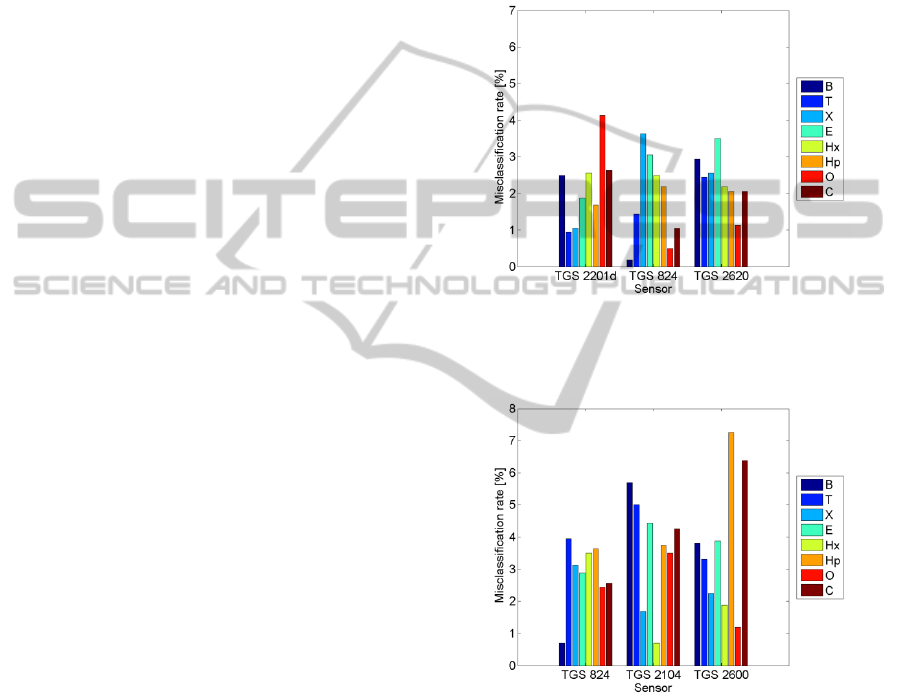
The misclassification rates achieved when
recognizing the kind of organic vapour are shown in
Fig. 2 to Fig. 5. The classification errors associated
with the concentration category recognition are
presented in Fig. 6 to Fig. 9. The names of chemical
compounds were abbreviated in the following way:
Benzene (B), Toluene (T), Xylene (X),
Ethylbenzene (E), Hexane (Hx), Hepatne (Hp),
Octane (O), Cyclohexane (C).
Figure 2: The error of VOCs identification based on the
entire single sensor output signal. The results for three best
sensors are shown.
Figure 3: The error of VOCs identification based on part I
of single sensor output signal. The results for three best
sensors are shown.
It is important to note that variable sensor
exposure conditions play the crucial role in the
single sensor based gas sensing. This fact was
demonstrated by comparing the misclassification
rates achieved when using an entire sensor signal as
opposed to its parts as the basis for gas recognition.
The results were best when the first approach was
utilized (Fig. 2 and Fig. 6). In case only partial
information i.e. associated with a fragment of the
PortableSensingofOrganicVapoursbasedonaSingleSemiconductorSensor
319
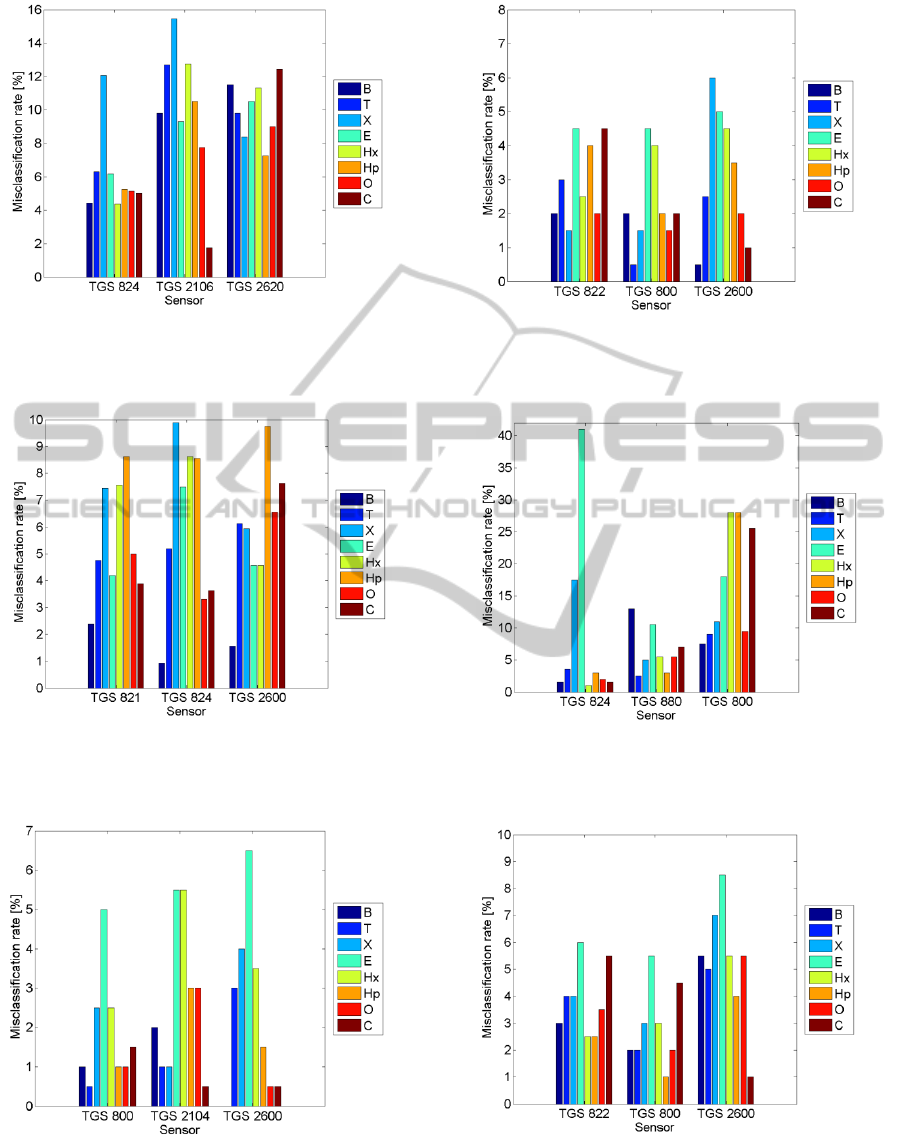
Figure 4: The error of VOCs identification based on part II
of single sensor output signal. The results for three best
sensors are shown.
Figure 5: The error of VOCs identification based on part
III of single sensor output signal. The results for three best
sensors are shown.
Figure 6: The error of determining VOCs concentration
category based on the entire single sensor output signal.
The results for three best sensors are shown.
Figure 7: The error of determining VOCs concentration
category based on part I of single sensor output signal.
The results for three best sensors are shown.
Figure 8: The error of determining VOCs concentration
category based on part II of single sensor output signal.
The results for three best sensors are shown.
Figure 9: The error of determining VOCs concentration
category based on part III of single sensor output signal.
The results for three best sensors are shown.
SENSORNETS2014-InternationalConferenceonSensorNetworks
320

sensor signal was available to the classifier, the
performance usually decreased. The most worthy
contribution to high performance gas sensing came
from the dynamic exposure conditions, causing fast
change of the sensor signal both, when rising (Fig. 3
and Fig. 7) and when decreasing (Fig. 5 and Fig. 9).
In this approach the static exposure conditions were
least informative (Fig. 4 and Fig. 8). The obtained
results promise that the measurement period in the
single sensor portable devise may be shorter than we
originally thought. It may be achieved by
eliminating the middle part of the operation mode,
i.e. stopping the gas flow.
Based on our studies, the single sensor gas
sensing may be effectively performed with low
energy consumption sensors. Overall, the best sensor
of this group for recognizing the gas type was TGS
2620 (Fig. 2). The concentration categories were
best delimited by with TGS 2600 (Fig. 6). The
heaters of both sensors consume 210 mW each. It
proves the technical feasibility of the concept of the
battery powered portable gas sensing device.
5 CONCLUSIONS
The concept of the portable gas sensing device was
presented in this work. It was assumed that the
semiconductor gas sensors shall be applied in our
solution, as this technology guaranties the best
reliability. However, due to high power consumption
required for maintaining the adequate temperature of
the sensing layer, more than one sensor of this kind
is not allowed in the instrument. The portable
character of the device imposes strict power
consumption restrictions. Therefore, a prerequisite
for the feasibility of the concept was the successful
identification of gases and/or the concentration
categories determination using the single sensor
approach.
We showed that the prerequisite may be
satisfied. The crucial factor for achieving this goal
was to apply the active sampling approach in the gas
sensing device. It allows for altering sensor exposure
conditions in time. As a result of variable exposure
conditions the sensor signal may be considered as a
response of the “virtual sensor array”. We showed
that the information content of this data was
sufficient to recognize different volatile organic
compounds and to determine the concentration
categories for the gas samples. The achieved
assessment error was less than 5 %. The portable
sensor device with such performance characteristics
well fits the existing market niche.
ACKNOWLEDGEMENTS
This contribution was supported by the project: "The
variability of physical and chemical parameters in
time as the source of comprehensive information
about indoor air quality". The project is financially
supported by the National Science Center, Poland,
under the contract No. UMO-2012/07/B/ST8/03031.
REFERENCES
Alippi C., Pelosi G., Roveri M., 2006. Computational
intelligence techniques to detect toxic gas presence,
IEEE international Conference on Computational
Intelligence for Measurement Systems and
Applications (CIMSA), La Coruna, Spain.
Conner L., Chin S., Furton K.G., 2006. Evaluation of field
sampling techniques including electronic noses and a
dynamic headspace sampler for use in fire
investigations, Sensors and Actuators B, 116(1–2),
121129.
Gutierrez-Osuna R., Korah S., Perera A., 2001. Multi-
frequency temperature modulation for metal oxide gas
sensors, The 8
th
International Symposium on Olfaction
and the Electronic Nose, Washington, DC.
Kimon I., Bârsan N., Bauer M., Weimar U., 2001.
Micromachined metal oxide gas sensors: opportunities
to improve sensor performance, Sensors and Actuators
B, 73(1), 1–26.
Lee A. P., Reedy B. J., 1999. Temperature modulation in
semiconductor gas sensing, Sensors and Actuators B,
60, 3542.
Lodge J. P, 1989. Methods of air sampling and analysis,
Lewis Publishers Inc., 3742.
Maciejewska M., Szczurek A., Bodzoj Ł., Flisowska-
Wiercik B., 2010. Sensor array and stop-flow mode
applied to discrimination and quantification of gas
mixtures, Sensors and Actuators B, 150, 93–98.
Nakata S., Takemura K., Neya K., 2001. Non-linear
dynamic responses of a semiconductor gas sensor:
Evaluation of kinetic parameters and competition
effect on the sensor response, Sensors and Actuators
B, 76(1–3), 436441.
Perera A., Sundic T., Pardo A., Gutierrez-Osuna R.,
Marco S., 2002. A portable electronic nose based on
embedded PC technology and GNU/Linuxhardware,
software and applications, IEEE Sensors Journal, 2(3),
235246.
Polikar R., Shinar R., Udpa L., Porter M.D., 2001.
Artificial intelligence methods for selection of an
optimized sensor array for identification of volatile
organic compounds, Sensors and Actuators B, 80,
243254.
Postolache O., Pereira M., Girão P., 2005. Smart Sensor
Network for Air Quality Monitoring Applications,
IMTC 2005 – Instrumentation and Measurement
PortableSensingofOrganicVapoursbasedonaSingleSemiconductorSensor
321

Technology Conference, Ottawa, Canada, 17-19 May
2005.
Raman B., Gutierrez-Osuna R., 2004. Chemosensory
processing in a spiking model of the olfactory bulb:
chemotopic convergence and center surround
inhibition, Neural Information Processing Systems
(NIPS), Vancouver, BC.
Roncaglia A., Elmi I., Dori L., Rudan M., 2004. Adaptive
K-NN for the detection of air pollutants with a sensor
array, IEEE Sensors Journal, 4(2), 248256.
Semancik S., Cavicchi R. E., Wheeler M. C., Tiffany J. E.,
Poirier G. E., Walton R. M., Suehle J.S.,
Panchapakesan B., DeVoe D.L., 2001. Microhotplate
platforms for chemical sensor research, Sensors and
Actuators B, 77, 579591.
Szczurek A., Krawczyk B., Maciejewska M., 2013. VOCs
classification based on the committee of classifyers
coupled with single sensor signals, Chemometrics and
Intelligent Laboratory Systems, 125, 1–10.
Szczurek A., Maciejewska M., 2012. Gas Sensor Array
with Broad Applicability, in Sensor Array, Yang W.
(ed), InTech, 81108.
Szczurek A., Maciejewska M., Flisowska-Wiercik B.,
2011. Method of gas mixtures discrimination based on
sensor array, temporal response and data driven
approach, Talanta, 83, 916-923.
Yamazoe N., Shimanoe K., 2011. Basic approach to the
transducer function of oxide semiconductor gas
sensors, Sensors and Actuators B, 160(1), 1352–1362.
Yamazoe N., Shimanoe K., 2009. New perspectives of gas
sensor technology, Sensors and Actuators B, 138,
100107.
SENSORNETS2014-InternationalConferenceonSensorNetworks
322
