
Liquid Crystal Image Analysis by Image Descriptors
Guilherme Enoc Egas de Carvalho
1
, Franklin C
´
esar Flores
1
, Fernando Carlos Messias Freire
2
and Anderson Reginaldo Sampaio
2
1
Department of Informatics, State University of Maring
´
a, Av. Colombo, 5790, 87020-900, Maring
´
a, PR, Brazil
2
Department of Physics, State University of Maring
´
a, Av. Colombo, 5790, 87020-900, Maring
´
a, PR, Brazil
Keywords:
Image Descriptors, Liquid Crystal.
Abstract:
Liquid crystals are substances with high impact technological, new substances have been discovered and the
properties of these materials need to be examined. When viewed under a microscope using a polarized light
source, different liquid crystal phases will appear to have distinct textures and colors. The use of digital image
processing and computer vision is being initialized in the analysis of these materials. The goal of this work
is to propose methods, based on visual descriptors, which are able to identify phase transitions and classify
phases in liquid crystals from a sequence of images.
1 INTRODUCTION
Most substances are found in the following states:
solid, liquid or gaseous. The process in which a sub-
stance changes from solid to liquid is defined as fu-
sion. Besides it, there is a number of substances into
an intermediate state showing simultaneously physi-
cal properties of liquids and features of crystals. This
state is known as liquid crystalline and these sub-
stances are called as Liquid Crystals (LC). There are
many different types of phases in this state, which can
be distinguished by their different optical properties
(Fig. 1).
When viewed under a microscope using a polar-
ized light source, different liquid crystal phases will
appear to have distinct textures and colors. In gen-
eral, in a phase transition, the images have significant
alterations related to optical properties. Such changes
may occur due to several factors such as temperature
and time. Physics researchers study phase transitions
as a way to find alternative substances which have de-
sirable properties (Bahadur, 1992).
Figure 1: Examples of liquid crystals at different tempera-
tures.
Light polarizing-microscopy provides a sequence
of images which each image frame is acquired in
a distinct temperature. The physical characteristics
may be indirectly determined by image sequence
analysis (Sampaio and C., 2004). Statistical ap-
proach is a way to do such analysis (Montrucchio
and Strigazzi, 1998). This approach is simple to ap-
ply, however, some phase transitions are not clearly
observed in such approaches, what justifies the design
of more complex techniques.
The goal of this work is the proposal of two meth-
ods to solve problems in liquid crystal research field
by application of Visual Descriptors, which are usu-
ally applied to accurate representation of images. Vi-
sual Descriptors may be designed to several computer
vision applications; in this paper, Visual Descriptors
are applied to extract structures from the liquid crys-
tal images in order to make possible the measurement
of features that could characterize phases and transi-
tions.
The first proposed method consists in the appli-
cation of Visual Descriptors as phase transition de-
tectors for liquid crystal analysis. This method re-
ceives as input a sequence images of liquid crystal,
makes calculations with visual descriptors and simi-
larity measures and returns a graph where phase tran-
sitions can be identified. The second one is the re-
trieval of images from a sequence which are closer
to an image parameter, which characteristics are used
as key features for the search, as occurs in a typical
Content-Based Image Retrieval (CBIR) system. The
531
de Carvalho G., Flores F., Freire F. and Sampaio A..
Liquid Crystal Image Analysis by Image Descriptors.
DOI: 10.5220/0004695805310537
In Proceedings of the 9th International Conference on Computer Vision Theory and Applications (VISAPP-2014), pages 531-537
ISBN: 978-989-758-003-1
Copyright
c
2014 SCITEPRESS (Science and Technology Publications, Lda.)
main characteristics extracted are related to color, tex-
ture, spatial relationships and shapes (Snoek, C. and
Worring, M., 2005).
This paper is organized as follows: Section 2
presents some preliminary definitions. Section 3 in-
troduces the method to detect phase transitions by ap-
plication of Visual Descriptors. Experimental results
are shown in Section 4 and Section 5 concludes the
paper.
2 PRELIMINARY CONCEPTS
Content-based image retrieval (CBIR) systems search
similar images based on their characteristics: their
feature extraction algorithms obtain image proper-
ties using descriptors, and given a similarity function,
they calculate the similarity between two images.
Two important features may be used to describe
an image: color and texture. Color is widely used to
represent an image, it maintains its properties when it
functions as translation, rotation and scaling are ap-
plied the image. Texture is also an important property
for characterization and image recognition, consisting
in a simple assigment of a repeating pattern in which
the elements are arranged (Cess, G., Snoek, M. and
Worring, M. , 2005).
2.1 Color Moments
Color Moments are statistics moments of the distri-
bution probability of the colors and have been used
with success in image retrieval systems, specifically
when the image contain only one object. The values
of mean (µ), variance (σ
2
) and standard deviation (σ)
are color moments that have been proven to be effi-
cient and effective in the representation of the colors
distribution in the images (Khokher, A. and Talwar,
R., 2012).
Color Moments descritor recover all the images
whose color compositions are similar to the composi-
tions color image query. However, they do not capture
spatial relationships between areas of the same color,
so its power to differentiate between images is lim-
ited.
Given an image I, of size M × N, the Color Mo-
ments given below
µ =
1
M ∗ N
M
∑
i=1
N
∑
j=1
I
(i, j)
(1)
σ =
v
u
u
t
1
M ∗ N
M
∑
i=1
N
∑
j=1
(I
(i, j)
− µ)
2
(2)
define, respectively, the mean and the standard devia-
tion. Variance is given by σ
2
.
2.2 Color Histogram
The color histogram represents the color distribution
in the image, its mean represents the number of pixels
of each color tone in the image (Lew, M., Sabe, N.,
Djeraba, C. and Jain, R., 2006).
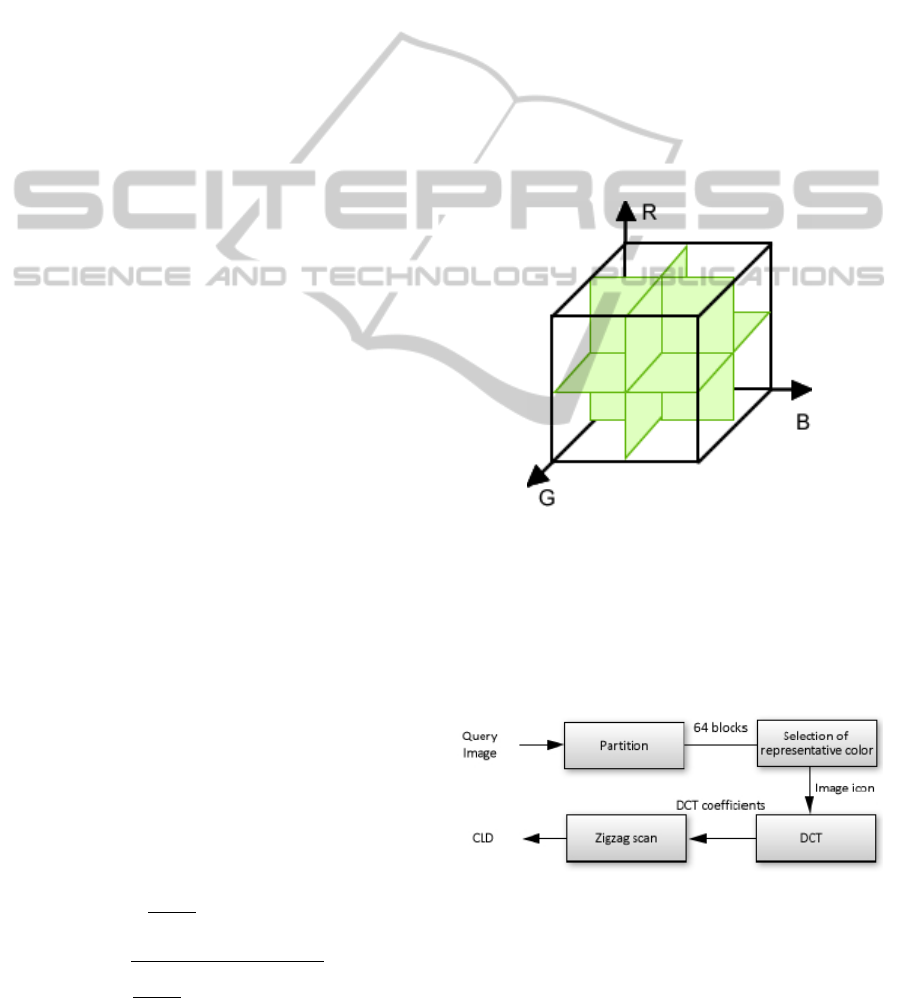
To extract features based on the color histogram,
it is first necessary to quantize the image in a certain
amount of color. It is done due the sparseness of the
original color histogram itself. For example, in Fig.
2, the RGB color space (256 × 256 × 256) was quan-
tized in the RGB color space (2 × 2 × 2), thus reduc-
ing the number of possible color combinations. After
having quantized the image in a number of colors, the
histogram is created based on the color of each pixel.
Figure 2: Division of RGB Color Spacer.
2.3 Color Layout Descriptor
Color Layout Descriptor (CLD) is a descriptor de-
signed to capture the spacial distribution of color in
an image. The extraction process of features consists
in four steps (Manjunath B. S. and Sikora, 2002):
Figure 3: Steps of the Color Layout Descriptor.
1. Image partition: the query image is divided into
64 blocks to assure the invariance of scale and res-
olution (a).
2. Selection of representative color for each block of
VISAPP2014-InternationalConferenceonComputerVisionTheoryandApplications
532
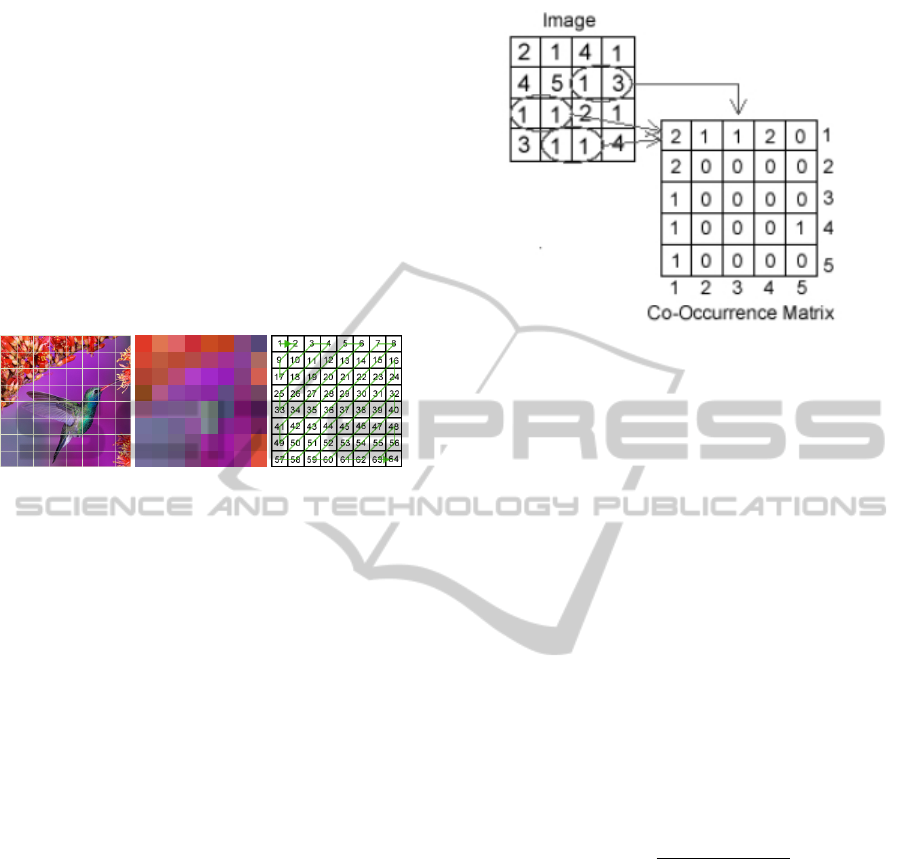
the image: a single color is chosen to represent
each block (b).
3. Obtaining coefficients of applying discrete co-
sine transform (DCT): the image icon is converted
from RGB color space to YCbCr color space, then
DCT is applied to each band in the image (Y, Cb
and Cr) resulting in three dimensional arrays of 64
DCT coefficients.
4. Zigzag Scanning of the found coefficients: is ob-
tained three feature vectors by applying a zigzag
scanning on coefficient matrices. The zigzag
scanning aims to group elements of low frequency
(c).
Figure 4: Steps of the Color Layout Descriptor.
2.4 Co-occurrence
Co-Occurrence Matrix is a two-dimensional matrix,
generated from the count of occurrences of spatial
patterns in the neighbourhood of a pixel (Jain, R.,
Kasturi, R. and Schunck, B., 1995) (Sastry, S., Ku-
mari, T., Rao, C., Mallika, K., Lakshminarayana, S.
and Ha Sie Tiong, 2012).
For each of the possible combinations between
the pixel and the neighboring pixel, is created an el-
ement in the co-occurrence matrix, so that the size
of co-occurrence matrix is t × t, where t is the num-
ber of gray scale present in original image. The il-
lustrates better how is the process of building the co-
occurrence matrix.
Note that the value 1 was assigned to the element
(1,3) of the co-occurrence matrix. This value is repre-
senting the number of occurrences of the combination
[1 3] existing in the original image. How this combi-
nation [1 3] occurs only once in the image, is stored
in the element (1,3) the value 1. As for the element
(1,1), was placed the value 2, which symbolizes the
existence of two occurrences of the combination [1 1]
in the original image.
From the co-occurrence matrix, some interesting
characteristics can be obtained. They are: contrast,
correlation, energy and homogeneity.
2.5 Entropy of Gray Scale
Entropy represents the dispersion degree of the gray
levels of an image and can be used to characterize a
Figure 5: Example of Co-occurrence Matrix.
texture of image (Jain, R., Kasturi, R. and Schunck,
B., 1995).
Given a histogram h of an image I, Entropy can be
calculated as:
E =
N
∑
i=1
h(i) ∗ log
2
h(i) (3)
2.6 Similarity Measures
Once two feature vectors p and q for the images A and
B, respectively, are computed, it becomes necessary
to calculate the similarity between these two vectors.
Defined as D(p,q) the similarity distance between the
features vectors p and q. If D is equal to zero, this
means that the two images may be identical and if D
is close to zero means that the images are similar.
Some well known equations for calculating the
similarity between two vectors are: Euclidean, Man-
hattan and Minkowski [4, 5 and 6].
D(p,q) =
s
N
∑
i=1
(p(i) − q(i))
2
(4)
D(p,q) =
N
∑
i=1
|p(i) − q(i)| (5)
D(p,q) =
N
∑
i=1
|p(i) − q(i)|
r
!
1/r
(6)
3 THE PROPOSED METHODS
This Section introduces the method to detect phases
transitions and the method to detect phases in the
analysis of liquid crystal image sequences.
LiquidCrystalImageAnalysisbyImageDescriptors
533
3.1 Phase Transition Detection
The method to detect phase transition receives as in-
put a liquid crystal image sequence and outputs a set
of phase transition temperatures. Let n be the number
of the images in the image sequence. Each frame of
the image sequence is processed by color or texture
visual descriptor. For each frame i, it is extracted a
feature vector V
i
= hv
1
,v
2
,v
3
,..., v
n
i that represent the
frame i. It is done for each frame in order to create
an DV = hd
1
,d
2
,d
3
,..., D
n
i distance vector where, for
each i, d
i
= D(V
i
,V
(i−1)
. The elements of DV may
be sequentially considered as values of a one dimen-
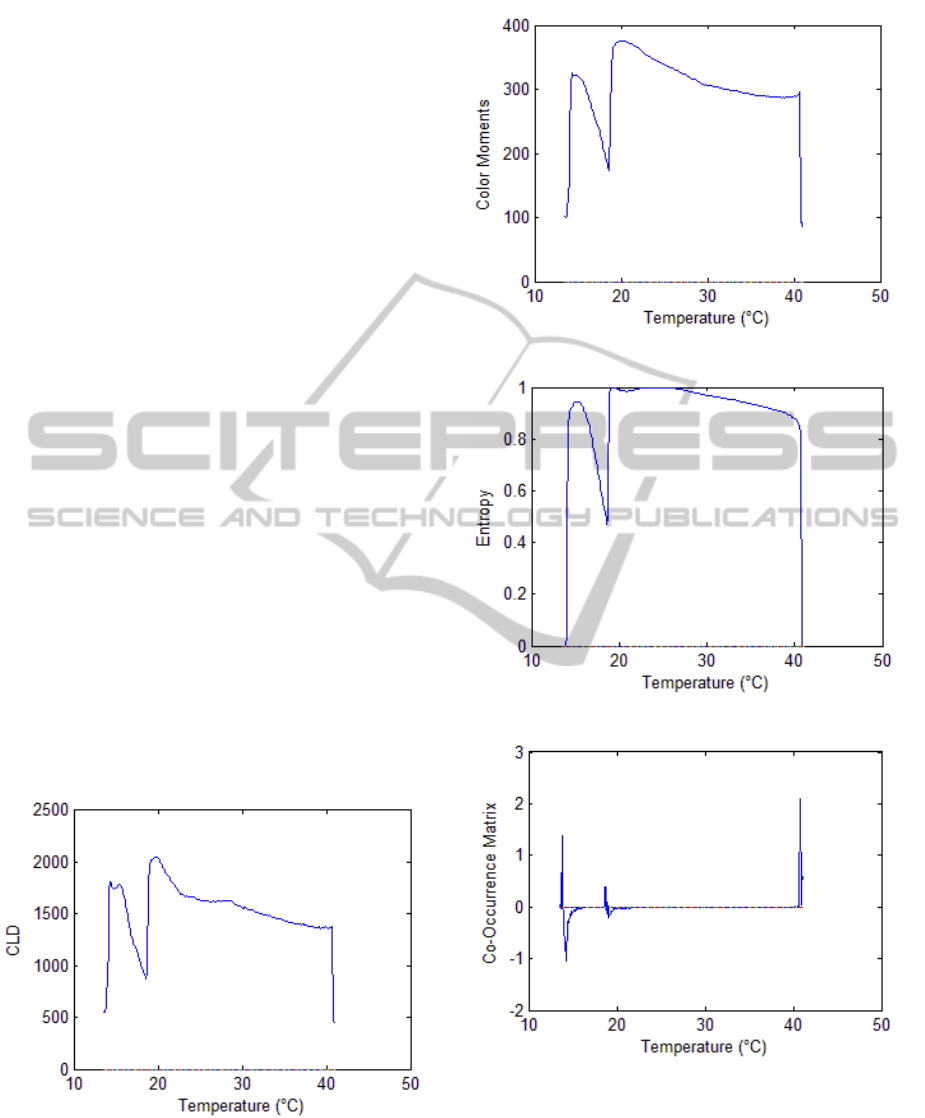
sional function. The Fig. 8 to Fig. 12 show the
plotting of DV for the same input liquid crystal im-
age sequence computed by several visual descriptors.
Peaks and valleys for each plotting represents a pos-
sible phase transition. To calculate the values of the
peaks and valleys of the found function, just check
where the first derivative of the function is equal to
zero. Since images contain light interference and may
present no uniform results, it was considered an inter-
val ∆
x
, where the global maximum (or global mini-
mum) in this interval is taken. It is done in order to
avoid to deal with too many roots. Fig. 8 shows the
plot obtained by Color Layout Descriptor.
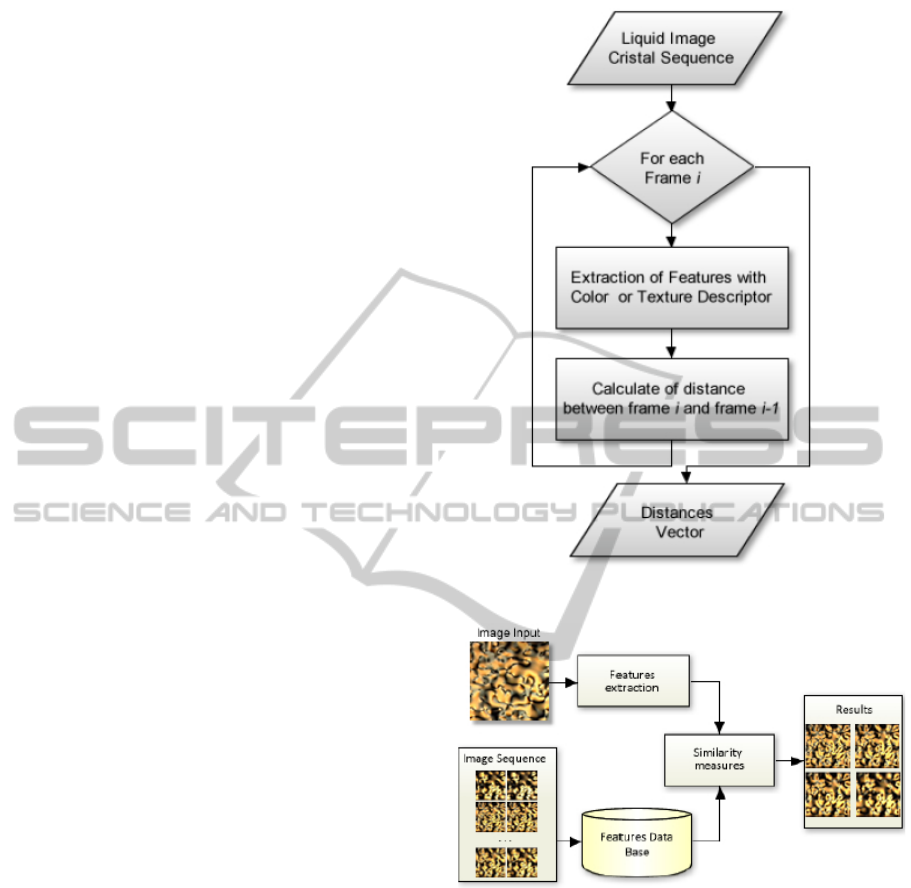
Fig. 6 shows a fluxogram that summarizes the
method.
3.2 Phase Retrieval by CBIR
The second method aims to identify the phases of a
liquid crystal. This method was based on a CBIR sys-
tem Fig. 7. It receives as input data a liquid crystal
image representing a well defined phase as a search-
ing criterion and also receives an arbitrary liquid crys-
tal image image sequence. The method works as fol-
lows:
1. It is created a features vector V
input
to represent
the input image according to a given Visual De-
scriptor.
2. For each frame i of the input sequence it is com-
puted a features vector V
i
.
3. For each vector V
i
, it is calculated a similarity
measure x
i
between it and V
input
. Such vector is
given by x
i
= D(V
input
,V
i
).
4. Let X = hx
1
,x
2
,x
3
,..., x
n
i. Let X
sort
=
hs
1
,s
2
,s
3
,..., s
n
i be a sequence where the
elements of X are sorted in a increasing order.
5. If s
i
= x
j
, it means that, among all images from
the input image sequence, frame j is the i-th clos-
est frame to the input image criterion. X
sort
gives
the ordering of the frames from input sequence
Figure 6: Fluxogram of the method to detect phase transi-
tion.
Figure 7: The proposed method to identify the phases of
liquid crystal.
according to their similarity to the input criterion.
More, the images from the input sequence which
are more probable to belong to the same phase of
the input image criterion are related to small s
i
, at
the beginning of the X
sort
.
4 EXPERIMENTAL RESULTS
The experiments were applied to a known liquid crys-
tal image sequence, acquired from a liquid crys-
tal sample by a well known process (Neto, A.M.F.,
Liebert, L. and Galerne, Y., 1985) in order to produce
VISAPP2014-InternationalConferenceonComputerVisionTheoryandApplications
534
some phases. In a previous paper, this liquid crystal
sequence showed the following phases (A - B - C - D
- A) and was determined, by optical microscopy and
optical birefringence measurements, that the temper-
atures of the phases transitions was: A-B (13.8
◦
C),
B-C (18.6
◦
C), C-D (21.2
◦
C) and D-A’ (40.3
◦
C).
4.1 Experimental Results to Phase
Transition Detection
For the first experiment, the Visual Descriptors were
applied to detect the phase transition. The figures 8
to 12 show the plot of the Visual Descriptor result for
each image of the sequence. The temperatures where
peaks and valleys occurred for each Visual Descriptor
are the ones where probably phase transiitions occurs.
Table I shows the temperatures of each phase transi-
tion found for each visual descriptor. Although some-
what different, all plots in Figures 8 to 12 and data in
Table I show correlation to each other.
The descriptor Co-occurrence showed higher ac-
curacy for detecting the A-B phase transition. All
color descriptors (Color Layout, Color Moments and
Color Histogram) showed the same result for the de-
tection of B-C phase transition, coincides with the real
temperature which is 18.6
◦
C. For the detection of the
C-D transition the descriptors that showed the best re-
sults were the Color Moments and Entropy. In the last
phase transition, D-A’, the descriptor that found phase
transition temperature was of the Entropy. Although
they found different temperatures for the transitions,
all descriptors found the phase transitions with a small
margin of error.
Figure 8: Color Layout Descriptor result.
4.2 Experimental Results to Phase
Retrieval
The second experiment was applied to three samples
Figure 9: Color Moments result.
Figure 10: Entropy result.
Figure 11: Co-Occurrence result.
of the liquid crystal sequence. Was chosen an image
that belongs to phase B, another image that belongs
to phase C and finally one that belongs to phase D.
In the experiment of the first sample, the selected
image is in the temperature of 15.0C
◦
C , it has 49 rel-
evant images that are between 13.8
◦
C and 18.6
◦
C. In
the second sample, the selected image is in the tem-
LiquidCrystalImageAnalysisbyImageDescriptors
535

perature of 19.5
◦
C and it has 36 relevant images that
are between the temperatures of 18.5
◦
C and 21.2
◦
C.
In the last sample, the selected image is in the tem-
perature of 30.0
◦
C and it has 185 relevant images that
are between the temperatures of 21.2
◦
C and 40.3
◦
C.
One way to rank the visual descriptors is using the
functions of Precision and Recall. To calculate the
Precision, is necessary to consider the value n which
means how many images must be retrieved from the
database. The results of the experiments are shown in
Tables II, III and IV.
Precision =
#(retrieved relevant images)
#(retrieved images)
(7)
Recall =
#(retrieved relevant images)
#(relevant images in collection)
(8)
5 CONCLUSIONS
This paper introduces two methods for liquid crystal
image sequences processing. One of them is applied
to detect phase transitions in such sequences and the
other one classifies the phases based on a input im-
age which criterion is defined by its known phase, or-
dering frames according to the similarity to the input
criterion.
Both methods use Visual Descriptors. Color and
texture descriptors showed to be very efficient to ex-
tract information from the complex structures, in or-
der to make easier the proposed tasks.
For the method to detect phase transition, all the
descriptors exhibited good results. The experiments
showed that all visual descriptors found the phase
transitions with high accuracy, since they found tran-
sition temperature values close to the real measured
ones. Colors descriptor had better precision to some
phases transition and texture descriptor were better
for others. For phase transition D-A’, the texture de-
scriptors found values closer to the real value. The
phase transition B-C was best identified by color de-
scriptors. For the other transitions, all visual descrip-
tors presented very approximate answer to real value.
In the experiment for phase retrieval the color de-
scriptors showed better results. For n equals to 10,
color descriptors classify all phases with 100% of
Precision. The calculation of Recall function showed
that is recovered at least 59% of all relevant images
when the color descriptor is used. Texture descriptors
didn’t show good results as the color descriptors, with
exception to identification of the phase D.
In a future work, it is possible to combine the two
methods presented in this paper for best results. Once
discovered phase transitions and how many phases a
liquid crystal possesses, is possible, from a database
of known liquid crystal image sequences, to classify
these phases and the temperature of each found phase
transition.
REFERENCES
Bahadur, B. (1992). Liquid Crystals - Applications and
uses. World Scientific Pub Co Inc.
Cess, G., Snoek, M. and Worring, M. (2005). Multimodal
video indexing: A review of the state-of-the-art. Mul-
timedia Tools and Applications, 25:5–35.
Jain, R., Kasturi, R. and Schunck, B. (1995). Machine Vi-
sion, chapter 7. McGraw-Hill.
Khokher, A. and Talwar, R. (2012). Content-based image
retrieval: Feature extraction techniques and applica-
tion. International Journal of Computer Applications,
pages 356–361.
Lew, M., Sabe, N., Djeraba, C. and Jain, R. (2006).
Content-based multimedia information retrieval: State
of the art and challenges. ACM Transactions on Mul-
timedia Computing, Communications, and Applica-
tions.
Manjunath B. S., Salembier, P. and Sikora, T. (2002). Intro-
duction to MPEG-7. John Wiley and Sons.
Montrucchio, B., S. A. and Strigazzi, A. (1998). A new
image processing method for enhancing the detection
sensitivity of smooth transitions in liquid crystals. Liq-
uid Crystals, 24(6):841–852.
Sampaio, A., P. A. and C., V. (2004). Investigation of uniax-
ial and biaxial lyotropic nematic phase transitions by
means of digital image processing. Molecular Crys-
tals and Liquid Crystals, 408(1):45–51.
Sastry, S., Kumari, T., Rao, C., Mallika, K., Lakshmi-
narayana, S. and Ha Sie Tiong (2012). Transition tem-
peratures of thermotropic liquid crystals fromthe local
binary gray level cooccurrencematrix. Hindawi Pub-
lishing Corporation, 24:9.
Snoek, C. and Worring, M. (2005). Multimodal video in-
dexing: A review of the state-of-the-art. Multimedia
Tools and Application, 25:5–35.
VISAPP2014-InternationalConferenceonComputerVisionTheoryandApplications
536
APPENDIX
Table 1: Experiment with the sample temperature 15.0
◦
C.
Descriptor Precision (n=10) Precision (n=20) Recall
Color Layout 100% 100% 66.7%
Color Moments 100% 100% 63.9%
Entropy 30% 40% 61.1%
Co-occurrence 70% 70% 72.2%
Color Histogram 100% 100% 63.9%
Table 2: Experiment with the sample temperature 19.5
◦
C.
Descriptor Precision (n=10) Precision (n=30) Recall
Color Layout 100% 80% 99.5%
Color Moments 100% 66.7% 96.8%
Entropy 50% 30% 82.2%
Co-occurrence 32% 30% 26.7%
Color Histogram 100% 66.7% 59.2%
Table 3: Experiment with the sample temperature 30.0
◦
C.
Descriptor Precision (n=10) Precision (n=100) Recall
Color Layout 100% 100% 99.6%
Color Moments 100% 100% 96.8%
Entropy 100% 95% 82.2%
Co-occurrence 100% 96% 88.1%
Color Histogram 100% 100% 91.9%
LiquidCrystalImageAnalysisbyImageDescriptors
537
