
A New Algorithm for Objective Video Quality Assessment on Eye
Tracking Data
Maria Grazia Albanesi and Riccardo Amadeo
1
Dept. of Electrical, Computer and Biomedical Engineering, University of Pavia, Via Ferrata 1, I-27100, Pavia, Italy
Keywords: Video Quality Evaluation, Eye Tracking, No Reference Objective Metric.
Abstract: In this paper, we present an innovative algorithm based on a voting process approach, to analyse the data
provided by an eye tracker during tasks of user evaluation of video quality. The algorithm relies on the
hypothesis that a lower quality video is more “challenging” for the Human Visual System (HVS) than a
high quality one, and therefore visual impairments influence the user viewing strategy. The goal is to
generate a map of saliency of the human gaze on video signals, in order to create a No Reference objective
video quality assessment metric. We consider the impairment of video compression (H.264/AVC algorithm)
to generate different versions of video quality. We propose a protocol that assigns different playlists to
different user groups, in order to avoid any effect of memorization of the visual stimuli on strategy. We
applied our algorithm to data generated on a heterogeneous set of video clips, and the final result is the
computation of statistical measures which provide a rank of the videos according to the perceived quality.
Experimental results show that there is a strong correlation between the metric we propose and the quality
of impaired video, and this fact confirms the initial hypothesis.
1 INTRODUCTION
Multimedia user experience evaluation is now an
important topic of research, and it has been one of
the most relevant since the early beginning of the
multimedia content digitalization era. One of the
crucial challenges in this field is defining quality
assessment metrics, which had its explosion when
the first image compression standards appeared. The
proposal of new metrics for estimating the user
perceived quality of a multimedia content, no matter
if this content is an image, a video or an audio one,
is increasing and refining each year. This study is
the continuation of our previous work (Albanesi &
Amadeo, 2011), which describes a new
methodology to estimate the video perceived quality
in case of lossy compression of a digital sequence.
In that paper, the authors designed a subjective and
no reference approach to measure the average ocular
fixations duration of users subject to different
quality level stimuli. These fixations were gathered
through a set of experiments with the Eye-Tracker.
We defined that a “temporal based” study, since the
analysis algorithm of eye tracker data did not
consider the position of the gaze, but only the
durations of the fixations. The results obtained by
the experimental procedure were elaborated to
present a quantitative metric. It was proven that this
metric has a good correlation with the user perceived
video quality. The results encouraged us to think
that a similar approach could be used not only to
investigate time-related characteristics of the human
ocular behavior on a video quality-assessing task,
but also the space-related characteristics, i.e., the
position of human eye fixation. We call these
positions Gaze-Points. Our proposal presents a
voting-process based algorithm that works on Eye
Tracker data to generate Gaze-Maps. On these maps,
we compute statistical functions to generate a rank
of video according to the measured perceived
quality. Therefore, our method starts from subjective
data (Eye-Tracker data) and generates an objective
video quality metric. The elaboration of
physiological Eye Tracked data returns a set of
quantitative scores that allows ranking the stimuli
accordingly to the perceived quality. Our final goal
is to find a recurrent behavior of the HVS by
computing quantifiable parameters that can help in
discriminating video sets in relation to the user
perceived quality. The paper is structured as follows:
Section two includes a review of the state of the art
of Multimedia Quality of Experience research and a
462
Grazia Albanesi M. and Amadeo R..
A New Algorithm for Objective Video Quality Assessment on Eye Tracking Data.
DOI: 10.5220/0004672104620469
In Proceedings of the 9th International Conference on Computer Vision Theory and Applications (VISAPP-2014), pages 462-469
ISBN: 978-989-758-003-1
Copyright
c
2014 SCITEPRESS (Science and Technology Publications, Lda.)

conceptual comparison to our approach. Section
three presents the new algorithm based on voting
process approach. Section four explains the
experimental activity we performed and section five
describes the results. Conclusion and the future
developments end the paper.
2 RELATED WORK
The study of the HVS behavior became relevant, in
recent years, in the field of image and video
elaboration and transmission research. It became a
necessity when it was demonstrated that technical
metrics are not strictly correlated with the user
perceived quality (Wang, et al., 2004). These studies
changed the focus of Image and Video Quality
Evaluation techniques. The “device oriented”
approach (Quality of Service – QoS), that ultimately
brought to algorithms like the Peak Signal to Noise
Ratio and the Mean Square Error, was left behind
and replaced by a “user oriented” one (Quality of
Experience – QoE) (Winkler & Mohandas, 2008).
The foundation of the new model lies in the
inclusion of subjective evaluation into algorithms
and procedures that try to predict the level of
satisfaction of the user, abandoning the focus on the
technical parameters of the infrastructure. Today,
finding an objective and robust link between the
QoS and the QoE, is a challenging research topic,
and can be very relevant to improve multimedia
applications and services. The metrics that were
developed after this conceptual shift are usually
categorized as subjective or objective, while the
previous type of categorization, as No Reference,
Full Reference or Reduced Reference (NR, FR, and
RR), still stands. This second differentiation depends
on the necessity of the original multimedia content
(not coded or elaborated in any way) in order to
obtain results from the algorithm. The pros and cons
of subjective and objective methodologies are
discussed in (Kunze & Strohmeier, 2012) for
subjective procedures and in (Le Meur, et al., 2010)
for objective ones. To fill the gap between subjective
and objective metrics, it is desirable to combine the
precision in understanding the user perceived quality
of subjective algorithms with the simplicity and fully
automatic approach of objective algorithms. In (Zhu,
et al., 2012), a new HVS methodology built on the
retinal input is used to estimate the saliency of an
image, while (Linying, et al., 2012) uses the current
understanding of the HVS color space to propose a
content-based image retrieval algorithm. These two
studies, together with several others, show how
taking into account the HVS features it is possible to
enhance known and newly developed procedures
(Lai, et al., 2013), obtaining more reliable results.
The methodology is called “perceptual approach” to
the QoE research topic. The key of this approach is
to maximize the quality of the video or image
regions that are deemed as most relevant by the
users. In (Lee & Ebrahimi, 2012), the authors offer a
deep and recent overview of how a perceptual
approach to video compression has enhanced the
efficiency of the known techniques. The main
difference between our approach and the previously
quoted ones is that we do not create a model of HVS
(based on some physiological and/or psychological
behavior), but we derived the response of HVS to
visual stimuli directly from the experimental dataset
provided by Eye tracking analysis. The choice has
the advantage of considering the entire behavior of
the HVS (not only the ones “coded” in the
modelization). On the contrary, the main
disadvantage is that a post-processing algorithm on
the generated dataset is mandatory to provide
reduced, manageable and meaningful data related to
video saliency. Utilizing and exploiting the
advantages of knowing how the HVS reacts and
behaves to stimuli is called a “foveated approach” to
IQA and VQA, and it is used to develop video or
image saliency maps. The most accurate
methodology to define these maps requires the
utilization of an Eye Tracker device. Recording the
point of gaze of the users on the stimuli returns real-
world data, which means that it has to be considered
as “irrefutable truth” to which all the
modeling/evaluation methodologies should adhere.
It is easy to understand how this methodology is
useful to evaluate the effectiveness of objective
quality evaluation algorithms, as the studies
presented in Table 1 demonstrate. All the works
presented in this table are good examples of how
Gaze-Maps can be used as ground truth for IQA and
VQA procedures and HVS modeling. In our VQA
approach, we prefer to exclude the errors induced by
the use of predictive algorithms; therefore, we apply
our procedure on ground truth data. Our proposal is
a new metric based on an innovative use of Eye-
Tracked Gaze-Maps: each Gaze-Point of each map
is weighted by all the other Gaze-Points on the same
map, in pursuance of a self-definition of its
relevance. Then, we perform a statistical analysis in
search of eventual correspondence with the user
perceived quality level. These maps identify the
salient regions of the video stimuli we used in our
experimental activity. The contribution in literature
which is closer to our approach is
ANewAlgorithmforObjectiveVideoQualityAssessmentonEyeTrackingData
463

Table 1: Summary of Eye Tracking parameter used in Quality of Experience assessment activities.
Paper
N. of
Tester
N. of
T
ester pe
r
group
N. of
Original
stimuli
Type of
stimuli
N. of Total
stimuli
instances
Stimuli
Duration
Stimuli
Resolution
Impairment
Techniques
ET frequency,
accuracy
(Youlong, et al.,
2012)
20 20 2 vid 24
10 s or
more
1280x720 Compression -
(Chamaret & Le
Meur, 2008)
16 16 4 vid 4 - 720x480 Cropping 50 Hz, 0.5°
(Le Meur, et al.,
2010)
36 36 10 vid 60 8 s 720x480 Compression 50 Hz, 0.5°
(Gulliver &
Ghinea, 2009)
36 12 12 vid 12
10 s or
more
640x480
Frame rate
variation
25 Hz, -
(Hadizadeh, et
al., 2012)
15 15 12 vid 12 5 to 10 s 352x288 Orignal 50 Hz, 1°
(Mittal, et al.,
2011)
12 6 20 vid 60 30 s 720x480
Orignal
(different tasks)
50 Hz, 1°
(Boulos, et al.,
2009)
37 37 45 vid 100 8 to 10 s
1920x1080,
720x576
Cropping,
resampling
50 Hz, 0.5°
(Albanesi &
Amadeo, 2011)
18 6 19 vid 57 8 to 66 s 352x288 Compression 50 Hz, 1°
(Liu &
Heynderickx,
2011)
40 20 29 img 29
10 s or
more
768 x 512 Compression 50 Hz, 1°
(Engelke, et al.,
2013)
15 to 21 15 to 21 29 img 29 10 to 15s Varies Varies 50 Hz, 1°
(Ninassi, et al.,
2007)
20 20 10 img 120 pic 8s 512x512
Compression,
blurring
50 Hz, 0.5°
(Mittal, et al., 2011), but in that case the activity is
performed on still images. The authors studied the
task dependency of the ocular behavior during an
IQA procedure. However, even if the two
approaches seem similar, our methodology differs
because we considered relevant the position of the
eye during saccades. To do that, we chose to cluster
the samples during the whole view time of the users.
Our Gaze-Points voting algorithm takes into account
the time that occurs to HVS to “choose” which parts
of the stimuli to stare at. This difference is
fundamental to study our hypothesis. In case of the
HVS gazing around a detail for some time without
defining a fixation, excluding saccade times could
cause information loss. We considered that interval
of time relevant and indicative of the difficulty the
HVS has in understanding the quality of the
stimulus; therefore, we needed to know how the eye
behaves in the period between fixations too. Even if
previous works that state that the perceived quality
is not precisely measureable by Eye Tracking
devices exist (Ninassi, et al., 2007), (Le Meur, et al.,
2010), the authors did not choose to eliminate all the
possible influences on the viewers of their memory.
Recent works demonstrate how knowing a content in
advance is a huge bias that affects the visual strategy
of a viewer (Laghari, et al., 2012), which then may
lead to inconsistency of the retrieved data and of the
conclusions. The choice of not excluding content
repetition from visual experiments still makes sense,
because it allows within-subject comparisons, but it
is then impossible to define if results obtained are
caused by the hypothesis under investigation, or if
they are altered by the repetition of the content
proposed to the testers. In order to exclude memory
effect bias on the recorded data, we created a
procedure that avoids any repetition of the same
semantic content to the same user while performing
the subjective Eye Tracking tests.
3 THE VOTING PROCESS
ALGORITHM
The following steps compose the methodology for
the Gaze-Map generation and analysis.
3.1 Dataset Creation
As we consider both time and space in our
algorithm, it is necessary to know the sampling
frequency of the Eye Tracking device. Each
complete sample must include the timestamp of the
moment it is recorded and the X and Y coordinates
of the point of gaze on the screen for each eye. We
decide to compress each original video using
different bit rates, to create several quality-impaired
instances of different instances of the same semantic
VISAPP2014-InternationalConferenceonComputerVisionTheoryandApplications
464
video. The choice of the semantic content of the
stimuli is relevant, too. It must be as general as
possible, and the playlists for the experiment must
be created to avoid any semantic repetition. Further
explanations are presented in section 4, as we show
how we gather the data for the experimental
validation of the algorithm.
3.2 Initial Filtering
A first filtering operation is made to exclude any
misreported record. The Eye-Tracking dataset
usually includes negative spatial coordinates; those
values mean that the gaze position at a given
timestamp cannot be recorded, most probably due to
minimal head movements of the observers that the
device cannot compensate. Those records must be
excluded.
3.3 Timestamp Normalization
The retrieved dataset usually cannot be studied "as
is" because the samples usually are not perfectly
aligned, due to experimental and/or the human
behavior differences. Our decision of clustering the
observation records over a fixed interval of time
instead of comparing the full set of Gaze-Points
(GP) retrieved by the experiments is instrumental in
making irrelevant the impact of that kind of
experimental error. The arrangement is also taken to
have comparable sets of measures from different
videos and observers. One important effect of this
approach is to soften the impact of measure errors
given by any head movement/inaccuracy of the
instrument that could not be filtered in step 3.2. The
idea behind this process is to reduce the set of data
and to normalize it knowing the duration of each
video. The chosen interval size is 1 s, which allows
to group sequential records in number high enough
to exclude the impact of accuracy measure errors.
The shortest the interval, the more likely is to
include altered records only. For example, when the
tester’s head is not perfectly motionless, the Eye-
Tracker may empirically lose track of the gaze for
dozens or even hundreds of milliseconds. We want
an interval long enough to account for these possible
errors. We call this phase clusterization, which
generates clustered Gaze-Points (cGP). For example,
a 30 s video (timestamp t∈
;
,where
is
recoded on the last frame of the video) has 30
intervals, i ∈1;
d
, with i
d
=30. Tester one on video
one must have only one clustered Gaze-Point record,
cGP
i
(X
cGP
i
, Y
cGP
i
) for each i, summarizing all the
records of the raw dataset belonging to interval i.
For i=1, all the Gaze-Points whose timestamp t was
included between t
i-1
=t
0
=0 (the beginning of the
recording of interval defined by i=1) and t
i
=999 are
included. The second Clustered Gaze-Point cGP
2
summarizes the records with t ∈ [1000; 1999] and so
on, until i=i
d
and t ∈ [
;
]. The average
coordinates of all the records give each clustered
Gaze-Point coordinates in the chosen interval.
Therefore, cGP
i
(X
cGP
i
, Y
cGP
i
) can be considered as
the “center of gravity” of the subset of records it
refers to, preserving the HVS behavior information
carried by those records.
In (1), (2) (X
GP,t
; Y
GP,t
) are the recorded coordinates
of X and Y of the raw dataset at time t.
,
∑
,
; i ∈1;
; t∈
;
;
(1)
,
∑
,
; i ∈1;
; t∈
;
;
(2)
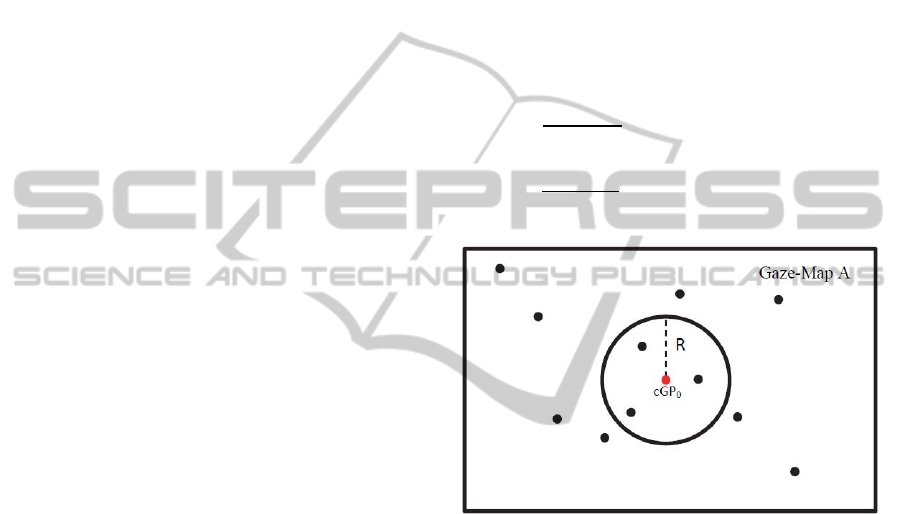
Figure 1: R-dependent analysis example, the weight of
cGP
0
is 4.
3.4 Gaze-Map Generation
The next step is to create a Gaze-Map for each
instance of each video. Each Gaze-Map is created by
plotting all the cGP taken from the previous step.
The number of Gaze-Maps created as result of this
step is identical to the number of video instances
involved in the Eye Tracking activity. Each map
includes the data gathered from the whole set of
observers that evaluate the stimulus.
3.5 R-Dependent Voting Process
Analysis
This elaboration is repeated on all the Gaze-Maps.
To simplify the exposition, let us consider a
simplified Gaze-Map “A” (see Fig. 1). The goal is to
make each cGP of A define its own weight, so the
ANewAlgorithmforObjectiveVideoQualityAssessmentonEyeTrackingData
465

voting process is performed for each clustered Gaze-
Point in the Gaze-Maps. The voting process depends
on a parameter R, which is the radius of the
circumference centered in the cGP under analysis
(from Figure 1,
). The operation is fundamental
because each cGP of A needs to be weighted by the
cGP in its neighborhood, including itself. The voting
process (similar to the one of the Generalized Hough
Transform) is defined as follows: the weight of the
current
(X, Y) is voted by all the cGP on the
same Gaze-Map (
(x, y)). The contribution to the
weight of
is 1 if
is included in the
circumference of radius R, 0 otherwise, according to
the following pseudo-code:
if ((x-X)-x)^2+((y-Y)-y)^2<=R^2 &&
Gaze-Map (x-X, y-Y)==1 {
c=c+1;} %weight counter
R is also the value chosen each time to perform a
second filtering operation on the map border. It
excludes an R-wide frame of pixels from the
contribution to the weighting process. This feature
aims to limit the importance of the difference
between the video resolution and the monitor
resolution. The problem is common when
performing an Eye Tracking test on stimuli whose
resolution is different from the one of the screen
they are visualized on. With the variation of R, this
filter is adaptive to the analysis we want to perform.
After performing this step, each cGP of the Gaze-
Map is associated to its weight. Obviously, the value
of the weight depends of the proximity to other cGP
and on the radius R. The statistical average is then
computed, and an Average Clustered Gaze-Point
Weight (AGPW
A,R
) is generated for each value of R
and each Gaze-Map.
3.6 Iteration Process
By performing the operations described in section
3.5 to the whole set of Gaze-Maps, the algorithm
generates the mean value of AGPW
A,R
for each
video. Finally, the values for each compression level
are elaborated to obtain, given a known R, the
average clustered Gaze-Point Weight for a given
quality level (Quality Level Average Gaze-Point
Weight – QLAGPW) and the standard deviation of
clustered Gaze-Point Weights (Standard Deviation
of QLAGPW – SDQLGPW) for each compression
level used in the experiment. These two sets are the
final, R-dependent, results of the procedure. And
they are also the values at the basis of the ranking of
video according the perceived quality, as explained
in Section 5.
As the Average Clustered Gaze-Point Weight
depends on R, we have generated a whole set of
measures, for R varying from R1 (minimum, in
pixels) to R2 (maximum, in pixels) with a fixed step,
a, of 10 pixels. The choice of R depends on the
video resolution and on the relative dimensions of
objects on the scene; therefore we have considered a
choice of R1 and R2 of 1a and 40a, respectively.
The unit of R is pixels because, given the fact
that the experimental set up is not changing for any
observer or stimulus, the visual angle is not
changing. Experimental results validate this choice
(see section 4 and 5).
4 EXPERIMENTAL VALIDATION
This section describes the experimental setup we
adopted to validate our algorithm in a real-world
environment.
4.1 Choice of Human Observers
The number of testers involved in our study is 18, 10
males and 8 females, with an age varying from 22 to
27. All of them have normal or corrected-to-normal
sight and participate for the first time to a QoE Eye
Tracking test, even if they have regular experience
in using computer interfaces to watch videos. All of
them are graduate or undergraduate students who
freely volunteer to participate to the activity. They
are randomly divided into three groups of six testers.
Six may seem an insufficient number of testers, but
this choice has been successfully used in (Mittal, et
al., 2011), with meaningful conclusions. We think
that, rather than the number of testers for each
playlist, the most important features of the
experimental set up are the number of different
semantics (videos) and the number of total impaired
version (instances).
4.2 Media Selection
We use 19 different semantics taken by the current
literature (Seeling & Reisslein, 2012), (University of
Hannover, March 2011), (xiph.org, March 2011).
The original files are YUV sequences, 4:2:0, in CIF
resolution (352x288). For each of them (HQ) two
impaired instances are created, bringing the total
number of sequences to 57. The impaired copies are
generated by compression. Each original video is
compressed with the H.264/AVC algorithm at two
different levels, altering the target bit-rate: 450 b/s
and 150 b/s are the choices for medium and high
VISAPP2014-InternationalConferenceonComputerVisionTheoryandApplications
466
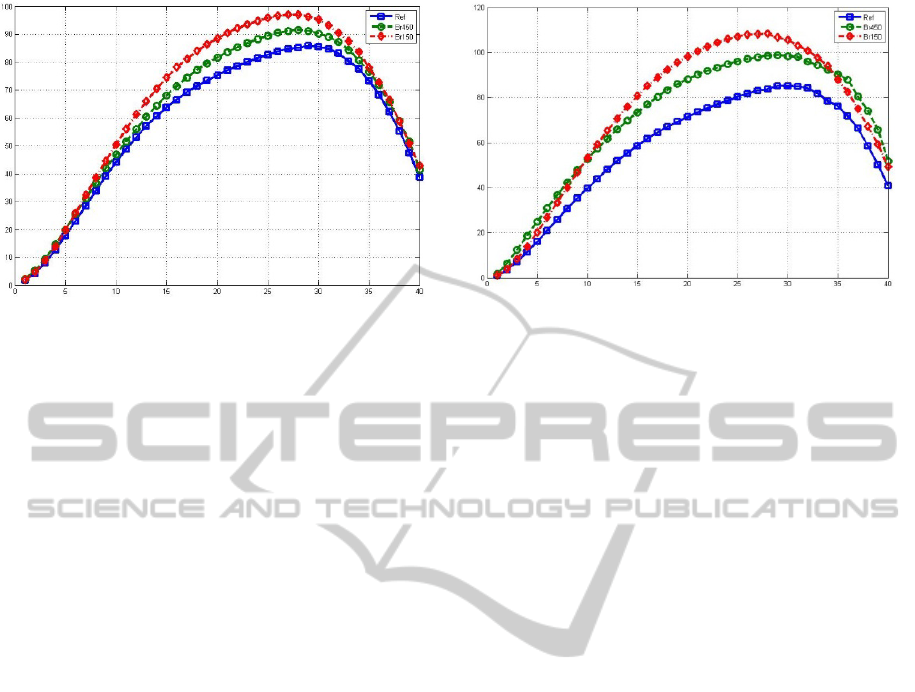
Graph 1: QLAGPW (y-axis) vs. varying radius of analysis
(x-axis).
Graph 2: SDQLGPW (y-axis) vs. varying radius o
f
analysis (x-axis).
compression (inducing medium and low quality –
MQ and LQ) respectively. The aim was to create
three different pools to build sufficiently varied
perceived quality levels, similarly as in (Mittal, et
al., 2011). The discussion of the effects of this
choice as well as all the other details of the video
dataset are deeply analyzed in (Albanesi & Amadeo,
2011).
4.3 Eye-tracking Protocol
The eye tracking dataset is gathered using a Tobii
iViewX device, configured with Windows XP. It
has a double CRT monitor setup, with the screen
resolution and calibration and all the monitor
settings as suggested by the user manual of the
device itself. Explicitly, the monitor resolution and
the recording field of the instrument were
1280x1024. This means that the video did not
occupy completely the recording field so a black
frame was added to create a neutral environment on
the useless part of the screen. The sampling
frequency of the Eye Tracking device is 50 Hz, and
its accuracy is less than 1 degree of visual angle. All
non-specified parameters of the activity comply with
ITU-R BT 500-10 standard for Absolute Category
Rating with Hidden Reference (ACR-HR) protocol.
The choice of this protocol is due to its reliability, its
ease of execution, and because it proved to be the
most effective way to perform this kind of activity
(Tominaga, et al., 2010). We used a group of
questions directly asked to testers after each video to
record the Mean Opinion Score on a five point
discrete scale (Huynh-Thu, et al., 2011). We stated
that stimuli were presented in a way to exclude any
sort of memory effect: three playlists were created
from the 57 instances in the starting pool (playlist A,
B and C), and in each of them only one copy of the
three at disposal for each video (Ref, Br450, Br150)
was placed. If playlist A includes a stimulus
compressed at 150 b/s, then it cannot include the
same sequence compressed at 450 b/s or
uncompressed. This means that each playlist has 19
videos and that the experiment duration is inferior to
30 minutes per tester, as advised by the guidelines.
All the playlists includes six or seven videos for
each compression level, to be as heterogeneous as
possible. Playlists and testers groups are matched
randomly in order to assign six viewers to each
playlist.
5 RESULTS
In Graph 1, it is possible to see the regular pattern of
Quality Level Average Gaze-Point Weight
(QLAGPW) as a function of R. As easily
predictable, the values of the average weight are
increasing until the second filtering process (the R-
wide frame of pixels excluded from voting, see
section 3.5) becomes too extreme and begins to
exclude relevant cGP from the voting process. We
can identify an interval of R where the curve are
completely monotonic and separated, from 10 to 27.
The results show, for this interval, that the behavior
related to the quality level becomes very regular: the
higher QLAGPW, the lower the user perceived
quality measured by the average MOS of the stimuli.
In fact, the curves are ordered with the best video
quality (Ref in the plot, blue line, avg. MOS 3.77,
MOS variance 0.74) in the lowest position, the
medium quality (Br450, green line, avg. MOS 2.81,
variance 0.66) in the middle, and the lowest quality
(Br150, red line, avg. MOS 1.86, variance 0.42)
above. In addition to this first conclusion, Graph 2
ANewAlgorithmforObjectiveVideoQualityAssessmentonEyeTrackingData
467

shows that the SDQLGPW has the same regular
behavior: the higher is the perceived quality; the
lower is the Standard Deviation of the GP weight.
The lower Weight of Gaze-Points means that points
of gaze on the screen while watching the sequences
are more distant from each other on high quality
level stimuli, and the lower standard deviation in this
case suggests that even if there was more space
between fixations, those fixations were more
regularly distributed on the screen than in other
cases. In fact, a low Standard Deviation indicates
that cGP weights are similar to each other. The most
probable explanation is that the viewers had time
and chance to gaze around the finest details in the
case of high quality videos, and this lead to a more
spread set of observations on the screen. It also
means that in this case, each observation has an
inferior but more similar number of near
observations. The higher average weight and
standard deviation of the data gathered from low
quality videos, instead, suggest that the viewer
focused on smaller portions of the screen, with a
high density of “heavy” observations in it and a low
number of “light” observations outside the region of
interest. This confirms our initial hypothesis, which
stated that a more impaired video is more
challenging for the HVS, and therefore it is more
difficult to understand the semantic meaning of a
salient region. When the radius R of analysis
becomes too high and, together with the filtering
frame, starts to elide meaningful Gaze-Points or to
consider too many of them as relevant, the curves
start to decrease and the peculiar differences
between the quality levels are lost. Therefore, the
ranking has to be performed by considering only the
portion of curves that are monotonic. Performing
this procedure to groups of different compressed
video offer the chance to rank them accordingly to
their quality level, without knowing the performed
compression parameters they were subject to. For
this reason, we called our approach a No Reference
metric.
The most relevant criticism that can be moved to
our approach is that the HVS strategy is much more
dependent on the semantic content of the chosen
stimuli, rather than the perceived quality. This
objection, that has its origin from several
experimental activities like (Cerf, et al., 2009), can
only be addressed by expanding the set of original
stimuli to include heterogeneous semantic messages.
Other works performed activities that involved two
to twelve different subjects of stimuli (see Table 1),
while our choice was to increase the number of
sequences of our validation procedure to 19. The last
step of the algorithm merges all the elaborated Gaze-
Point at a given quality level into one single
measure. This step includes all the measures on the
same quality level making it as context-independent
as possible. We could not increase the semantic
dataset any more without making the experimental
activity last for more than 30 minutes for each
person involved. The guidelines show that the
attention focus of testers rapidly decreases after that
amount of time, and this could cause unreliability of
the results. Another known problem is that users
have different visual strategies when they are asked
to perform different tasks on video, such as quality
assessment, summarization or free viewing (Mittal,
et al., 2011). Our paper addresses this issue by
asking to all the observers involved to perform the
same task (quality evaluation). This of course gives
task-dependent results, but also allows excluding the
presence of task bias between different samples
because the whole set of data was obtained by
involving the participants in the same quality
assessment task.
6 CONCLUSIONS AND FUTURE
DEVELOPMENTS
Our work is placed in the Multimedia Quality of
Experience field of research. We propose a new
algorithm to study the HVS behavior when subject
to different quality level video under the hypothesis
that a low quality video is more challenging for the
HVS than a high quality one. Our approach is based
on an Eye-Tracking experimental test. We proposed
an algorithm that included a grouping phase of the
data and a proximity analysis. Its core is the Gaze-
Point weighting process, which returns a measure
that is directly related to the distance of a Gaze-Point
to the whole set of peers on the same map. The
proposed algorithm, taking into account the distinct
results gathered by the different testers, returns a
score for each video that is the average weight of
each Gaze-Point. We noticed that the proposed
metric is inversely proportional to the user perceived
quality, meaning that the HVS seems to act
regularly. This behavior can be explained by our
initial hypothesis: on high quality level stimuli the
eye has more chances to gaze around the screen,
while on low quality stimuli it is more difficult for
the eye to understand the subject of the video, which
leads to a more concentrated set of Gaze-Point, as
the results of our experiments confirm.
The next step of our work will be to challenge
this algorithm with different (not only lossy
VISAPP2014-InternationalConferenceonComputerVisionTheoryandApplications
468

compression) quality impairment techniques (such
as transmission-related ones) and different video
resolutions, in order to expand the field of
application of the algorithm, by considering other
types of loss of quality and user experience devices
(such as mobile devices).
REFERENCES
Albanesi, M. G. & Amadeo, R., 2011. Impact of Fixation
Time on Subjective Quality Metric: a New Proposal
for Lossy Compression Impairment Assessment.
World Academy of Science, Engineering and
Technology, Volume 59, pp. 1604-1611.
Boulos, F., Chen, W., Parrein, B. & Le Callet, P., 2009. A
new H.264/AVC error resilience model based on
Regions of Interest. Seattle, WA, Packet Video
Workshop. 17th International, pp. 1-9.
Cerf, M., Frady, P. E. & Koch, C., 2009. Faces and text
attract gaze independent of the task: Experimental data
and computer model. Journal of Vision, 9(12), pp. 1-
15.
Chamaret, C. & Le Meur, O., 2008. Attention-based video
reframing: Validation using eye-tracking. Tampa, FL,
Pattern Recognition. 19th International Conference on,
pp. 1-4.
Engelke, U. et al., 2013. Comparative Study of Fixation
Density Maps. IEEE Transactions on Image
Processing, 22(3), pp. 1121-1133.
Gulliver, S. R. & Ghinea, G., 2009. A Perceptual
Comparison of Empirical and Predictive Region-of-
Interest Video. IEEE Transactions on Systems, Man,
and Cybernetics, part A: Systems and Humans, 39(4),
pp. 744-753.
Hadizadeh, H., Enriquez, M. & Bajic, I., 2012. Eye-
Tracking Database for a Set of Standard Video
Sequences. IEEE Transactions on Image Processing,
21(2), pp. 898-903.
Huynh-Thu, Q. et al., 2011. Study of Rating Scales for
Subjective Quality Assessment of High-Definition
Video. IEEE Transactions on Broadcasting, 57(1), pp.
1-14.
Kunze, K. & Strohmeier, D., 2012. Examining subjective
evaluation methods used in multimedia Quality of
Experience research. Yarra Valley, Australia, Quality
of Multimedia Experience (QoMEX). Fourth
International Workshop on, pp. 51-56.
Laghari, K. u. R., Issa, O., Speranza, F. & Falk, T. H.,
2012. Quality-of-Experience perception for video
streaming services: Preliminary subjective and
objective results. Hollywood, CA, Signal &
Information Processing Association Annual Summit
and Conference (APSIPA ASC), Asia-Pacific, pp. 1-9
Lai, Y.-K., Lai, Y.-F., Dai, C.-H. & Schumann, T., 2013.
Perceptual video quality assessment for wireless
multimedia applications. Las Vegas, NV, Consumer
Electronics (ICCE), IEEE International Conference
on, pp. 496-497.
Le Meur, O., Ninassi, A., Le Callet, P. & Barba , D., 2010.
Overt visual attention for free-viewing and quality
assessment tasks: Impact of the regions of interest on a
video quality metric. Signal Processing: Image
Communication, 25(7), pp. 547-558.
Le Meur, O., Ninassi, A., Le Callet, P. & Barba, D., 2010.
Do video coding impairments disturb the visual
attention deployment?. Signal Processing: Image
Communication, 25(8), p. 597–609.
Lee, J.-S. & Ebrahimi, T., 2012. Perceptual Video
Compression: A Survey. IEEE Journal of selected
topics in signal processing, 6(6), pp. 684-697.
Linying, J., Ren, J. & Li, D., 2012.
Content-based image
retrieval algorithm oriented by users' experience.
Melbourne, Australia, Computer Science & Education
(ICCSE), 7th International Conference on, pp. 470-
474.
Liu, H. & Heynderickx, I., 2011. Visual Attention in
Objective Image Quality Assessment: Based on Eye-
Tracking Data. IEEE transactions on Circuits and
Systems for Video Technology, 21(7), pp. 971-982.
Mittal, A., Moorthy, A., Geisler, W. & Bovik, A., 2011.
Task dependence of visual attention on compressed
videos: point of gaze statistics and analysis. San
Francisco, CA, Human Vision and Electronic Imaging
XVI.
Ninassi, A., Le Meur, O., Le Callet, P. & Barba, D., 2007.
Does where you Gaze on an Image Affect your
Perception of Quality? Applying Visual Attention to
Image Quality Metric. San Antonio, TX, s.n., pp. 169-
172.
Seeling, P. & Reisslein, M., 2012. Video Transport
Evaluation With H.264 Video Traces. IEEE
Communications Surveys and Tutorials, 14(4), pp.
1142-1165.
University of Hannover, March 2011. [Online]
Available at: ftp://ftp.tnt.unihannover.de/pub/svc/
testsequences/
Wang, Z., Bovik, A. C., Sheikh, H. R. & Simoncelli, E. P.,
2004. Image quality assessment: from error visibility
to structural similairty. IEEE Transaction on Image
Processing, 14(4), pp. 600-612.
Winkler, S. & Mohandas, P., 2008. The Evolution of
Video Quality Measurement: From PSNR to Hybrid
Metrics. IEEE Transactions on Broadcasting, 54(3),
pp. 660-668.
xiph.org, March 2011. Xiph.org Video Test Media.
[Online] Available at: Xiph.org Video Test Media
Youlong, F., Cheung, G., Tan, W.-t. & Ji, Y., 2012. Gaze-
Driven video streaming with saliency-based dual-
stream switching. San Diego, CA, s.n., pp. 1-6.
Zhu, H., Han, B. & Ruan, X., 2012. Visual saliency: A
manifold way of perception. Tsukuba, Japan, 21st
International Conference on Pattern Recognition
(ICPR), pp. 2606-2609.
ANewAlgorithmforObjectiveVideoQualityAssessmentonEyeTrackingData
469
