
A2MO and ETREOSys
Analyzing, Modeling and Validation of Enterprise Training Programs
Fod´e Tour´e, Mouna Selmi and Esma A¨ımeur
Department of Computer Science and Operations Research (DIRO), Universit´e de Montr´eal, Montreal, Canada
Keywords:
Evaluation, Enterprise Training, Business Process Management, Business Activity Monitoring, Agile
Management, Return On Investment, Optimization, Machine Learning Algorithms.
Abstract:
Organizations and public authorities invest substantial sums in training, but rarely have data indicating the re-
sults of this investment. Because of the difficulties related to existing models, to the lack of valid instruments
and workable models, only a few organizations evaluate their training project in depth.
In this paper, we propose an approach of training project evaluation, based on Business Process Management
(BPM). This approach consists in Analyzing the needs, process Modelling, Monitoring the project progress and
ensuring the expectation of the objectives, Optimizing the global and personal yield by a series of simulation
(A2MO method). To facilitate the understanding and the use of A2MO, we develop a Business Process Man-
agement System named ETREOSys (Enterprise TRaining program Evaluation and Optimization System).
A2MO ensures the alignment between training activities and enterprise business objectives. It allows training
project monitoring, calculating tangible and intangible benefits of training (without additional costs). It also
allows making a training projects classification according to criteria bound to enterprise and employees, to
optimize training activities in order to answer the enterprise objectives and employees needs.
1 INTRODUCTION
Individual and collective skills are the most important
assets for an organization. They determine the pro-
ductivity, competitiveness and ability to adapt and to
be proactive in an uncertain economic environment.
A report published, in 2011, by the American Soci-
ety of Training & Development (ASTD) reveals that
Businesses in the United States spent $171.5 billion
on employee learning in 2010, 26% more than in
2009 (Green and McGill, 2011). The report confirms
that, despite economic challenges, organizations un-
derstand that a highly skilled workforce is a strategic
differentiator and they are willing to invest in the de-
velopment of their employees skills.
On the other side, a study led by ASTD and the In-
stitute for Corporate Productivity (i4cp), revealed that
the five-level Kirkpatrick/Phillips model (Kirkpatrick
and Kirkpatrick, 2006; Phillips and Phillips, 2003) of
learning evaluation is the most common practice. Ac-
cording to this study, the barriers that prevent com-
panies from using all the evaluation levels of Kirk-
patrick/Phillips’model are: the difficulty in isolating
learning as a factor that has an impact on corpo-
rate results; the lack of a useful evaluation system
within the learning management system; the lack of
standardized data to properly compare across train-
ing functions (Patel, 2010).
Thus, to bring a solution to enterprises needs, we
present, in this paper, an approach of training evalua-
tion and optimization, based on BPM.
BPM has become a critical success instru-
ment to improve the enterprise overall performance
(Mutschler and Reichert, 2013). The success regis-
tered by BPM solutions in managing enterprise pro-
cesses has inspired us in using it to manage train-
ing activities. Such a scenario supposes considering
training activities as being business process. In fact,
the design and execution of a training program sup-
poses a set of steps that go from the formulation of a
demand up to the implementation of new skills. All
these stages, enumerated by chronological order, con-
stitute a process as any other business process, and
can lead to a capital gain if everything took place cor-
rectly. So, they can be managed using BPM.
This paper presents a method of training project
management (A2MO method) based on BPM: going
from design to optimization, via the evaluation of the
financial and non financial yield.
In the following, we present, in section 2, the
Kirkpatrick/Phillips model for evaluating training
programs in organizations, the advantages and disfa-
310
Touré F., Selmi M. and Aïmeur E..
A2MO and ETREOSys - Analyzing, Modeling and Validation of Enterprise Training Programs.
DOI: 10.5220/0004558503100316
In Proceedings of the 15th International Conference on Enterprise Information Systems (ICEIS-2013), pages 310-316
ISBN: 978-989-8565-60-0
Copyright
c
2013 SCITEPRESS (Science and Technology Publications, Lda.)

vors of this model. Section 3 will be dedicated to a
brief presentation of A2MO method and ETREOSys.
In sections 3.1 and 3.2, we present, in details, the two
first steps of the A2MO method and ETREOSys’ cor-
responding modules. The section 4 is reserved for the
conclusion.
2 THE FIVE-LEVEL
KIRKPATRICK/PHILLIPS
MODEL
Kirkpatrick’s model began in 1959, with a series of
four articles on the evaluation of training programs
in the journal ”Training and Development”. These
four articles defined the four levels of evaluation that
would later have a significant influence on corporate
practices (Kirkpatrick and Kirkpatrick, 2006).
Level 1 - Students reaction
How did the trainees react after the training? Did they appre-
ciate it? Are they satisfied? What they thought and felt about
the training?
Level 2 - Learning
What they learnt after the training? What knowledge, skills
and/or attitudes have been acquired? Have educational objec-
tives been achieved? The resulting increase in knowledge or
capability.
Level 3 - Behavior
Do the trainees use what they learned in training at their
workstations? What new professional behaviors have been
adopted?
Level 4 - Results
What is the impact of the training on the results of the com-
pany? Example: decrease of the rate of absenteeism, occu-
pational accidents, growth of turnover, the productivity, cus-
tomer satisfaction, etc. The effects on the business or environ-
ment resulting from the trainee’s performance improvement.
According to Phillips, training yield calculation is
made by means of a process by stages which supplies
a plan detailed for the planning, the collection and
the data analysis, which includes the calculation of
Return On Investment (ROI). So Phillips suggests the
inclusion of a fifth level (Phillips and Phillips, 2003).
Level 5 - Return On Investment
Comparison between the profit obtained from the training and
the training costs. Profits and/or savings realized are they
superior to the total cost of the training (direct and indirect
costs)? Did the training generate a return on investment?
The ROI calculation process begins with a plan-
ning for training evaluation: where objectives are de-
fined and decisions are taken on the way the data will
be collected, treated, and analyzed. The data collec-
tion is made according to the training evaluation lev-
els 1 to 4.
However, in the literature, several criticism are
raised with regard to the Kirkpatrick/Phillips model.
According to Mumma and Thatcher (Mumma and
Thatcher, 2009), the entire notion of the Kirk-
patrick/Phillips model may not truly measure the im-
pact of the learning function on the organization, even
under the most optimistic scenarios. It measures only
the possible impact of isolated training events. Nagle
(Nagle, 2002) reports a series of criticism towards the
ROI calculating process: difficulty to have a faithful
measure, expensive process, complex process, process
that can take up to one year, presence of other factors
(independent from the training) that influence the per-
formance of the organization.
Concerning the methodological problems, Mc-
Cain (McCain, 2004) has established a list of bias
being able to have an impact on the observed results
and of which a professional of the training does not
always think. We can quote the bias of a sample (se-
lection of a non representative sample or too small
one), bias in the interviews, bias of acquiescence or
neutrality according to the presentation of questions.
Thus, to bring a solution to the enterprise needs,
we present, in the following section, an approach of
training yield evaluation, based on the business pro-
cess management.
3 A MODEL OF TRAINING
EVALUATION BASED ON
BUSINESS PROCESS
MANAGEMENT
All performance problem is not a problem of train-
ing, but a judiciously applied training can stimulate
skills and improve the performances of persons in
their jobs. The reality in most enterprises is that they
need to knowhowto calculate and improve the impact
of their spending on training more important on the
enterprise overall performance. When training costs
are considered with a critical eye, many organizations
realize that they simply did not have enough money
to train all employees. They need to focus their train-
ing spending on the roles which are most essential for
the success of the enterprise and which return more
value to the organization. For that purpose, managers
in training and development should collaborate with
A2MOandETREOSys-Analyzing,ModelingandValidationofEnterpriseTrainingPrograms
311
managers to clarify the essential points on which de-
pends the success of the organization, establishing
performance criteria and focusing training on these
criteria. By comparing the performance before and
after training, the value of learning activities can be
calculated on the basis of the impact on the business.
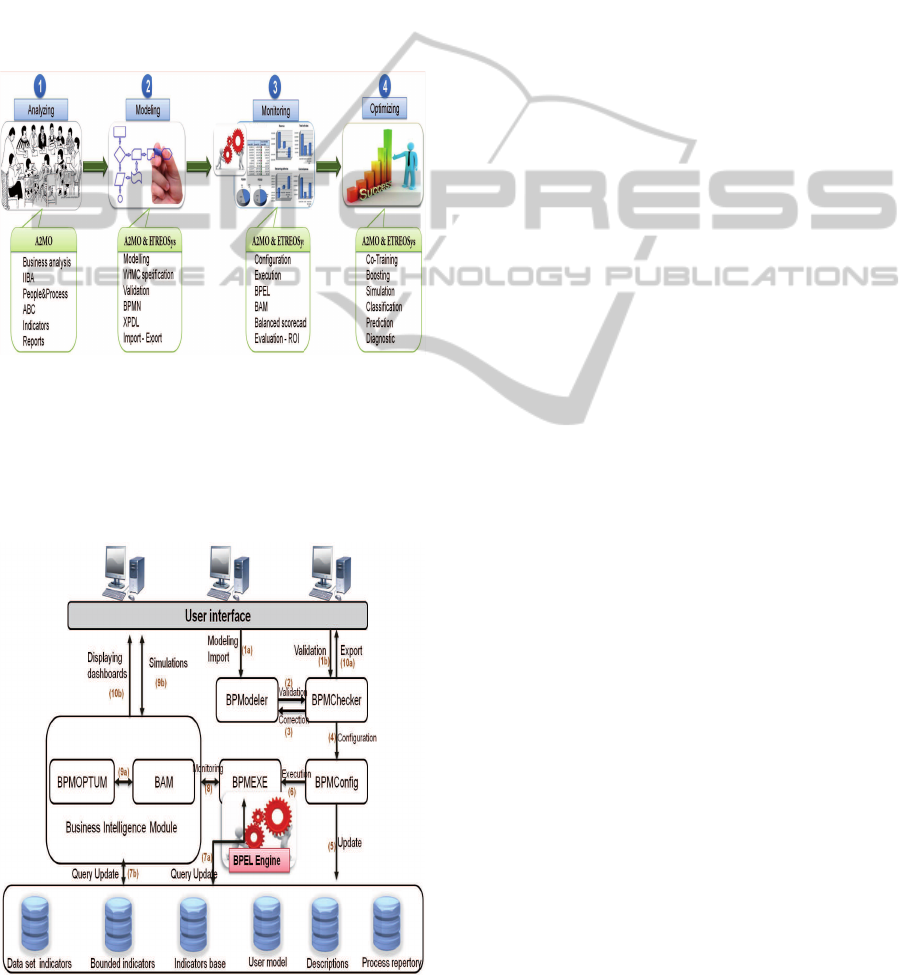
Thus, we propose a four-step approach of enter-
prise training program management. This approach
consists in Analyzing the need, process Modelling,
Monitoring the project progress and guaranteeing the
expectation of the objectives, Optimizing the global
and personal yield by a series of simulation (Fig. 1).
Figure 1: The stages of A2MO method.
To facilitate the understanding and the use of
A2MO, we develop a Business Process Manage-
ment System(BPMS) named ETREOSys (Enterprise
TRaining program Evaluation and Optimization System),
characterized by the following architecture (Fig. 2).
Figure 2: Architecture of our enterprise training processes
management system.
In the sections 3.1 and 3.2, we present the two first
steps of the A2MO method and ETREOSys’ corre-
sponding modules.
3.1 Stage 1 - Analysis
The training in enterprise consists in a series of spe-
cific actions intended to resolve a problem with which
the enterprise is confronted. Thus, the first stage of
A2MO focuses on analyzing the demand for training
and associating it to performance elements of the en-
terprise. This stage is translated by a certain num-
ber of actions such as: conversations of demand ex-
ploration, definition of a change plan, needs anal-
ysis, definitions of the objectives, choice and defini-
tion of performance indicators. Therefore, we use a
business analysis process combining the guide of In-
ternational Institute of Business Analysis (IIBA), the
method ”People&Process” and the method Activity-
Based Costing (ABC method).
IIBA maintains and publishes a referential con-
taining a description of the activities of the busi-
ness analysis. The referential is published as a book
entitled ”A Guide to the Business Analysis Body of
Knowledge (Brennan, 2009)”. This latter provides
a description of a typical business analysis activities
into six chapters: Analysis of enterprise initial sit-
uation; Planning and management of prerequisites,
needs and expectations; Harvest of the information;
Analysis and documentation of needs and expecta-
tions; Communication of information to stakeholders;
Evaluation and validation of the proposed solutions.
The development of systems and their compo-
nents is based on needs description. The needs de-
termination depends on the form and the structure of
the demand. IIBA provides an initial classification of
forms of expression of needs and expectations into six
levels (see IIBA guide (Brennan, 2009)).
The analysis of the current situation produces a
report containing a structured presentation of har-
vested information and details of the objectives, the
means and available resources, improvement propos-
als, risks and potential impacts. Managers evaluate
the strengths, weaknesses, opportunities and risks for
the organization.
A business process model is therefore based on the
identification of key elements in the conduct of affairs
such as endogenous and exogenous factors directly
acting on the fluctuations of the functioning mode of
the enterprise. This last point solves the problem of
isolation of training impacts on the overall perfor-
mance of the organization (highlighted in the Kirk-
patrick/Phillips model, see section 2). Indeed, using
the process of IIBA, we define the indicators related
ICEIS2013-15thInternationalConferenceonEnterpriseInformationSystems
312

to the expected effects of the training and the factors
that may influence these effects. This means that we
also define the situations and indicators that can pro-
duce the same effects as training.
The second method that we use at this stage is the
”People&Process” method (Briol, 2008). The man-
agers fixe the high-level objectives according to their
visions. These objectives are then formulated in the
lower level objectives. An achieved goal answers the
criteria of successes expressed with indicators offer-
ing a means of measuring and verifying the gaps to
the initially set values. The Objectives formalized in
dashboards are used in the design and supervision of
business processes.
The translation of an objective in indicators form
depends on its formulation. For example, the objec-
tive ”... make more results next year ...” could pos-
sibly be subject to diverse interpretations. Generally,
these interpretations are reflected in several indicators
distributed among the entities or functions of the orga-
nization such as finance function, production, human
resources, etc. There are two types of performance
indicators in a cause and effect relationship:
• Indicators directly allocated to outcome of actions
already executed such as financial or social indi-
cators of the enterprise.
• Indicators influencingor controlling the indicators
of the first category. For example, the ”number
of products sold” directly influences the indicator
”turnover”.
Furthermore, there are two categories of indicators:
qualitative indicators such as social values and quan-
titative indicators taking a digital or symbolic form.
The indicators, by measuring performance of the
organization, play an important role in verifying its
alignment with enterprise strategy. They are deduced
either directly from objectives or key success factors
influencing the strategy success.
In A2MO, the description of the training intan-
gible yield is based on the values of qualitative in-
dicators. As these indicators are directly linked to
some objectives, then the reached (or the not reached)
of these objectives will be deducted from the values
of the corresponding indicators. The same reasoning
applies to the calculation of financial yield of train-
ing. This yield is calculated by mathematical formu-
las (cost/benefit ratio), after deducting costs associ-
ated with quantitative indicators values. For that pur-
pose, we use the ABC method (Activity-Based Cost-
ing).
The ABC method allows to determine costs as-
sociated with a set of business activities prior to a
change and the gain due to the change (Richard Or-
wig and Flather, 2012).
The ABC method considers the goods and ser-
vices as objects of costs in exchange for a definite
and organized effort. This method is structured by an-
swering three questions: What is spent? How it was
spent? What has been produced?
The activity concept is at the center of ABC
method. An activity is a set of elementary tasks per-
formed by an individual or a group,appealing to spe-
cific set of cognitive capacities (knowledge, know-
how, skills), more or less homogeneousfrom the point
of view of their performance behavior. An activity is
described using an action verb followed by an object
(ex. make something). Each activity has a recogniz-
able production (an output), one or more customers
and uses identified resources. The impacts of an ac-
tivity, on the growth of the enterprise, can be quantifi-
able or of social order.
The performances of the organization depend di-
rectly on resources consumed at the origin of the
costs. The resources cost takes into account the ex-
penses associated to the human effort, raw materials,
equipments of production, indirect costs of produc-
tion and to the overheads. The inductors of resources
are used in the affectation of the costs in the activ-
ities by associating the resources with the activities.
The inductors of resources are expressed in cost per
minute of activity. It can be also expressed by qualita-
tive values (qualitative indicators) spread over several
periods of observation. Each type of resource used
in an activity becomes a cost element. The cost el-
ements associate an activity with an inductor which
measures the utilization level of these elements in the
activity. The ABC method offers the means to ver-
ify the resources consumption of business processes
in the organization.
This first stage of A2MO supplies the process
model, the information required to configure this
model, the initial values of indicators. It ensures the
alignment of the training program to the growth strat-
egy of the enterprise.
At the end of this stage, we shall have isolated all
the indicators associated to the problem. As example
of indicators we can quote: cost of the delivery delay,
the number of item (or service) delivered late, accu-
mulated delay ....
We also isolate the indicators which can influence
those quoted previously (with or without training pro-
gram). For example: rate of staff turnover, rate of
employees absenteeism, number of absence per em-
ployee, cause of absence, cost of the rotation, cost
engendered by absenteeism, cost of absence per em-
ployee, degree of job satisfaction, degree of personal
initiative, staff productivity, level of collaboration be-
tween employees within the enterprise, level of col-
A2MOandETREOSys-Analyzing,ModelingandValidationofEnterpriseTrainingPrograms
313
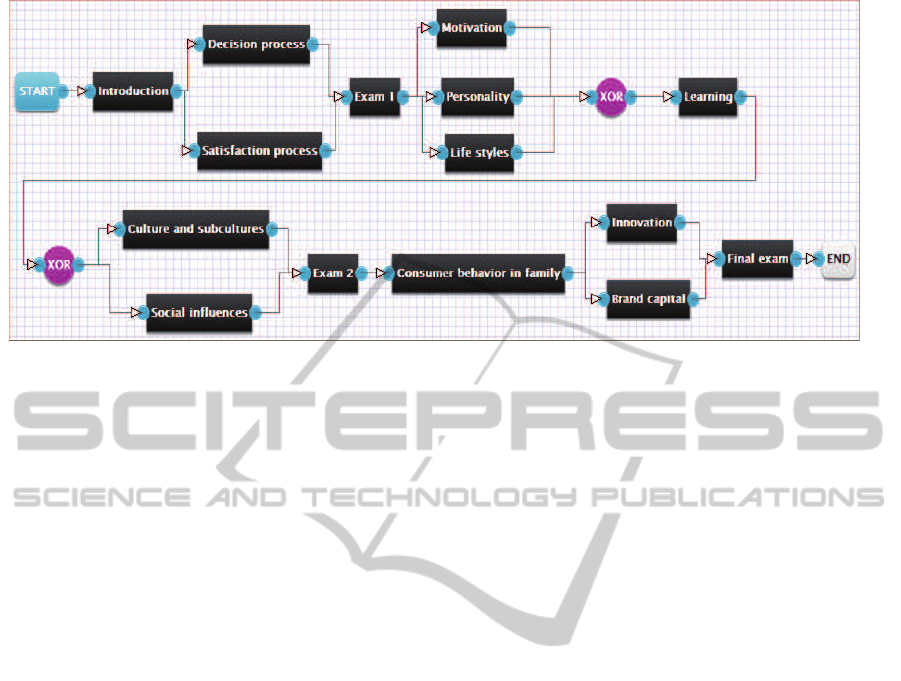
Figure 3: A possible process model for training planning ”Consumer behavior”.
laboration per employee ....
In the next sections, we present the second stage of
A2MO. This stage is strongly related to ETREOsys.
3.2 Stage 2 - Modelling
This stage is supported by modules BPModeler and
BPMChecker of ETREOSys. To model a business
process, BPModeler uses graphic objects developed
by Workflow Management Coalition (WFMC, 1999).
In this modelling language, we use two object types:
node and flow. The nodes are classified in two cate-
gories: task and choice (condition). A task, graphi-
cally represented by a rectangle, represents the work
to be made to achieve some objectives. A choice,
graphically represented by a circle, is used to build
conditional structures. A flow links two nodes in
graph and is graphically represented by an arrow.
The use of invalid process models (bad combina-
tions the objects) leads to syntactic errors. Semantic
errors happen because of the non-compliance (lack of
strategic alignment) at the expected business needs.
For checking the syntactic validity, we analyze the
structure of the process graph. In order to insure the
structural validity of process models, we use the hy-
brid algorithm of Tour´e et al. (Tour´e et al., 2008).
On the other hand, to check the semantic valid-
ity, we need to analyze the information treated by the
tasks and the behavior of the latter (if the first stage of
A2MO, see section 3.1, is made with precaution, the
semantic errors will be avoided).
For the training project management, there are at
least two process models: the process model related
to training planning and the process model related
to the stages of data collection and training perfor-
mance evaluation.
The training planning is a graphical representation
of the training organization (course outline). To illus-
trate this concept, let us take the example of an enter-
prise which would like to improve the performances
of its customers service department. For that purpose,
the enterprise would like that the employees of this
department can make a complex analysis of consumer
behavior and communicate results to managers and
strategic advisors. This means that employees must
be trained on consumer behavior. Figure 3 shows a
process model of the planning of this training.
It is possible to have more granularity depending
on the task (for example, there might be a process
model corresponding to the decomposition of the ac-
tivity Decision process (see Fig 3). Ditto for the ac-
tivity Perception (see Fig 3)).
In A2MO, we associate to this graph (see Fig 3):
the actors of each activity and their roles, the descrip-
tion of incoming and outgoing data, the temporal as-
pect and the performance indicators related to train-
ing (see section 3.1). As indicators, we can quote: av-
erage emotional state by learner, average emotional
state by training session, general emotional state by
training, satisfaction of the organization with regard
to the training program, Employees’ satisfaction with
regard to the content, satisfaction towards the trainer,
relevancy of perception, the usefulness of training,
training capacity to reach enterprise objectives, the
notes of the examinations, the average score of the
learning....
The planning of the collection and training evalu-
ation is a representation of the steps of collecting in-
formation before, during and after the training (Figure
4). In A2MO, for each step (activity of the process
in the Figure 4), we define the means of collection,
dates, the objectives, the actors and the corresponding
indicators. All these informations are kept in ETRE-
OSys to facilitate the management of the training pro-
ICEIS2013-15thInternationalConferenceonEnterpriseInformationSystems
314
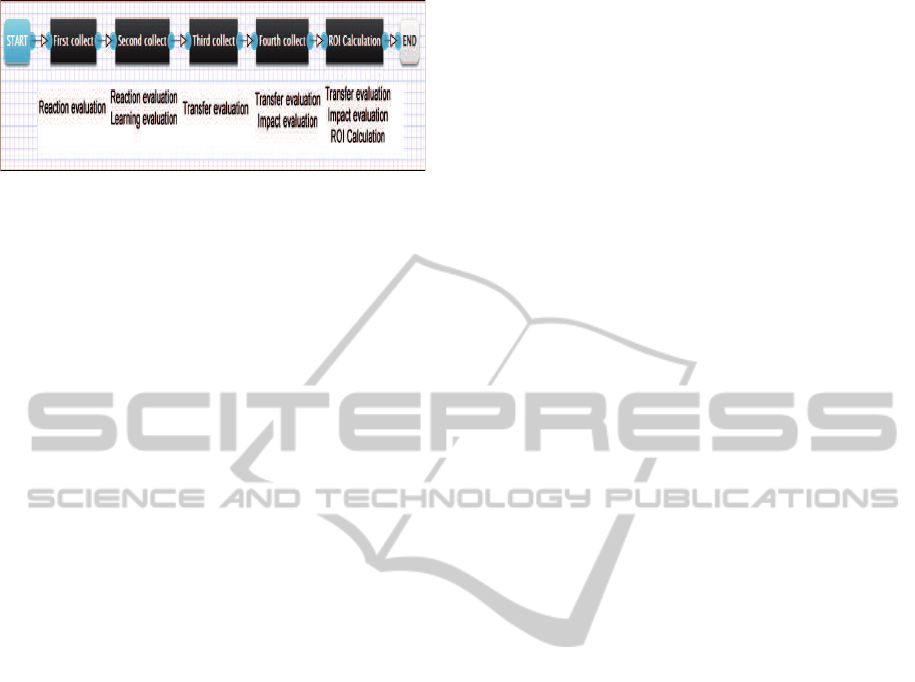
Figure 4: A possible process model for training evaluation
planning.
gram. Consequently, besides the already mentioned
indicators, we define other indicators allowing to esti-
mate the achievement of the training objectives in the
enterprise. These indicators relate to the employees’
lives in the enterprisebefore and after the training. We
can quote as indicators: increase of the innovation de-
gree of an employee, the increasing of the innovation
degree in the enterprise generally, the improvement of
the product quality, work climate, the meetings num-
ber of the committee, customers loyalty, the profit by
employee....
For the particular case of the formation modeled
in Figure 3, we must take into account the influence
of environmental factors on consumer behavior such
as culture, reference groups, social class or family.
Therefore, it is necessary to define indicators allowing
to isolate the influence of these external elements.
The process model, related to the evaluation, fixes
periods of gathering information order to proceed
with of evaluations and simulations leading to predict
the results tendency. These last informationwill allow
to make decisions leading to the success of the train-
ing program. Through to the indicators, the process
model associated with the evaluation will allow to re-
act in real time to avoid any situation leading to the
failure of training (non-realization of the objectives).
For that purpose, it is just enough to compare the ini-
tial values, the collected values and the expectations
of the enterprise.
The first and second stages of A2MO are impor-
tant because they insure a best management of the
training program and the basis for the success of the
stages 3 and 4.
3.3 Stage 3: Monitoring
This stage of A2MO consists in controlling the
progress of the processes. A control based on precise
indicators and relevant in order to have dashboards al-
lowing making quickly the good decisions. The dash-
board of the training has to cover two big dimensions:
the efficiency and the efficacy. The training process
said to be efficient if it gives the maximum of results
by consuming the minimum of resources and said to
be effective if it gives the expected results.
The dashboard of the efficiency of the training
will be composed of indicators of consumption of re-
sources and of activities output allowing measuring
the efficiency of each of the three stages of the pro-
cess, as well as the general efficiency of the train-
ing project. The following indicators allow building
the dashboard of the efficiency of a training program:
time dedicated to the identification and to the needs
analysis (combined time of the employee, his supe-
rior and the training manager), perceived usefulness
of the training/time dedicated, the gap enters what the
employee masters and what he has to master, the ad-
equate level of training to reduce or cancel the gap
(beginner, intermediate, advanced), mode of training
(external, intern, coaching, e-learning, tutoring, etc.),
time to design and the elaboration of the program, etc.
These indicators can be analyzed by sex, seniority, so-
cial status, type of training, or operational unity (ser-
vice, department, store, etc.). The dashboard of the
effectiveness focuses either on the effectiveness of a
training, or on the global effectiveness of the training
system. Its structure includes the model of training
evaluation and contains more indicators than the effi-
ciency dashboard.
This stage allows us to calculate the tangible and
intangible training benefits (without additional costs)
by using indicators values.
3.4 Stage 4: Optimization
In this stage of A2MO, we use machine learning algo-
rithms (example, logistic regression, neural networks
or support vector machines) to classify training activ-
ities according to defined criteria (example, financial
yield) and to do simulations to increase the efficiency
and efficacy of training activities. To do that, we re-
alize a pretreatment on the indicator values to have
a data set for a supervised learning algorithm, unsu-
pervised or semi-supervised. The stages of monitor-
ing and optimization constitute our module of busi-
ness intelligence because they allow: improving per-
sonal efficiency, speeding up the process of decision
making, increasing organizational control, encourag-
ing exploration and discovery on the part of the deci-
sion maker, speeding up problem solving in an organi-
zation, facilitating interpersonal communication, pro-
moting learning or training, generating new evidence
in support of a decision, creating a competitive ad-
vantage over competition, revealing new approaches
to thinking about the problem space, and helping au-
tomate managerial processes.
When the training evaluation process is com-
pleted, the enterprise training programs will be clas-
A2MOandETREOSys-Analyzing,ModelingandValidationofEnterpriseTrainingPrograms
315

sified in two categories: profitable and unprofitable.
Hence, we will have a dataset D
n
that can be used in
training of a machine learning algorithm.
D
n
= {Z
1
, Z
2
, . . . , Z
n
}
∀i ∈ {1, 2, . . . , n}, Z
i
= (x
(i)
, y
(i)
) with x
(i)
∈ R
d
and y
(i)
∈
{0, 1}
Each Z
i
is associated to a particular training pro-
gram in the enterprise. The x
(i)
are the indicators
(see 3.1 and 3.2) related to the training. Hence, we
can have indicators which take numerical values (for
example,number of committee meeting) and others
that take categorical values (for example, climate at
work). y
(i)
represents the training class (profitable or
unprofitable), profitable corresponds to 1 and its op-
posite corresponds to 0. n is the number of completed
training program and d is the number of indicators.
It is obvious that to use this data set with a ma-
chine learning algorithm, it is necessary to make a
pretreatment to standardize or normalize the inputs
x
(i)
.
In our approach, the purpose of the classifica-
tion is to be able to predict the achievement or none
achievement of the training objectives by observing
only the indicators behavior. Furthermore, we must
be able to determine the indicators which have more
weight in the realization of training objectives. That’s
why we may use a parametric machine learning algo-
rithm like logistic regression, neural networks or the
support vector machines.
The optimization consists of a simulation allow-
ing guiding the training process towards objectives
achievement. To do this we may use semi-supervised
learning.
4 CONCLUSIONS
The advantages obtained through our approach can be
seen from two angles. In the domain of business pro-
cess management, we add a new category of business
process and extend BPMS by adding the validation
pre-execution (through ETREOSys).
Concerning the evaluation of enterprise training,
we propose a complete approach of training project
management facilitating decision-making and the cal-
culation of the tangible and intangible profits.
With regard to the existing training evaluation
models, we propose A2MO method. This approach
consists in Analyzing the need, process Modelling,
Monitoring the project progress and guaranteeing the
expectation of the objectives, Optimizing the global
and personal yield by a series of simulation. We add
a particular level of diagnostic (classification and op-
timization) allowing to understand the dysfunctions
related to the attainment or not attainment of training
objectives. Our approach ensures the training activi-
ties alignment with business needs and allows the ROI
calculation without additional investment.
REFERENCES
Brennan, K. (2009). A guide to the Business Analysis Body
of Knowledge (BABOK guide), version 2.0. Interna-
tional Institute of Business Analysis.
Briol, P. (2008). Ing´enierie des processus m´etiers: De
l’´elaboration `a l’exploitation. Lulu.com.
Green, M. and McGill, E. (2011). State of the industry,
2011. Astd’s annual review of workplace learning and
development data, American Society of Training &
Development (ASTD).
Kirkpatrick, D. L. and Kirkpatrick, J. D. (2006). Evalu-
ating Training Programs: The Four Levels (3rd Edi-
tion). Berrett-Koehler Publishers, 3rd edition.
McCain, D. (2004). Evaluation basics. ASTD, 1st edition.
Mumma, S. and Thatcher, C. (2009). The learning profit
chain ”connecting learning investments to financial
performance”. Corporate University Xchange.
Mutschler, B. and Reichert, M. (2013). Understanding
the costs of business process management technol-
ogy. In Glykas, M., editor, Business Process Manage-
ment, Studies in Computational Intelligence, pages
157–194. Springer Berlin/Heidelberg.
Nagle, B. (2002). Roi gives a way to roe. Candian HR
Reporter,, 15(13):7.
Patel, L. (2010). Overcoming barriers and valuing eval-
uation. Learning Circuits - ASTD’s Source for E-
Learning. American Society for Training & Devel-
opment.
Phillips, J. J. and Phillips, P. P. (2003). Using action plans
to measure roi. Performance Improvement, 4:24–33.
Richard Orwig, J. B. and Flather, W. (2012). Marrying busi-
ness activity modeling with activity-based costing for
measuring systems’ cost savings. In AMCIS.
Tour´e, F., Ba¨ına, K., and Benali, K. (2008). An efficient
algorithm for workflow graph structural verification.
In Meersman, R. and Tari, Z., editors, OTM Confer-
ences (1), volume 5331 of Lecture Notes in Computer
Science, pages 392–408. Springer.
WFMC (1999). Workflow management coalition interface
1: Process definition interchange process model.
ICEIS2013-15thInternationalConferenceonEnterpriseInformationSystems
316
