
Electronic Exercises for the Metra Potential Method
Markus Siepermann
1
, Christoph Siepermann
2
and Richard Lackes
1
1
Department of Business Information Management, Technische Universität Dortmund, 44221, Dortmund, Germany
2
Faculty of Business and Computer Science, Albstadt-Sigmaringen University, 72488, Sigmaringen, Germany
Keywords: Automatic Marking, e-Learning, Intelligent Tutoring Tool, Metra Potential Method, Self Assessment.
Abstract: The metra potential method as a special precedence diagram method is used in many scientific disciplines,
e.g. in project management, date- and capacity-planning. It is a combination of graphical modelling and cal-
culations for the duration of projects/processes. In this paper, we introduce an e-learning system that pro-
vides exercises concerning the metra potential method. Students can freely model the diagrams without re-
strictions and do the necessary calculations. Then, their solutions are marked automatically on the basis of a
reference solution. The calculations are based on the modelling, thus consecutive faults between modelling
and calculation have to be considered as well as consecutive faults only during the calculation.
1 MOTIVATION
Nowadays, though nearly everything can be done
via the Internet, students do not want classic lectures
to be replaced by electronic ones (Bruns 2002, p.
19); (Glowalla et al., 2004, p. 58). Instead, they
prefer that classic lectures be enriched with e-
learning aspects, especially with electronic exercises
(Glowalla et al., 2004, p. 61). The reason for this is
obvious: Students can practice whenever and wher-
ever they want to without being bound to lectures
but they still have the opportunity to participate.
However, not every kind of exercise is indeed use-
ful. The most popular exercises consist of multiple
choice, true-false questions, jumbled sentences and
fill-in-the-blank. These kinds of exercises are easy to
create, to administer and to mark automatically. But
the disadvantage of these kinds of exercises is evi-
dent: The questions contain the correct answer in a
more or less apparent way so that students who do
not know the correct answer are able to guess (Kö-
nig, 2001, p. 112). Instead, e-learning exercises
should be sophisticated and interactive (see Haack
2002, p. 129) so that students have to find the an-
swer on their own by using the learned approaches
and their own knowledge. Therefore e-learning ex-
ercises should not prescribe the problem-solving
procedure. Instead, they should allow many degrees
of freedom to get to the right answers. Limitations
should only appear if they are necessary to imple-
ment online exercises. Furthermore, e-learning exer-
cises should be marked automatically, so that the
students immediately get feedback concerning their
given answer (see Bolliger and Martindale 2004, p.
62); (Issing 2002, p. 162). In summary, e-learning
exercises should adhere to the following three re-
quirements (see Siepermann 2005, p. 1751):
The exercises are more complex than multiple
choice, fill-in-the-blank, etc.
They allow students to really apply their new
knowledge.
They give feedback within a predictable time.
Because there are a huge number of different
kinds of exercises, it is impossible to build one sys-
tem for all kinds. But certain kinds of exercises
resemble each other. In different scientific disci-
plines, graphical modeling is used, like skeletal
formulas in chemistry, UML in computer sciences,
event-driven process chains in business sciences,
etc. Another kind of exercise consists of mathemati-
cal calculations that appear in mathematics as well
as in physics, business sciences, engineering, etc.
The general structure of such exercises is always the
same: Concerning the graphical modeling, usually a
textual description of the task is given. Then, stu-
dents have to model with a set of vertices and edges
of different kinds. Concerning the mathematical
calculations, a textual description is also given. Then
students have to calculate a certain number of val-
ues. Usually, there is more than one way to come to
the correct solution. Thus, the calculation is not
necessarily a sequential step-by-step calculation but
435
Siepermann M., Siepermann C. and Lackes R..
Electronic Exercises for the Metra Potential Method.
DOI: 10.5220/0004421504350442
In Proceedings of the 15th International Conference on Enterprise Information Systems (ICEIS-2013), pages 435-442
ISBN: 978-989-8565-60-0
Copyright
c
2013 SCITEPRESS (Science and Technology Publications, Lda.)

possibly a net of several calculation steps where
there are several alternative possibilities to arrive at
the result.
In this paper, we will present an e-learning sys-
tem for the so-called metra potential method, a spe-
cial kind of the precedence diagram method that is
often used within project management or date and
capacity planning. This method consists of a graph-
ical representation as well as of a calculation scheme
so that both kinds of generic exercises mentioned
above have to be combined in one e-learning system.
2 LITERATURE REVIEW
Having a look at the vastness of e-learning literature,
we can mainly distinguish the following streams:
First, multi-media based e-learning systems were
designed that used the rather new concept of hyper-
text and multimedia elements like videos and anima-
tions. Already at this stage, simple exercise forms
like multiple-choice, fill-in-the-blank, etc. were
implemented and integrated into these systems. The
predominant medium was the CD-ROM because
Internet connections were too slow and only a few
students really used the Internet.
Many authors analysed the success of e-learning
when it is used instead of, and in addition to, classic
teaching. There are a huge number of empirical
studies showing that e-learning, in addition to classic
teaching, is a benefit to the learner. In addition, they
are working out the key factors of successful and
satisfactory e-learning (e.g. Sun et al., 2008).
When the Internet came into the focus of re-
search, many authors designed e-learning systems
for the administration of students and classrooms,
learning material like lecture notes and recordings,
additional material and also exercises, but still exer-
cises on a quite simple level. Often, the technical
aspect of integrating new media was in the focus of
research. E.g. Higgins et al. 2007 gives an overview
of just the literature about whiteboards. Well-known
platforms like Moodle, OpenUSS, Blackboard (for-
merly known as WebCT) emerged from this kind of
research. Up to just a few years ago, those platforms
were the focus of research (e.g. Brusilovsky et al.,
2005).
Thus, creating e-learning systems has a long tra-
dition. Already in 1987, Wenger presented a refer-
ence model for intelligent tutoring systems that was
used and enlarged by several other authors (e.g.
Brusilovsky 1992, p.27 et sqq.). Several authors
investigated the design and implementation of math-
ematical exercises. Patel & Kinshuk 1996 first pre-
sented an e-learning framework for mathematical
calculations. They provided exercises for physical
equations with multiple possible ways of solving.
Siepermann & Lackes 2007 enlarged this approach
for the net requirements calculation to a more com-
plex and periodical calculation. Their tool does not
prescribe any problem-solving procedure. Students
are completely free concerning their calculations.
Other applications were designed for the logistics
cost accounting and the classic cost accounting (Sie-
permann and Siepermann, 2008).
Other authors like Higgins et al. 2002, Higgins et
al. 2005 or Saikkonen et al. 2002 are concentrating
on exercises for programming. This is a very diffi-
cult task because already the question as to whether
a program stops is impossible to be solved. To check
the correctness, those programming exercise tools
usually provide black box tests and syntax checks so
that many both wrong and correct programs can be
identified.
Starting with a framework for e-assessments
(Higgins
et al., 2002), graphical modeling has also
come into the focus of research. Thomas 2004 pre-
sented an idea concerning how to mark diagrams for
a quite specialised application. Waugh et al. 2004 is
based on this approach but does not describe pre-
cisely how the method exactly works. Instead, dif-
ferent results of experiments with their system are
presented (Thomas et al., 2005). Siepermann 2005
introduced the concept of automatically marking
graphical models by covering the student solutions
with correct parts of the reference solution and
wrong parts of already marked student solutions, so-
called patterns. Unrecognised parts of the student
solutions have to be corrected by instructors. Then,
those parts can be used as part solutions during the
marking of other student solutions. Thomas et al.
2006 also mentioned the usage of patterns. In 2008,
they switched from ER-diagrams to sequence dia-
grams (Thomas et al., 2008). In Siepermann et al.
2008, model-checking was used as an alternative
method for the marking instead of graph-covering.
For several years now, game-based learning has
come into the focus of research. Conferences (e.g.
European Conference on Games-Based Learning
(ECGBL)) that focused on this special topic now
exist. But in game-based learning, usually the didac-
tical approach and the presentation of content are in
the main focus, not the technical sophistication of
exercises.
What these exercises we discuss above have in
common is that they usually focus on one special
kind of exercise: The mathematical calculation, the
graphical modelling, the programming, the didacti-
ICEIS2013-15thInternationalConferenceonEnterpriseInformationSystems
436
cal setting. In the following, we will present an ap-
plication that is based on graphical modelling, as
well as on a mathematical calculation. The mathe-
matical calculation again is based on the structure of
the graphical diagram.
3 METRA POTENTIAL METHOD
The metra potential method as a special precedence
diagram method is used for planning and scheduling
projects or activities with logical relations and inter-
dependencies. The main purpose is to calculate the
duration of a project/process, i.e. the minimal and
the maximal duration and to identify critical paths
and activities that may lead to a delay. During exe-
cution, potential delays can be identified so that
measures can be taken into account in order to avoid
missing a given deadline. For a deeper insight into
the method, have a look at Hajdu 1997.
A
Setup: 14
D: 10
E
Setup: 1
D: 3
D
Setup: 3
D: 4
F
Setup: 2
D: 5
C
Setup: 3
D: 3
B
Setup: 3
D: 2
12
1221
Figure 1: Parts structure diagram.
The general mode of operation is as follows: For
explanation, we look at the date and capacity plan-
ning of the production planning and control. Let us
assume a parts structure as depicted in Figure 1. The
figure can be read as follows: Each vertex represents
one certain part. The edges represent the relation
between the parts. That means, for example, that part
B goes into part A. Thus, in order to produce one
product A, we need two parts of B and one part of C;
to produce B, we need one part of D and two parts of
E; and for C we need two parts of E and one of B.
Then, concerning the inferior parts D, E and F for
one product A, we need all together two parts of D,
six parts of E and one part of E. Assuming that every
part is produced during one single activity, the parts
structure also represents the production process. The
time that is needed for the production is given in the
vertices: There is a so-called setup time that is need-
ed in order to prepare the machines in one period.
This time consumption is always the same regardless
if one or a thousand pieces are produced. In addition,
we need time D to produce one piece of each part.
Thus, when producing for example three pieces of
product A, we need 14 + 3 10 = 44 time units in
total for the last activity in our production process.
Now, this structure has to be modelled with the
metra potential method. While the parts structure is
more general, the metra potential method can only
represent a certain case. That means we have to
know the number of pieces to be produced before
doing the date planning. In our example, we keep the
assumption of three pieces of product A that have to
be produced. Assuming that all pieces are produced
during one activity before handling them out for the
next activity, we get the corresponding diagram as
shown in figure 2.
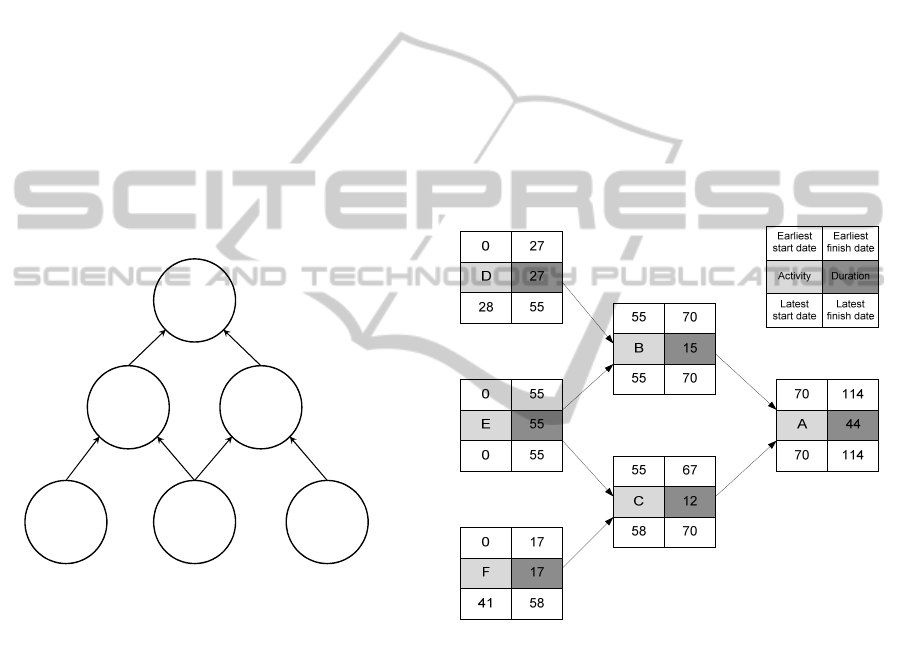
Figure 2: Sample diagram for the metra potential method.
The general structure remains the same. Now each
vertex provides the following information: The light
grey rectangle indicates the activity and the dark
grey rectangle contains the duration of the activity in
total. In the upper left, we find the earliest point in
time when an activity can start (ESD). In the upper
right corner, the earliest possible point in time is
displayed when the activity can finish (EFD). In the
lower left corner, the latest possible start date is
shown (LSD) and in the lower right corner the latest
finish date (LFD).
The computation of the duration is not an inher-
ent part of the metra potential method but of the
special use case production planning. Within project
planning the duration would be given. Nevertheless,
ElectronicExercisesfortheMetraPotentialMethod
437

this computation can also be integrated into the e-
learning exercises we will present later.
The calculation of the four points in time is an
inherent part of the metra potential method. Starting
with the current time, the earliest start date of verti-
ces without predecessor is always 0. Let i,j be verti-
ces/activities of the diagram. If there is an edge
between i and j, we write (i,j). Then the four points
in time can be computed as follows:
0
max
,
(1)
(2)
max
min
,
(3)
(4)
Based on the resulting diagram an analysis can be
started concerning the critical path and activities.
For each activity, the total buffer (TB) can be com-
puted:
(5)
Critical activities are those where the total buffer is 0
because there is no flexibility concerning the time.
The path where the total buffer of each activity is 0
is called critical path.
Irrespective of the total buffer, the free buffer in-
dicates the flexibility of an activity with respect to
succeeding activities:
min
,
(6)
4 E-LEARNING SYSTEM
4.1 General Design and Architecture
In the following, we will present an e-learning sys-
tem for the metra potential method. This system is
accessible to students via the Internet so that they
can practise wherever and whenever they like. Be-
sides this, the following functions are mandatory:
Definition and provision of interactive, sophisti-
cated exercises of different types,
Automatic generation of exercises,
Solving of exercises,
Automatic marking of exercises,
Administration of students and exercises,
Archiving of exercises and student solutions.
The first point deals with the type of exercises.
Students should not be able to guess a solution. For
this, the system only provides a graphical editor with
a small set of graphical elements. For difficulty level
purposes, some elements may not be useful for the
metra potential method. Then, students can freely
model their diagrams without any restrictions. The
captions for the vertices can be derived from the
textual description by drag & drop. Once students
did the modeling and the calculation part they send
their solution to the system that automatically marks
the solutions.
For instructors, the system provides a module
where exercises can be defined. For this, it is neces-
sary to describe the exercise in textual form. Addi-
tionally, it is possible to upload illustrating figures
that can also contain necessary information. The
description is only for the students. The system itself
needs information about the structure itself. For this,
instructors model the reference solution for the exer-
cise with the same editor with which students are
practicing. With the help of the durations of each
activity and the structure of the diagram, the calcula-
tion of start and end dates can be done automatically
by the system.
In addition to the manual definition, exercises
can also be generated automatically. For this pur-
pose, it is only necessary to provide text patterns that
can be recomposed to describe an exercise. Neces-
sary numerical values can be easily created with
random functions.
Generating
Module
Parameters
Provision of
exercises
Exercises
Solving
+Supporting
Module
Practising
Exercises
Solution
Exercises
Exercise
Archive
Presentation
Module
User
Data
User Archive
User administration
Marking
Module
Marking
Figure 3: Architecture of the e-learning system.
Besides the practicing part in a narrow sense, the
system also provides functions to administer all
students and all exercises that have ever been creat-
ed by instructors or generated automatically. These
exercises and also the student solutions are stored so
that they can be analysed later by students them-
selves as well as by instructors so that they can see
where there are still problems of understanding.
ICEIS2013-15thInternationalConferenceonEnterpriseInformationSystems
438

Figure 3 gives an overview of the e-learning sys-
tem’s architecture.
4.2 Exercise Generation
The general exercise structure for the metra potential
method is always the same: Based on the relation
structure of activities, start and finish dates have to
be computed. The computation of these dates is
based on six equations (see equation 1-6) that can
easily be realised automatically when the activity
structure and the duration of activities is known.
In order to provide an automatic generation of
exercises, it is necessary to randomly generate an
activity structure and the durations of the activities.
Then, based on text patterns, a textual description of
an exercise can be generated by using the text pat-
terns and filling out different placeholders with the
automatically generated values for the durations.
This general procedure can be refined by imple-
menting special applications. For example, as we
could see in the example of the date planning the
duration of activities can also be calculated. This
does holds not only for this application but also for
other applications, such as the project management.
There, the duration can be estimated or forecasted
with different methods. It follows that for each spe-
cial application, we just have to implement a method
that calculates the duration of activities if some
parameters are given. The calculated duration is then
the input for the metra potential method while the
parameters with which the duration was calculated
are given in the generated exercise definition.
Aside from the automatic generation of exercis-
es, three types of exercises can be provided:
Simple exercises,
Timed exercises,
Exam exercises.
Simple exercises are ordinary exercises that can
be solved by students. They consist of a description
and the editor. Timed exercises additionally provide
the target time of the exercise. That helps to prepare
for exams because now students know if they are
quick enough. Exam exercises also provide the tar-
get time, but unlike timed exercises after the target
time has run out, students cannot continue with
exam exercises anymore.
The calculation of the target time can be done by
the system itself. Each vertex and edge of the metra
potential diagram usually needs the same time for
modelling and, as well, each calculation step needs a
certain period of time. If the duration has to be cal-
culated in addition, more time has to be added to the
target time depending on the complexity of the cal-
culation.
In general, exercises should be classified by dif-
ferent levels of difficulty, corresponding to students'
level of knowledge. Exercises are much better ac-
cepted this way rather than without classification. It
is essential that students are able to choose among
several difficulty levels. Concerning the metra po-
tential method, the difficulty level mostly depends
on the (pre-) calculation of the duration and the
complexity of the activity structure. The more paral-
lel paths the diagram has that are interconnected, the
more difficult it is to calculate the start and finish
dates. In addition, the difficulty increases with the
number of activities. Thus, easy exercises already
provide the duration and consist only of a maximum
of two parallel paths with an interconnection. Medi-
um exercises may either contain the duration or the
duration has to be calculated. In addition, there are
possibly more than two parallel paths with intercon-
nections. In difficult exercises, the duration has to be
calculated for each activity and there are several
parallel paths with different interconnections. In
addition, the different buffer times of activities can
be demanded.
4.3 Automatic Marking
As we have seen, the metra potential method is a
mixture of graphical modelling and a calculation
scheme. First of all, the structure has to be found
before it is possible to calculate the different points
in time. When practising, students usually get a
textual description that is sometimes illustrated by
figures like figure 1 or tables. Then, their task is to
model all the elements of the description as exactly
as possible and to calculate the different start and
finish dates. But as modelling is always a somewhat
creative task, it is often possible to model in differ-
ent ways. That means that a student’s solution is not
necessarily (completely) similar to the reference
solution but is as useful and as correct.
If there was only one possible solution for an ex-
ercise, a simple depth first search and comparison
between the student solution and the reference solu-
tion would be feasible. But it is possible that more
than one solution exists such that it is impossible to
do just a 1:1-comparison between the reference
solution and the student solutions.
The research in this field has created different
approaches to mark graphical models where several
alternative solutions are possible. In many applica-
tion fields of the metra potential method, there is
only one feasible solution and only a few alterna-
ElectronicExercisesfortheMetraPotentialMethod
439
tives that can also be used but that are not as elegant
as the single reference solution. The graph covering
approach (Siepermann, 2005) with correct and
wrong patterns seems to be the best approach to
cope with this situation because in most cases, it will
be enough to model only one reference solution and
only a few additional alternative patterns that are
either correct or wrong. For this reason, we decided
to use this approach. This approach automatically
marks a student solution. If all parts are recognised,
the marking algorithm can proceed to check the
calculation. If not, the instructor is asked to inter-
vene and to mark only the unrecognised parts. These
newly recognised parts are then inserted into the
knowledge base of the marking algorithm.
Three different kinds of errors can appear in a
student solution (Siepermann and Lackes 2007, p.
16):
Content faults,
arithmetical faults and
caption faults.
Content faults may concern the structure of the
diagram and the calculation of some dates. The
structure is already checked by graph covering.
Thus, only the content faults in the calculation are
now in the focus. Arithmetical faults arise when
students know about the calculation but do not add
up some values in a mathematically correct way, for
example. These faults cannot be distinguished from
content faults. Caption faults only concern the name
of an activity. If the caption can only be done via
drag and drop, then only completely wrong captions,
doubled captions or interchanged captions can occur.
All these faults are also discovered during the graph
covering.
This means that only content faults concerning
the right or wrong usage of calculation rules for the
start and end dates have to be considered after the
structure check. The marking of the calculation has
Figure 4: User Interface of the e-learning system.
ICEIS2013-15thInternationalConferenceonEnterpriseInformationSystems
440

to be done on the basis of the diagram of the student
solution because if the structure of the diagram is
different to the reference solution, different values
are calculated that cannot be compared. That means
that a possibly faulty value may just be a consecu-
tive fault of the structural modelling.
Within the calculation, many consecutive faults
may also arise: If one calculation step is incorrect,
all following calculation steps that are based on the
faulty value also deviate from the reference solution.
For this, the marking algorithm does not compare
the values of the reference solution and the student
solution but checks every single calculation step. If
the calculation step is correct, the algorithm pro-
ceeds with the next value. If not, the algorithm has
to mark and memorize the mistake. When proceed-
ing to the next value, the algorithm now has to check
this next value considering the previously made
mistakes in order to find consecutive faults. There
are three possibilities concerning the next value:
The next value is correct with regard to the refer-
ence solution.
The next value is correct with regard to the previ-
ously made mistakes.
The next value is completely incorrect.
In the first case, the checked value is correct and
nothing has to be done. In the second case, the value
is a consequence of a previously made mistake and
has to be marked as a consecutive fault. In the third
case, the value has to be marked as incorrect. After
the marking algorithm has finished, the marked
solution is displayed to the student. The reference
solution that is also calculated automatically can also
be viewed by the student.
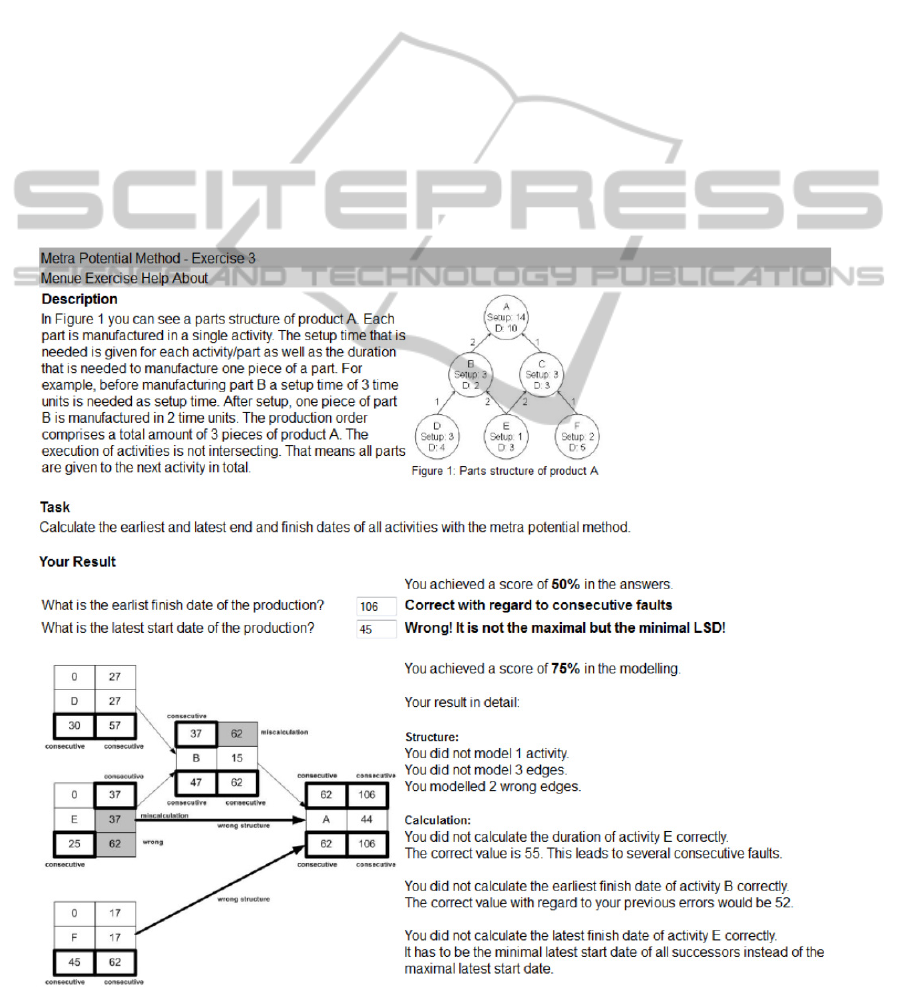
4.4 User Interface
Figure 4 shows the user interface of the system when
a student’s solution is already marked. It is the same
exercise that we used above. But here, in addition to
the modelling, students also have to answer to two
questions concerning the earliest starting and latest
finish date.
The system has marked all faults red and all con-
secutive faults with a big red border (both are grey
in the figure). The student made a mistake concern-
ing the structure: He forgot to model activity C so
that two of his edges are wrong (bold red edges) and
one edge is missing. There are also three faults in the
calculation. For two faults, the reason cannot be
identified. It can be a simple arithmetical fault as
well as content fault. But concerning the wrong
latest finish date of activity F, it is a content fault
because the student has used the maximum starting
date of the successors instead of the minimal date.
All faults are marked in the model and a short
description of the marking is given. An overall score
for the solution is calculated so that students know
their current level of knowledge.
5 CONCLUSIONS
The metra potential method is used in many differ-
ent scientific disciplines. While the general structure
remains the same, the calculation of the duration
may vary. In this paper, we presented an e-learning
system that provides e-learning exercises for the
metra potential method to students. These exercises
can be defined manually or generated automatically
and they are marked automatically by the system.
For each application that should be covered by the
system, only a few things have to be done:
The calculation of the activity duration has to be
implemented.
Text patterns for the exercise generation have to be
stored in the system.
The placeholders in the text patterns have to be
assigned to the parameters of the duration calcula-
tion.
The e-learning system is used within several lec-
tures by bachelor as well as by master students.
Future research should investigate the question as to
how the e-learning exercises help students to better
understand usage of the metra potential method.
Another question is how students accept the system.
Initial surveys have shown good acceptance and
satisfaction with the system.
The e-learning system itself can also be enlarged:
Some of the student faults are the result of a deficit
of understanding. When these faults occur, students
can be advised to repeat certain lessons.
Another improvement concerns hints during the
practicing process. In the current state, the system
does not give any hints how to model the activity
structure or how to calculate the dates or durations.
In the practicing mode, such hints could be imple-
mented so that a student can ask for help if he got
stuck.
REFERENCES
Bolliger, D. & Martindale, T., 2004. Key Factors for
Determining Student Satisfaction in Online Courses.
International Journal on E-Learning, (3), pp. 61-67.
Bruns, H., 2002. How to choose the right eLearning tech-
nique? Overview and recommendations. eLearning
ElectronicExercisesfortheMetraPotentialMethod
441

and Economics, Bruns, H., & Ambrosi, G.M. (Eds.),
Norderstedt: Books on Demand, pp. 17-25.
Brusilovsky, P., 1992. The Intelligent Tutor, Environment
and Manual for Introductory Programming. Educa-
tional Technology and Training International, 1992,
29, (1), pp. 26-34.
Brusilovsky, P., Sosnovsky, S. & Yudelson, M., 2005.
Ontology-based framework for user model interopera-
bilty in distributed learning environments. Proceed-
ings of World Conference on E-Learning, Richards, G.
(Ed.). Chesapeake, USA, pp. 2851-2855.
Glowalla, U., Glowalla, G. & Görlich, S., 2004.
Verbessern von Vorlesungen durch E-Learning
Komponenten. i-com, 3 (2), 57-62.
Haack, J., 2002. Interaktivität als Zeichen von Multimedia
und Hypermedia. Information und Lernen mit
Multimedia und Internet, Issing, L.J, & Klimsa, P.
(Eds.), BeltzPVU, Weinheim, Germany, pp. 127-136.
Hajdu, M., 1997. Network Scheduling Techniques for
Construction Project Management, Kluwer Academic
Publishers.
Higgins, C., Gray, G., Symeonidis P. & Tsintsifas, A.,
2005. Automated Assessment and Experiences of
Teaching Programming. ACM Journal on Educational
Resources in Computing (JERIC), Vol. 5, issue 3, Sept
2005, pp. 1531-4278.
Higgins, C., Symeonidis P. & Tsintsifas, A., 2002. The
marking system for CourseMaster. ITiCSE ’02: Pro-
ceedings of the 7th annual conference on Innovation
and technology in computer science education, ACM
Press, pp. 46-50.
Higgins, S., Beauchamp, G. & Miller, D., 2007. Review-
ing the literature on interactive whiteboards. Learning,
Media and Technology, 32, pp. 213-225.
Issing, L.J., 2002. Instruktions-Design für Multimedia.
Information und Lernen mit Multimedia und Internet,
Issing, L.J, & Klimsa, P. (Eds.), BeltzPVU,
Weinheim, Germany, pp. 151-176.
König, M., 2001. E-Learning und Management von
technischem Wissen in einer webbasierten Informa-
tionsumgebung. Duisburg: Druckerei Duennbier.
Patel, A. & Kinshuk, 1996. Intelligent Tutoring Tools – A
problem solving framework for learning and assess-
ment. Proceedings of 1996 Frontiers in Education
Conference – Technology-Based Re-Engineering En-
gineering Education, Iskander, M. F. et al. (Eds.), Salt
Lake City, USA, pp. 140-144.
Saikkonen, R., Malmi, L. & Korhonen, A., 2001. Fully
automatic assessment of programming exercises.
ITiCSE ’01: Proceedings of the 6th annual conference
on Innovation and technology in computer science ed-
ucation, ACM Press, pp. 133–136.
Siepermann, M. & Lackes, R., 2007. Self-Generating and
Automatic Marking of Exercises in Production Plan-
ning. Proceedings of the IADIS International Confer-
ence WWW/Internet 2007, Volume II, Isaias, P.,
Nunes, M.B., Barroso, J. (Eds.), Vila Real, pp. 13-17.
Siepermann, M. & Siepermann, C., 2008. Automatically
Generated and Marked E Learning Exercises for Lo-
gistics Cost Accounting. IJHSS – International Jour-
nal of Humanities and Social Sciences, Vol. 2 (2008),
No. 3, pp. 124-128.
Siepermann, M., 2005. Lecture Accompanying E-
Learning Exercises with Automatic Marking. Proceed-
ings of World Conference on E-Learning, Richards, G.
(Ed.). Chesapeake, USA, pp. 1750-1755.
Siepermann, M., Lackes, R. & Börgermann, C. 2008.
Using Model Checking to Automatically Mark Graph-
ical E-Learning Exercises. Proceedings of ED-MEDIA
2008 World Conference on Educational Media, Mul-
timedia, Hypermedia & Telecommunications, Luca, J.;
Weippl, E.R. (Eds.), Chesapeake, pp. 5302-5307.
Sun, P.-C., Tsai, R.J., Finger, G., Chen, Y.-Y- & Yeh, D.,
2008. What drives a successful e-Learning? An empir-
ical investigation of the critical factors influencing
learner satisfaction. Computers & Education, Vol. 50,
Issue 4, pp. 1183-1202.
Thomas, P., 2003. Grading Diagrams Automatically,
Technical Report, Computing Department, Open Uni-
versity, UK.
Thomas, P., Smith, N. & Waugh, K., 2008. Automatic
assessment of sequence diagrams. 12th International
CAA Conference: Research into e-Assessment,
Loughborough University, UK.
Thomas, P., Waugh, K. & Smith, N., 2005. Experiments in
the automatic marking of ERDiagrams. 10th Annual
Conference on Innovation and Technology in Comput-
er Science Education, Monte de Caparica, Portugal,
pp. 27-29.
Thomas, P., Waugh, K. & Smith, N., 2006. Using patterns
in the automatic marking of ERDiagrams. 11th Annual
Conference on Innovation and Technology in Comput-
er Science Education, Bologna, Italy, pp. 26-28.
Waugh, K., Thomas, P. & Smith, N., 2004. Toward the
automated assessment of entity relationship diagrams.
Second Workshop of the Learning and Teaching Sup-
port Network - Information and Computer Science)
TLAD (Teaching, Learning and Assessment of Data-
bases), Edinburgh, Scotland.
Wenger, E., 1987. Artificial Intelligence and Tutoring
Systems. Computational Approaches to the Communi-
cation of Knowledge. Los Altos: Morgan Kaufmann
Publishing.
ICEIS2013-15thInternationalConferenceonEnterpriseInformationSystems
442
