
Heterodyne Interferometer for In-plane and Out-of-plane
Displacement Measurements
Hung-Lin Hsieh, Wei-Cheng Wang, Ssu-Wen Pan
Department of Mechanical Engineering, National Taiwan University of Science and Technology, No.43, Sec. 4,
Keelung Rd., Da’an Dist., Taipei 106, Taiwan
Keywords: Displacement Measurement, Grating, Heterodyne, In-plane, Out-of-plane.
Abstract: An innovative interferometer based on the heterodyne interferometry, grating shearing interferometry, and
Michelson interferometry for precise displacement measurement is proposed. The system configuration is
simple and easy to set-up. A heterodyne light beam is generated by using an Electro-Optic Modulating
(EOM) technique for amplitude modulation. While the heterodyne light beam normally passes through a
semi-transmission diffraction grating, the reflection part (Michelson interferometry) for out-of-plane
displacement detection and the diffraction part (Grating interferometry) for in-plane displacement detection
can then be obtained. The experimental results demonstrate the system has the capability of providing two-
dimensional displacement information simultaneously. The measurement resolution and range can achieve
to nanometer and millimeter levels.
1 INTRODUCTION
Nanotechnologies play an important role in modem
technology. It includes several research fields, such
as medical science, electronics, optics, mechanics,
material science and chemistry (Zajtchuk, 1999);
(Yu Meyyappan, 2006); (Lérondel et al., 2009);
(Zhao et al., 2010); (Thillya et al., 2009); (Li et al.,
2006). With the further development of these
applications, there is an increasing demand for
precision displacement measurement methods
providing both high measurement resolution and
long measurement range. Many measurement
techniques have been proposed and developed for
precise displacement measurement.
In general, displacement measurement
techniques can be divided into two categories, the
contact and the non-contact types (Hsieh, 2011).
One of the most commonly used contact type
techniques is strain gauge. The measurement
resolution of strain gauge can achieve nanometric
level (Witt, 1974). However, the measurement range
of the strain gauge is only capable of achieving
micrometric range, which is not suitable for long-
range applications. Another commonly used
technique of contact type measurement techniques is
linear encoder. It is a sensor paired with a scale that
used to encode position. The measurement
resolution and range of linear encoder can achieve to
nanometric and millimetric levels (Miyajima et al.,
1998). But there exists a measurement error caused
by misalignment of the two scales of linear encoder
which is hard to be eliminated. Moreover, most
contact type measurement techniques are unsuitable
to apply on the small-scale sample or stage and
sometimes will destroy the surface of the sample.
These are exactly the disadvantages that limit the
application of the contact type measurement
techniques.
Laser interferometry is one of the non-contact
type measurement techniques, which has been
extensively developed to overcome the problems
above. The technique has the advantages of high
resolution, wide measurement range, and flexible of
optical arrangement. Many types of interferometers
are designed and used to achieve nanometric-levels
precision for long measurement range. But if high
frequency noise is considered, sub-nanometer
resolution can only be achieved by using heterodyne
interferometry. However, the interferometry used
without isolation system always suffers from large
disturbance or noise, most commonly from
background vibration, atmospheric influences, and
thermal drift. Measurement accuracy is influenced
due to these phenomenons.
Grating interferometers (GIs) are not subject to
56
Hsieh H., Wang W. and Pan S..
Heterodyne Interferometer for In-plane and Out-of-plane Displacement Measurements.
DOI: 10.5220/0004340300560062
In Proceedings of the International Conference on Photonics, Optics and Laser Technology (PHOTOPTICS-2013), pages 56-62
ISBN: 978-989-8565-44-0
Copyright
c
2013 SCITEPRESS (Science and Technology Publications, Lda.)

these disturbances mentioned above because of the
measurement principles are independent of the
wavelength of light source. Therefore, GI has better
immunity against to the environmental disturbances
as compare with heterodyne interferometers.
Various GIs for precise measurement have been
proposed. Among them, most are for one-
dimensional (1D, in-plane or out-of-plane)
displacement measurement. For two-axis positioning
applications, two-dimensional (2D, in-plane and out-
of-plane) displacement measurements are essential.
The demand of 2D displacement applications are
strong growing, rising attentions for researchers to
find methods for in-plane and out-of-plane
displacement measurements. Thus the requirements
of the measurement techniques should no longer be
limited for just 1D use only but also for 2D
measurement. Normally, a pair of interferometers,
which are perpendicular to each other, can be used
for in-plane and out-of-plane displacement
measurements respectively. However, the
orthogonality of the two interferometers is essential
to provide precisely, otherwise the measurement
error caused by orthogonal alignment of two
interferometers will be induced.
In this paper, a heterodyne interferometer is
proposed to measure the motion behavior of a semi-
transmission grating in 2D plane, in-plane and out-
of-plane. The in-plane displacement information is
obtained by grating interferometry and determined
by the relation of the grating pitch and optical phase
variation. Moreover, the out-of-plane displacement
information is aquired by Michelson interferometry
which is determined by the relation of the
wavelength of light source and the optical path
difference. Benefiting from the proposed heterodyne
interferometer, this method has the advantages of
simple configuration, high measurement resolution,
large measurement range, and relatively
straightforward operation. The feasibility is
demonstrated.
2 PRINCIPLES
The following section will describe the principles of
our proposed interferometer. The schematic diagram
of the optical arrangement is shown in figure 1. The
Y axis indicates the direction of beam propagation
and the X and Z axes follow the horizontal and
vertical planes. By using Su's electro-optic
modulating technique (Su et al., 1996), the complex
amplitude (E
0
) of the heterodyne light source can be
written as follows
0
exp( )
2
exp( )
2
it
E
it
(1)
where
is the heterodyne frequency.
2.1 Principle of Grating Interferometry
for In-Plane Displacement
Measurement
As the heterodyne light beam enters a semi-
transmission grating, the beam will be diffracted and
propagate in according angle. The angle of
diffracted beam can be obtained by the following
equation:
1
sin ( sin )
min
m
(2)
where m is the diffraction order, λ represents the
wavelength of the incident beam, Λ and α
m
are the
grating pitch and the angle between the incident
beam and the normal to the grating. In our system,
the +1 order diffraction beams are utilized. The
electric fields of +1 order diffraction beams can be
written as:
1
110
1
exp( )
2
exp( )
exp( )
2
i
i
i
it
ikl i
EikliE
it
ikl i
(3)
The +1 order diffraction beams are incident into two
mirrors and then reflected into a polarizing beam-
splitter (PBS) respectively. The PBS split the
incident two beams into s-polarized status and p-
polarized status respectively. As a result, the two
beams are divided into four beams. According to the
optical arrangement and Jones calculation, the status
of the four beams can be written as follows:
111
1
45 0 exp
1
2
p g
it
E AN PBS E ikl i
(4)
111
1
45 90 exp
1
2
s g
it
E AN PBS E ikl i
(5)
111
1
45 0 exp
1
2
p g
it
E AN PBS E ikl i
(6)
111
1
45 90 exp
1
2
s g
it
E AN PBS E ikl i
(7)
Refer to Eq. (4)-(7), E
+1p
, E
+1s
, E
-1p
and E
-1s
represent
the electric fields of the four beams, φ
g
is phase
difference induce by the moving grating. After
passing a polarizer with 45° polarized, the +1 order
HeterodyneInterferometerforIn-planeandOut-of-planeDisplacementMeasurements
57

diffraction beams interfere. The interference
beatings are then detected by two detectors (PD3
and PD4) and can be shown below
2
11
311
1cos 2
2
g
ps
tkl l
IE E
(8)
2
11
411
1cos 2
2
g
sp
tkl l
IEE
(9)
Then the detected signals (I
3
and I
4
) are sent into a
lock-in amplifier (LIA) so the phase difference
between the two signals can be obtained as:
4
g
l
(10)
where Δl is the grating displacement, Λ represents
the grating pitch. As a result, the grating
displacement can be written as:
4
g
l
(11)
2.2 Principle of Michelson
Interferometry for out-of-Plane
Displacement Measurement
In our system, a beam-splitter was added in front of
the grating. The semi-transmission grating was
regarded as a reflective mirror in this detection
configuration so the out-of–plane displacement can
be detected by using a Michelson interferometry.
The optical arrangement is shown in figure 1. A He-
Ne laser beam is incident into a beam-splitter (BS).
The beam is split into two parts, which are reference
and measurement beams. The reference beam is
incident into a fixed mirror then reflected directly
into the detector (PD1). The measurement beam is
incident into a grating and reflected by the semi-
transmission grating. As a result, the grating can be
regarded as a mirror, and the beam reflected by
grating is called measurement beam. Since the beam
is reflected by grating, the configuration of
Michelson interferometry has been easily
constructed.
The electric fields of the reference and
measurement beams are shown below
exp( )
2
exp( )
2
ri
rin
ri
it
ikl i
EEOMtE
it
ikl i
(12)
Figure 1: The optical configuration of proposed system.
(EOM: Electro-optic modulator; AN: Analyzer; PD:
Photodetector; M: Mirror; BS: Beam splitter; PBS:
Polarizing beam splitter; LIA: Lock-in Amplifier.)
exp( )
2
exp( )
2
mi
min
mi
it
ikl i
EEOMtE
it
ikl i
(13)
where l
r
and l
m
are the optical paths of the reference
and measurement beams respectively. After passing
a polarizer with 45° polarized, the two beams
interfere and can be measured by the detector (PD2).
The interference signal is shown as
2
21
cos
rm
I
EE kll
(14)
After sending the interference signals into the LIA,
the phase difference signal can be obtained as
21
2kl l k l
(15)
2
l
k
(16)
Refer to Eq. (16), the out-of-plane displacement Δl
can be obtained.
3 EXPERIMENTAL RESULTS
To demonstrate the feasibility of our proposed
interferometer, two measurement experiments were
performed for in-plane and out-of-plane
displacement measurements and for further
application the straightness also been tested. It relies
on a heterodyne beam source composed of a linearly
polarized He-Ne laser beam modulated by an
electro-optic modulator (EOM) (model: EO-PM-
NR-C1). The frequency difference between the s-
and p- polarizations of the heterodyne light source is
20 kHz. A commercial semi-transmission grating
with a pitch size of 1.2 μm was mounted on a two
PHOTOPTICS2013-InternationalConferenceonPhotonics,OpticsandLaserTechnology
58
axes positioning stage. A BS is placed in front of the
grating so the beam can be split into two detection
parts, reflection and diffraction detection types. The
two detection types were used to measure out-of-
plane and in-plane displacements respectively. Two
LIAs (SR850) with an angular resolution of 0.001°
were used to measure the phase difference between
the reference signal and each of the interference
signals.
3.1 Displacement Measurement Result
A displacement test was performed to demonstrate
that our proposed interferometer is capable of
sensing in-plane and out-of-plane displacements.
The positioning stage was asked to move forward
and backward with amplitude of 100 µm along in-
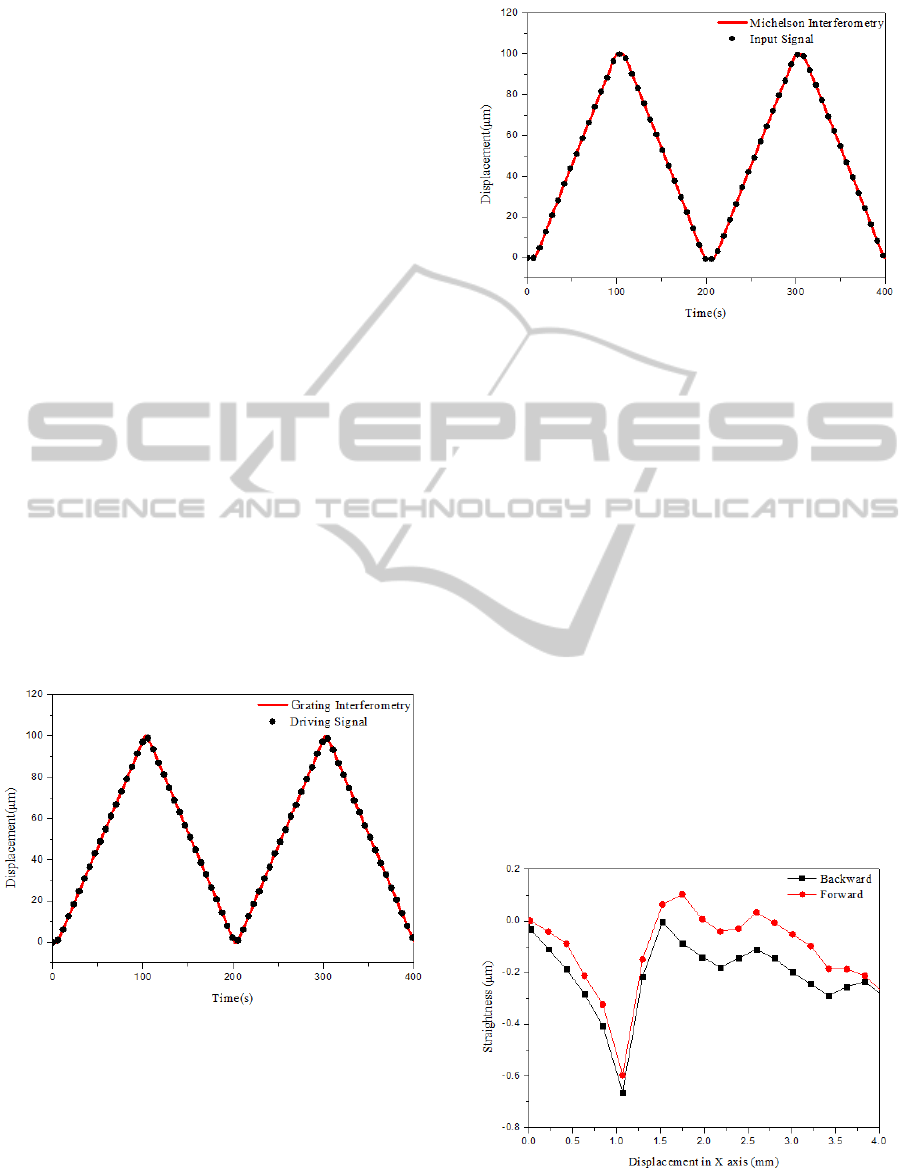
plane and out-of-plane directions respective. Figure
2 shows the experimental result of X (in-plane)
direction obtained by the grating interferometry. The
curve obtained by grating interferometry is similar to
the driving signal. Also, the experimental result of Y
(out-of-plane) direction obtained by Michelson
interferometry is shown in figure 3. As shown in
figure 3, the curve obtained by Michelson
interferometry is as linear as the driving signal we
used. From the two experimental results, it is clearly
that our proposed system has the ability to measure
in-plane and out-of-plane displacements.
Figure 2: Displacement measurement result of X direction
(100 µm).
3.2 Straightness Measurement Result
Furthermore, a straightness measurement experiment
was performed to demonstrate that our
interferometer can be used to measure straightness
error in two directions. In this experiment, the
positioning stage was set to move along the X
Figure 3: Displacement measurement result of Y direction
(100 µm).
direction, the lateral displacement (straightness error)
in the Y direction was recorded by Michelson
interferometry. The experimental result is shown in
figure 4. Clearly, the maximum straightness error is
about 700 nm in the Y direction within the stroke of
4 mm along the X direction. The experimental data
also show a pair of similar back (solid black squares)
and forth (solid red circles) paths. Besides
measuring straightness error along the X direction,
the experiment of straightness error along the Y
direction was also performed. Figure 5 shows the
measurement result of straightness error obtained by
grating interferometry. The measurement result
shows that a pair of similar back-and-forth paths.
The maximum straightness error is about 300 nm n
the X direction within the stroke of 4 mm along the
Y direction. According to the above experimental
results, it demonstrates that our proposed
interferometer is capable of measuring straightness
in both directions (X and Y) successfully.
Figure 4: Straightness measurement result of X direction.
HeterodyneInterferometerforIn-planeandOut-of-planeDisplacementMeasurements
59
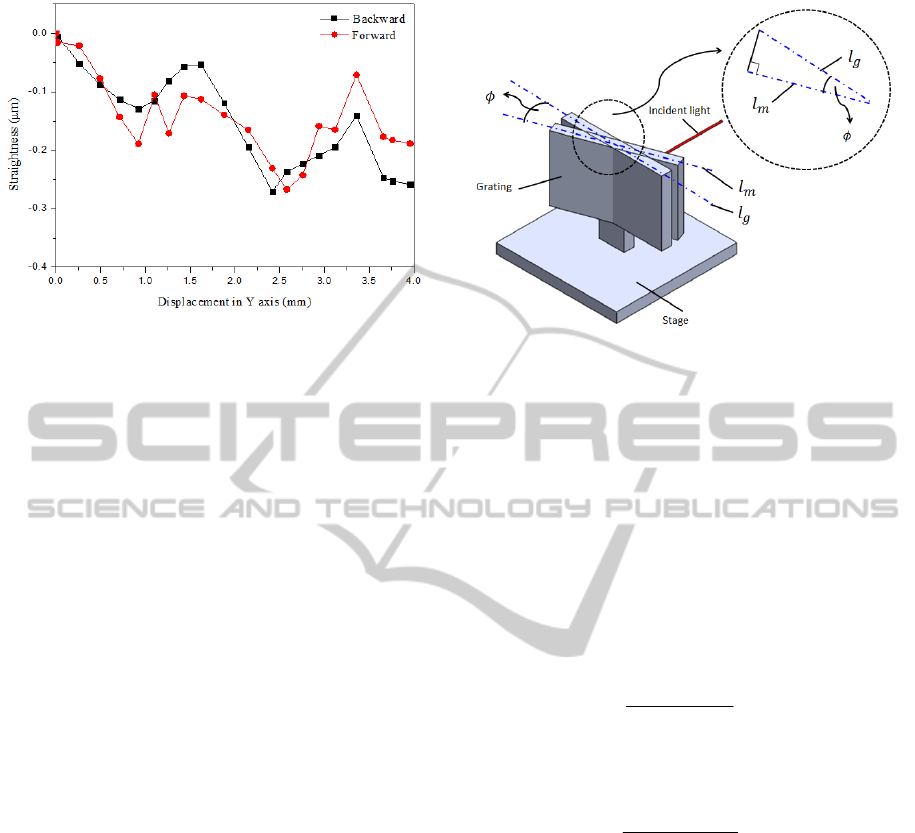
Figure 5: Straightness measurement result of Y direction.
4 DISCUSSION
In our proposed system, the measurement error
caused by the misalignment angle of yaw error will
influence the measurement result. In additions,
because our method combines heterodyne
interferometry and grating interferometry, we need
to take into account the error effects coming from
both of those interferometries. In our case, the error
arises from non-linearity of heterodyne modulating
technique and non-uniformity of grating pitch. These
errors also will affect our measurement result. As a
result, in this section, we are going to discuss the
effect of these factors above.
4.1 Error Caused by the Misalignment
Angle of Yaw Error in the Grating
Interferometry
As shown in figure 6, if there exits a misalignment
angle of yaw error between the grating and the
positioning stage, the displacement measured by the
grating interferometry will be influenced. The
relationship between the measured displacement l
m
and the actual displacement l
g
is shown below.
g
cos
m
ll
(17)
The error caused by the misalignment can be written
as
ggg g
lllcosl(1cos)
gm
el
(18)
If the yaw error factor is estimated to be 0.05˚ while
the stage is asked to move a displacement of 1 mm,
the measurement error is about 0.38 nm in this case.
Figure 6: error induced by tilted grating.
4.2 Error Caused by the Misalignment
Angle of Yaw Error in the
Michelson Interferometry
As shown in figure 7(a), if there exits a
misalignment angle of yaw error between the grating
and the positioning stage, the displacement
measured by the Michelson interferometry will also
be influenced. The l
a
+ l
c
and l
b
+ l
d
represent the
optical paths of the measurement beams with and
without yaw errors respectively. The relationship
between l
a
and l
b
can be written as
sin135
sin(45 2 )
ba
ll
(19)
And the relationship between l
d
and l
c
can be written
as
sin 45
sin(135 2 )
dc
ll
(20)
Therefore, the measurement error (e
p
) caused by the
misalignment can be written as follow
()
p
bd ac
ell ll
(21)
If there exits a misalignment angle of yaw error of
0.05
°, the measurement error is about 1.747 nm in
this case.
4.3 Error Caused by non-linearity of
Heterodyne Modulating Technique
and Non-Uniformity of Grating
Pitch
The non-linearity in a typical heterodyne
interferometry mainly arise from the mixing of
PHOTOPTICS2013-InternationalConferenceonPhotonics,OpticsandLaserTechnology
60
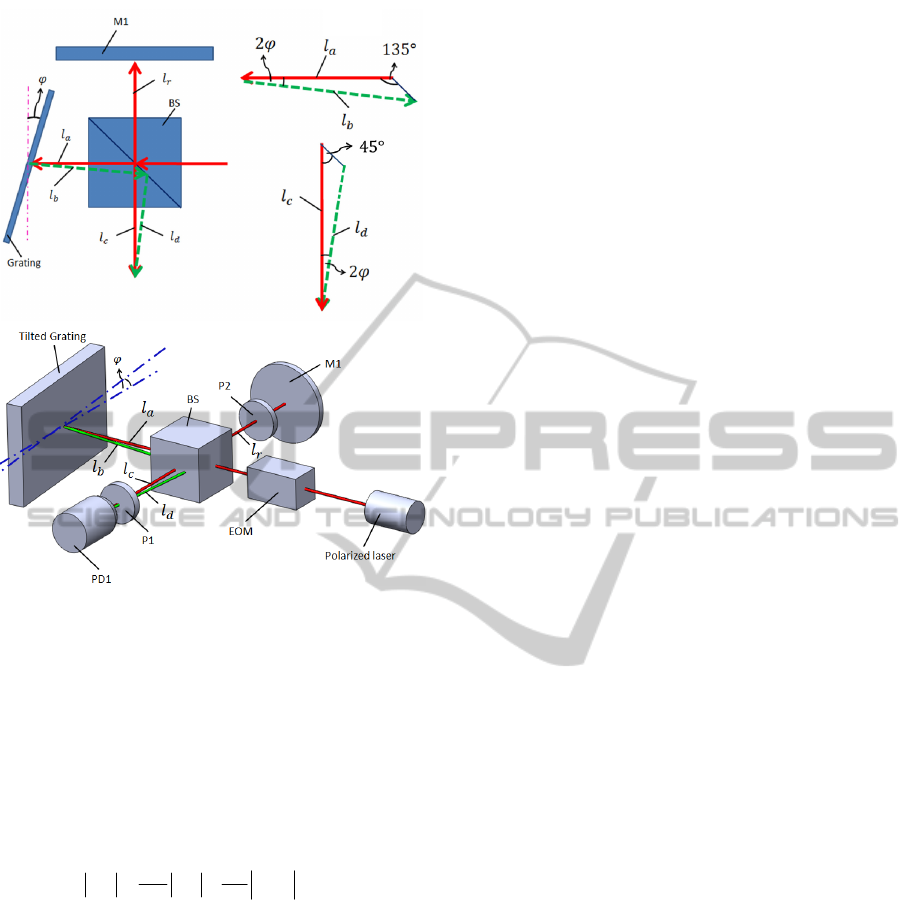
Figure 7: The Error Effect of Michelson Interferometry: (a)
the top view of the error configuration, (b) the overall
error configuration
frequency and polarization Moreover, non-
uniformity is caused by utilizing a grating with
irregular grating pitch or the thermal variation in
grating interferometry. The performance of our
proposed system is influenced by these factors. The
theoretical displacement error |Δe
t
| in the proposed
interferometer is given by the following expression:
44
g
tg
e
(22)
where |ΔΛ| is the uncertainty of grating pitch and
|ΔΦ
g
| is the phase uncertainty mainly caused by
frequency mixing and polarization mixing errors.
According to the characteristic of the experimental
setup, the total error |Δe
t
| caused by non-linearity
and non-uniformity is about 1.628 nm.
5 CONCLUSIONS
In this research, we proposed a heterodyne
interferometer for measuring 2D (in-plane and out-
of-plane) displacement. Once a heterodyne light
beam normally passes through a semi-transmission
diffraction grating, the system is divided into two
detection parts, reflection part (Michelson
interferometry) and diffraction part (Grating
interferometry). The experimental results show that
the system has ability to provide precise in-plane
and out-of-plane displacement information without
changing its optical arrangement. Straightness tests
in 2D are also conducted to prove the system
feasibility. Moreover, the error analysis reveals that
the dominant errors are mainly caused by the
misalignment of the yaw angle, the errors arising
from non-linearity of heterodyne modulating
technique and the non-uniformity of grating pitch.
Therefore, the measurement resolution and range
can achieve to nanometric and millimetric levels.
ACKNOWLEDGEMENTS
The authors cordially thank the NTUST Opto-
Mechatronics Technology Center for their useful
help. This study was supported by the National
Science Council, Taiwan, under contract NSC-101-
2218-E-011-033.
REFERENCES
Zajtchuk R., 1999. “New technologies in medicine:
biotechnology and nanotechnology” Disease a-Month,
Volume 45, Issue 11, PP453-495.
B, Yu, M. Meyyappan, 2006 “Nanotechnology: Role in
emerging nanoelectronics” Solid-State Electronics,
Volume 50, Issue 4, PP536-544.
G. Lérondel, A. Sinno, L. Chassagne, S. Blaize, P. Ruaux,
A. Bruyant, S. Topçu, P. Royer, Y. Alayli, 2009
“Enlarged near-field optical imaging” Applied
Physics, Volume 106, Issue 4, PP 044913 - 044913-4.
J. Zhao, M. Kunieda, G. Yang, X. Yuan, 2010 “The
Application of Nanotechnology for Mechanical
Manufacturing,” Key Engineering Materials, Volumes
447 – 448, PP86-90.
L. Thillya, S. Petegemb, P. Renaulta, F. Lecouturierc, V.
Vidald, B. Schmittb, H. Swygenhovenb, 2009 “A new
criterion for elasto-plastictransition in nanomaterials:
Application to size and composite effects on Cu–
Nbnanocompositewires,” Acta Materialia, Volume 57,
Issue 11, PP3157–3169.
J. Li, Y. Lu, M. M, 2006 “Nano Chemical Sensors with
Polymer-Coated Carbon Nanotubes,” IEEE Sensors
Journal, Volume 6, Issue 5, PP 1047-1051.
H. L. Hsieh, 2011 “Novel interferometric stage based on
quasi-common-optical-path configuration for large
scale displacement,” doctoral thesis.
G. R. Witt, 1974 “Thin solid film,” Thin Solid Films
Volume 22, Issue 2, pp133–156.
H. Miyajima, E. Yamamoto, K. Yanagisawa,
(b)
(a)
HeterodyneInterferometerforIn-planeandOut-of-planeDisplacementMeasurements
61

1998” Optical micro encoder with sub-micron
resolution using a VCSEL” Sensors and Actuators A:
Physical, Volume 71, Issue 3 pp213–218.
D. C. Su, M. H. Chiu, and C. D. Chen, 1996 "Simple two-
frequency laser," Precis. Eng. 18, 161–163.
PHOTOPTICS2013-InternationalConferenceonPhotonics,OpticsandLaserTechnology
62
