
Useful Pattern Mining on Time Series
Applications in the Stock Market
Nikitas Goumatianos
1,2
, Ioannis T. Christou
1
and Peter Lindgren
2
1
Athens Information Technology, 19km Markopoulou Ave. PO Box 68, Paiania, Greece
2
Aalborg University, Fibigerstræde 16, Aalborg, DK-9220, Denmark
Keywords: Pattern Mining, Stock Market, Trading Systems, Time-series Forecasting, Distributed Computing,
Databases.
Abstract: We present the architecture of a “useful pattern” mining system that is capable of detecting thousands of
different candlestick sequence patterns at the tick or any higher granularity levels. The system architecture
is highly distributed and performs most of its highly compute-intensive aggregation calculations as complex
but efficient distributed SQL queries on the relational databases that store the time-series. We present initial
results from mining all frequent candlestick sequences with the characteristic property that when they occur
then, with an average at least 60% probability, they signal a 2% or higher increase (or, alternatively,
decrease) in a chosen property of the stock (e.g. close-value) within a given time-window (e.g. 5 days).
Initial results from a first prototype implementation of the architecture show that after training on a large set
of stocks, the system is capable of finding a significant number of candlestick sequences whose output
signals (measured against an unseen set of stocks) have predictive accuracy which varies between 60% and
95% depended on the type of pattern.
1 INTRODUCTION
Stock market prediction has long been an attractive
area of research both by academy and industry.
Regarding the predictability of future prices of
instruments (stocks, futures, forex, options, etc)
from historical data, there is an ongoing dispute
between scientists. Before the 1980s, most
researchers were sceptical about the ability to predict
future prices, especially, when using technical
analysis, and concluded that is not possible to
produce as good results as the buy-hold strategy
(Alexander, 1961); (Jensen and Bennington, 1970);
(Fama, 1970). However, later studies showed just
the opposite (Pruitt and White 1988, Bessembinder
and Chan 1995). Trading rules/systems based on
past data could create excess returns and prove that
usefulness of technical analysis (Brock et al., 1992),
Bessembinder and Chan (1995, 1998); (Lo et al.,
2000) and many others.) Moreover, there is a
behavioural bias which may be consistent with
technical analysis and price patterns (Bodie et al.,
2009, pp. 395). There are chart/price patterns in
technical analysis that are repeated many times in
the past depicting specific investors’ behaviours.
Generally, based on technical analysis, there are
two types of price patterns: Charts formations which
consist of many consequent data such as Head and
Shoulders and Candlestick patterns which consist of
2-3 candlesticks such as Engulfing, Harami, doji, etc
(Bulkowski, 2008). Candlestick is the visual
representation of an instrument (stock, future, etc)
which consists of a body (open, close) and a shadow
(high, low) over a specific time frame (a week, a
day, 1 min, etc).
1.1 Related Work
Much academic research has been done regarding
specific chart formations (head & shoulder, triple-
top, double-top, etc). Zhang et al., (2010)’s work is
about pattern matching based on Spearman’s rank
correlation and sliding window, which is more
effective, sensitive and constrainable comparing to
other pattern matching approaches such as Euclidean
distance based or the slope-based method. Similarly,
there are a lot of studies involving candlestick
patterns. An expert system for predicting stock
market timing using candlestick charts was proposed
by Lee and Jo (1999). The patterns which considered
as representation of rule could be composite and
608
Goumatianos N., T. Christou I. and Lindgren P. (2013).
Useful Pattern Mining on Time Series - Applications in the Stock Market.
In Proceedings of the 2nd International Conference on Pattern Recognition Applications and Methods, pages 608-612
DOI: 10.5220/0004334106080612
Copyright
c
SciTePress
contain a hierarchy of primitive patterns. They were
classified into five (5) groups providing an average
hit ratio of 72% for buy/shell signals. Additionally,
another study made by Gaginalp and Laurent (1998),
showed that specific candlestick patterns (“three-
white-soldiers”, “three-black-crows” etc.) have
predictive capability and indicate a profit of 1%
during a two-day holding period. In contrary, in a
paper by Marshall et al., (2006), the authors found
candlestick technical analysis has no value on U.S.
Dow Jones Industrial Average stocks during the
period from 1992–2002. The common characteristic
of all previous studies is that all are dealing with a-
priori known specific patterns. A related work of
discovering unknown (hidden) profitable candlestick
patterns was carried out by Sheng et al., (2006).
They designed a Knowledge Representation Model
which held the information of three (3) successive
candlesticks using a bit codification method, called
Relative Price Movement (RPM). The training daily
data was from January 1, 1994 to December 31,
1998, of 82 stocks, while the testing data was from
January 1, 1999 to December 31, 1999. In total, in
the test set, the mined patterns occurred less than
100 times.
1.2 Position
Our position states that by using advanced
computational methods (machine learning, data
mining, computational intelligence) for pattern
recognition, one can obtain high quality actionable
information (knowledge) that no one else has.
Particularly, although the same raw information is
available to everyone, not everyone has the ability to
analyze it successfully and so there is opportunity
for profit while the market adjusts its prices. So, our
hypothesis is that while the market is mostly
efficient for large periods of time, there exist periods
of time (starting and ending at certain events) when
the efficient market hypothesis breaks down. During
these periods, profits can be realized.
Our preliminary results found more than 15,000
different patterns which can predict the direction of
next day(s) price. These hidden patterns cannot be
visually detected by a trader not only due to the
large number (thousands) of patters but also due to
complexity of information they present. There is no
common point with the well-known candlestick
patterns (which are not more than 100).This work
starts with the research question: Are there any
candlestick patterns useful beyond the well-known
candlestick patterns? If there are, how we can
discover them? How we can construct a dynamic
rule-based system to extract such information?
2 SYSTEM ARCHITECTURE
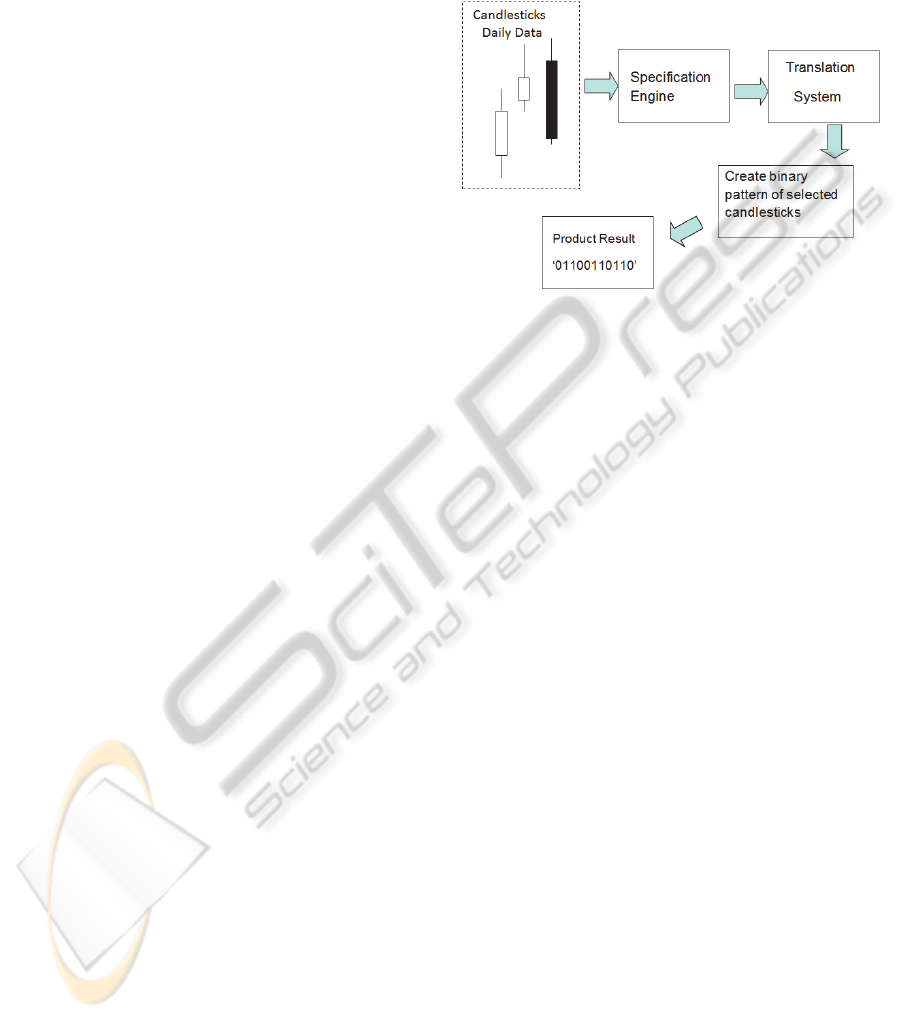
Figure 1: The Rules Codification Engine.
The system architecture consists of an engine
that produces ten (10) different methods of
generating patterns and a lot of dynamic statistical
and technical indicator filters. The specification
engine contains rule-based expressions which can
record three types of information: Bits refered to
candlestick itself, bits refered to exact position
(relationship) among two or more candlesticks and
bits presenting the strength of the price movement.
The translation system uses these rules in a specific
order to construct ten (10) types of binary products:
Pattern of 3 candlesticks (simple or detailed), Pattern
of 4 candlesticks (simple or detailed), Pattern of 5
candlesticks (simple or detailed), Pattern of 3
candlesticks with complicated codified filters,
Pattern of 4 candlesticks with complicated codified
filters, Pattern of 3 candlesticks with numerical
simple filters, Pattern of 4 candlesticks with
numerical simple filters. The created binary pattern
is stored in a relational database which corresponds
to a specific day and stock price data (open, high,
low, close of specific day). Around five million
patterns were stored in the database (4,982,994 to be
exact). For clarity, we present one bit-condification
rule for each category:
i) Condification rule for Simple pattern: if body
down of the candlestick is geater than its (high +
low)/2 return ‘1’ else return ‘0’.
ii) Condification Rule for Simple pattern
relationship: If current open price is greater than
previous close price return ‘1’ else return ‘0’.
iii) Detailed Condification Rule (strangth): If open-
lose difference is less than moving average (MA) of
UsefulPatternMiningonTimeSeries-ApplicationsintheStockMarket
609
0.6 * (open-close) of 100 previous periods return
‘00’ else if open-close difference is between 0.6 *
MA and 1.4 * MA return ‘01’ else (above 1.4 * MA)
return ‘11’.
iv) Indicator Filter Condification Rule: If Spearman
Indicator is greater than 80 return ‘0’ else return ‘1’.
iv) Indicator Signal Condification Rule: If
Directional Indicator Plus(DI+) is greater than
Directional Indicator Minus (DI-) return ‘1’ else
return ‘0’.
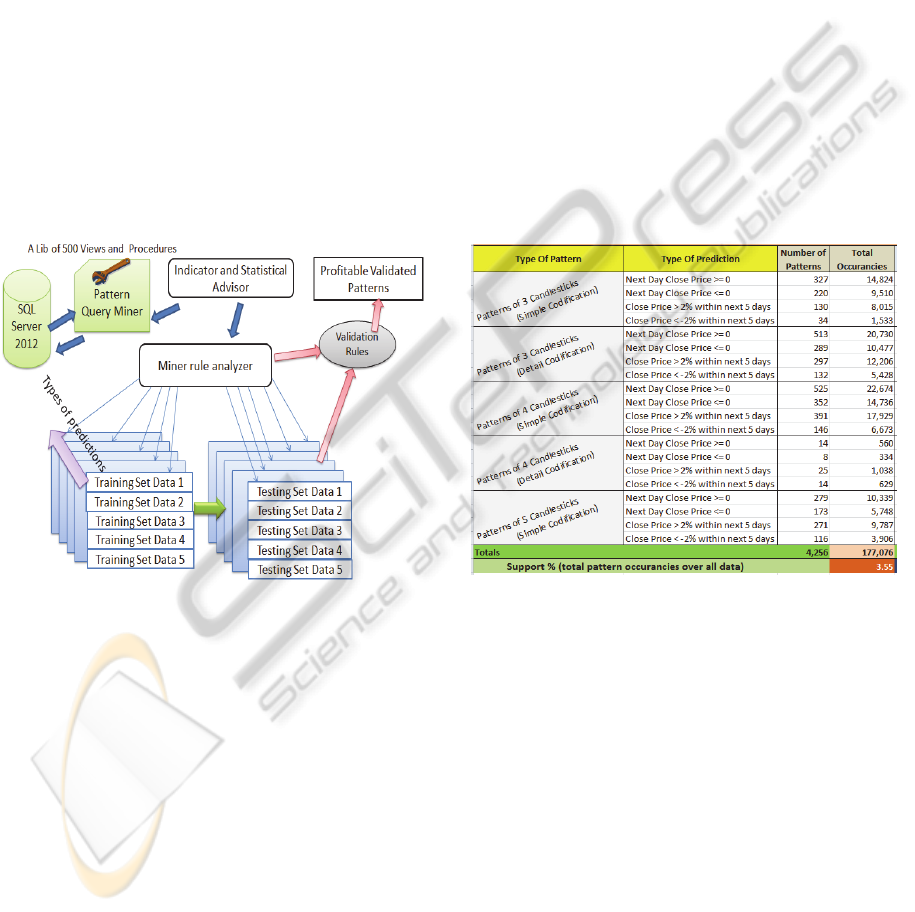
Next, the mining system rule analyzer processes the
historical candlestick patterns for each training set,
for each type of pattern and for each type of
prediction. Figure 2 displays the rule analyzer
architecture. The miner initially collects the patterns
created from each training set having at least 20 total
occurrences (depending on the complexity) and
productivity (a.k.a. confidence level) more than
65%.
Figure 2: System architecture.
The validation rule system analyzes only the
patterns found in test sets to obey minimum support
and confidence, and marks as successful only those
patterns with total occurrences more than 20 and
average productivity more than 60%. The final result
would be an intelligence database which contains all
complex patterns with their performance indicator.
This database can be a useful aid tool to make
successful trade decisions.
3 INITIAL RESULTS
The initial setup consists of 2129 stocks selected
from NYSE, NASDAQ and AMEX and daily data
from January 2001 to Aug 2012. Stocks are all from
S&P500 and NASDAQ100 (sum = 600). The rest of
stocks are the most traded having average price
greater than USD $3. Patterns are tested using 5-fold
cross validation. Preliminary results seem to be more
promising and useful that the initial expectations.
The validation rule system selected totally more than
13,600 different successful price patterns
corresponding to 708,442 occurrences of the whole
data patterns (4,982,994 rows). The total support is
about 14.2%. 4,256 different patterns were
discovered that correspond to 177,096 occurrences
with support in the database of 3.55%. The research
was then extented to include the information of the
next price open. It means that we make the trading
decision after the opening of the stock market, so
that the opening price of the stocks becomes known.
The results were very surprising. The system
discovered 9,734 different patterns corresponding to
542,196 occurrences with a support of 10.88%.
Figures 3 and 4 summarize the results.
Figure 3: Sumarization of Validated Results (no open
price involved).
We have experimented with more complex price
patterns by combining technical and statistical
indicators as filters. The results include 3,108
different complex patterns of totally 166,281
occurrences and support level of 3.34%.
Fig. 5 depicts the distribution of accuracy of
discovered patterns over support x% level, without
involving next open price. Finally, fig. 6 depicts the
distribution of accuracy of discovered patterns, this
time involving next open price. Comparing the two
charts it can easily be seen that when using the open
price we have significantly better prediction (on
average) and receive more frequently trading signals
of high accuracy.
ICPRAM2013-InternationalConferenceonPatternRecognitionApplicationsandMethods
610
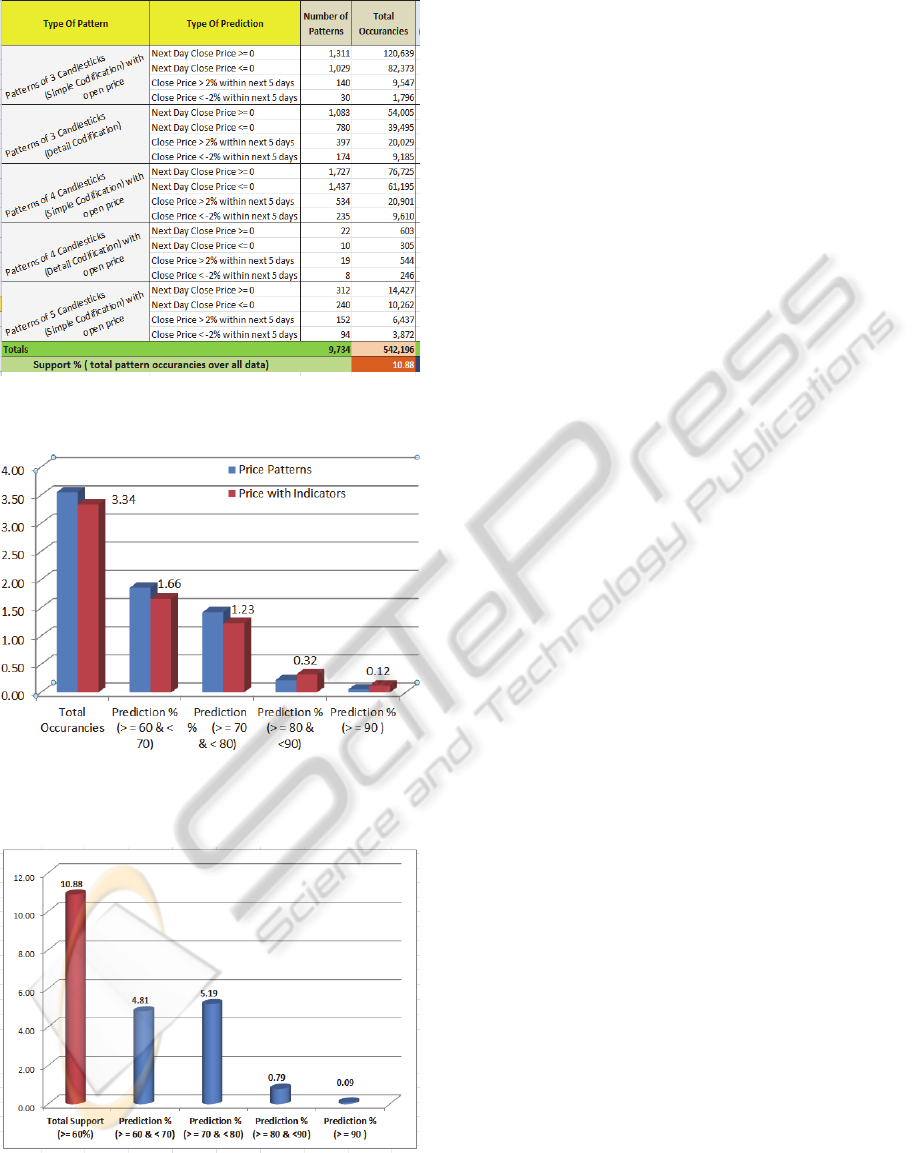
Figure 4: Sumarization of Validated Results (with open
price involved).
Figure 5: Distribution of accuracy of validated price
patterns vs combined with indicators (open price of next
day not considered).
Figure 6: Distribution of accuracy of validated patterns
(considering open price of next day).
4 CONCLUSIONS, FUTURE
WORK
We have described the architecture and initial
implementation of an early prototype pattern mining
system that is capable of processing a very large part
of the existing stock-market (NYSE, NASDAQ, and
AMEX) of 2,129 stocks and daily historical data
from January 2001 to Aug 2012 and produce highly
accurate patterns without resorting to the use of any
templates to guide its search. The initial results are
very encouraging and show that such a system can
significantly enhance the performance of current
trading systems that only take into account a much
smaller portion of the markets’ historical data
available today.
Further, the system can be improved by
involving other type of markets as well as using
intraday time frame patterns (e.g. 1 min, 5 min, etc).
Additionally, there are a lot of different ways of
involving the pattern recognition in trading systems.
This pattern prediction system could be used as
stock selector system in creating a portfolio and
using long/short strategy.
REFERENCES
Alexander, S. S., 1961. Price movements in speculative
markets: trends or random walks, Ind. Mgmt. Rev.,
vol.2, pp. 7-26.
Bessembinder H. and K. Chan, 1995. The profitability of
technical trading rules in the asian stock markets, Pac-
Bas. Fin. J., 3(2-3):257-284.
Bessembinder, H., Chan, K., 1998. Market efficiency and
the returns to technical analysis, Fin. Mgmt. 27:5-17.
Brock, W., Lakonishok, J., LeBaron, B., 1992. Simple
technical trading rules and the stochastic properties of
stock returns, J. of Fin., 47:1731-1764.
Bulkowski, T. N., 2008. Encyclopedia of Candlestick
Charts .2
nd
ed. John Wiley & Sons, Hoboken, NJ.
Chien, Y.-W. C., Chen, Y.-L., 2010. Mining associative
classification rules with stock trading data – a GA-
based method. Knowl.-bas. Sys., 23:605-614.
Constantinides, G. M., Harris, M., Stulz, R., 2003.
Handbook of the Economics of Finance. 1
st
ed.
Elsevier, Amsterdam.
Fama, E. F., 1970. Efficient capital markets: A review of
theory and empirical work, J. of Fin., 25:383-417.
Gagilalp, G., Laurent, H., 1998. The predictive power of
price patterns. App. Math. Fin. 5:181-205
Jensen M. C., Bennington, G. A., 1970. Random walks
and technical theories: Some additional evidence, J. of
Fin., 25(2):469-482.
Lee, K. H., Jo, G. S., 1999. Expert system for predicting
stock market timing using a candlestick chart. Exp.
UsefulPatternMiningonTimeSeries-ApplicationsintheStockMarket
611

Sys. Appl. 16:257-364.
Marshall, B. R., Young, M. R., Rose, L. C., 2006.
Candlestick technical trading strategies: can they
create value for investors? J. Bank. Fin. 30:2303-2323.
Lo, A. W., Mamaysky, H., Wang, J., 2000. Foundations of
technical analysis: Computational Algorithms,
Statistical Inference, and Empirical Implementation, J.
of Fin., 55:1705 – 1770.
Pruitt S.W., White, R.E. 1988. The crisma trading system:
who says technical analysis can't beat the market? J. of
Portf. Mgmt. 14:55-58.
Sheng, Y. P., Hou W. C., Chen, Z. 2006. Mining for
profitable patterns in the stock market. In:
Encyclopaedia of Data Warehousing and Mining, Idea
Group Inc, 2006
Zhang et al., 2010. A real-time hybrid pattern matching
scheme for stock time series. Proc. 21
st
Australasian
Conf. on Database Technologies 104:161-170.
Zvi Bodie, Kane A., Marcus A. J., 2009. Investments. 8
th
ed. McGraw-Hill/Irwin, NY, NY.
ICPRAM2013-InternationalConferenceonPatternRecognitionApplicationsandMethods
612
