
Feasibility Study of Heartbeat Detection from Optical Interferometric
Signal by using Convolution Kernel Compensation
Sebastijan Šprager, Aleš Holobar and Damjan Zazula
University of Maribor, Faculty of Electrical Engineering and Computer Science,
Smetanova ulica 17, SI-2000 Maribor, Slovenia
Keywords: Heat Rate Estimation, Optical Interferometer, Unobtrusive Monitoring of Human Vital Signs, Biomedical
Signal Processing, Latent Variable Analysis, Convolution Kernel Compensation.
Abstract: In this paper, a feasibility of detecting heartbeat from optical interferometric signal by using convolution
kernel compensation (CKC) latent variable analysis (LVA) approach is examined. Optical interferometer is
a very sensitive device that detects physical elongation of the optical fibre. When used as bed or body
sensor, mechanical and audible activity of the heart produce perturbations in the detected signal that, when
extracted by LVA, allows completely unobtrusive monitoring of heartbeat. We performed an experiment
with fourteen young healthy participants. They exercised on a cycle ergometer until they reached their
submaximal heart rate (85 % of maximal heart rate). During resting period after the exercise optical
interferometric signal was acquired along with the referential ECG signal. CKC-based decomposition of 1-
minute-long signal segments was performed. The obtained efficiency (sensitivity of 97.8 ± 3.0 %, precision
of 93.6 ± 7.6 %) and accuracy (reference-to-detected beat delay of 167 ± 65 ms) are within acceptable limits
indicating that unobtrusive heartbeat detection using the proposed approach is feasible.
1 INTRODUCTION
Classical heartbeat monitoring approaches, such as
electrocardiography (ECG) and plethysmography
require trained physician and controlled clinical
environment to perform measurements with a
number of sensors and electrodes. This procedure
can be uncomfortable, disturbing and impractical for
both the patient and physician. In contrast,
methodologies for unobtrusive monitoring of
heartbeat deploy different types of sensors that can
detect electrical, audible or mechanical heart
activity, even when there is no direct contact
between the sensor and person’s body. A short
survey of such methodologies is given in (Šprager
and Zazula, 2012).
Monitoring of heartbeat by using optical
interferometer has already been examined in
(Šprager et al., 2010); (Šprager et al., 2011);
(Šprager et al., 2012). However, all published
approaches are based on linear processing of a single
interferometric signal (single-input-single-output
system - SISO). By applying nonlinear transforms to
an interferometric signal, additional information
may be emphasised. Taking such signal transforms
as additional observations in parallel with the
original single-channel signal, i.e., by forming
multiple-input-multiple-output (MIMO) system,
multichannel decomposition methods become
applicable. The aforementioned signal extension has
already been proposed in (Šprager et al., 2012),
where a new approach for heartbeat detection from
extended interferometric signal has been introduced
by computing so called activity index of multi-
channel interferometric signal (Šprager et al., 2012).
However, activity index only calculates the
Mahalanobis distance between the detected
interferometer patterns and does not extract the
investigated phenomena, i.e, perturbations due to the
heartbeat, from the measurements.
Recently, LVA has been demonstrated as one of
the most promising tools to analyse multichannel
compound signals, including nonlinear instantaneous
and convolutive mixtures. In this study, we
experimented with previously published CKC
decomposition approach that has demonstrated its
great capability in decomposing multichannel
surface electromyographic signals into constituent
motor unit action potential trains (Holobar et al.,
2009). However, this approach has never been
396
Šprager S., Holobar A. and Zazula D..
Feasibility Study of Heartbeat Detection from Optical Interferometric Signal by using Convolution Kernel Compensation.
DOI: 10.5220/0004328303960400
In Proceedings of the International Conference on Bio-inspired Systems and Signal Processing (BIOSIGNALS-2013), pages 396-400
ISBN: 978-989-8565-36-5
Copyright
c
2013 SCITEPRESS (Science and Technology Publications, Lda.)

applied to nonlinear instantaneous mixtures of
interferometric signals.
The manuscript begins with a description data
model and methodology in Section 2. Section 3
explains experimental protocol and evaluates the
obtained results. Discussion and conclusions are
made in Section 5.
2 METHODOLOGY
2.1 Data Model
Optical interferometry is a well-known principle of
measuring external stimuli that triggers changes of
optical-fibre length (Udd, 1991). Due to their high
sensitivity, such sensors can detect micrometric or
even nanometric changes. As a result, tiny variations
of pressure against optical fibre generate high
changes in optical interferometric signal.
The use of optical interferometer for heartbeat
monitoring has already been demonstrated in
(Šprager et al., 2010); (Šprager et al., 2011);
(Šprager et al., 2012). When in direct or indirect
contact with a subject, mechanical or audible
activity of myocardium causes perturbations in
interferometric signal i(n).
In this study, the Michelson optical
interferometer was used combined with laser diode
as an optical source emitting the light with the
wavelength of 1300 nm. This interferometer has a
cosine transfer characteristics with one period
corresponding to the fibre length change that is
equivalent to the half wavelength of the optical
source.
When using optical interferometer for heartbeat
monitoring, we observe minute changes of the
sensing fibre length, caused by heartbeats s(n) along
with all other impacts on fibre elongation
n
, i.e.
noise from the environment, thermal drift, etc:
() cos () ()in An sn n
(1)
Analytic representation of i(n) can be obtained by
using Hilbert transform:
() () ()
()cos () () sin () ()
xn in j H in
A
n snnjsnn
(2)
where j stands for imaginary unit and H[.] for the
Hilbert transform. The phase angle of analytic signal
x(n) can be expressed from (2) as
sin ( ) ( )
tan () tan () ()
cos ( ) ( )
sn n
nsnn
sn n
(3)
Thus,
1
() tan ()nsn n xn
(4)
When impact of noise and movement artefacts
n
is negligibly small, (4) evolves into:
nsn
(5)
Therefore, signal s(n) is obtained by computing
1
tan ( )
x
n
. The latter produces wrapped phase
n
that must be unwrapped for further decomposition
needs.
2.2 Decomposition of Demodulated
Interferometric Signal by CKC
Multichannel CKC is suitable for decomposition of
linear mixtures of signals comprising finite-length
symbols (Holobar and Zazula, 2007). The observed
symbols are first modelled as channel responses in a
MIMO system, while the channel inputs are
conceptually considered sparse positive pulse trains
(PTs) carrying the information about the symbol
arising times. As demonstrated in (Šprager and
Zazula, 2012), in heartbeat observations, the large
portion of repeating symbols corresponds to fibre-
optic responses to the heartbeats.
Fibre-optic observation s(n) is a single-channel
signal. As such, it is not suitable for the CKC
processing and needs to be transformed to multiple
observations. The latter can be achieved by
nonlinear operation, such as by using Hadamard
entrywise products of s(n) for different lags l.
For each
1, ,mM
and all possible
combinations of lags
0, ,
i
lL
, i=1,…,m, the
entrywise product
1 m
s
nl snl
is
calculated between the m lagged versions of s(n).
Obtained set of signals is denoted with s
M,L
(n). This
nonlinear extension of single-channel observation
enhances the non-overlapped signal components
(Istenič and Zazula, 2010).
In the following step, CKC-based decomposition
method is applied to signal s
M,L
(n). Outputs from the
CKC decomposition are reconstructed PTs that
indicate symbol arising times.
Fig. 1.a shows three individual heartbeats as
detected by three different PTs (depicted by black
asterisks, blue crosses, and green circles) along with
referential ECG signal drawn in red. It is evident
that a single heartbeat was decomposed into three
different symbols. We assume that these symbols are
consequence of different contributions in
interferometric signal due to mechanical and audible
FeasibilityStudyofHeartbeatDetectionfromOpticalInterferometricSignalbyusingConvolutionKernelCompensation
397
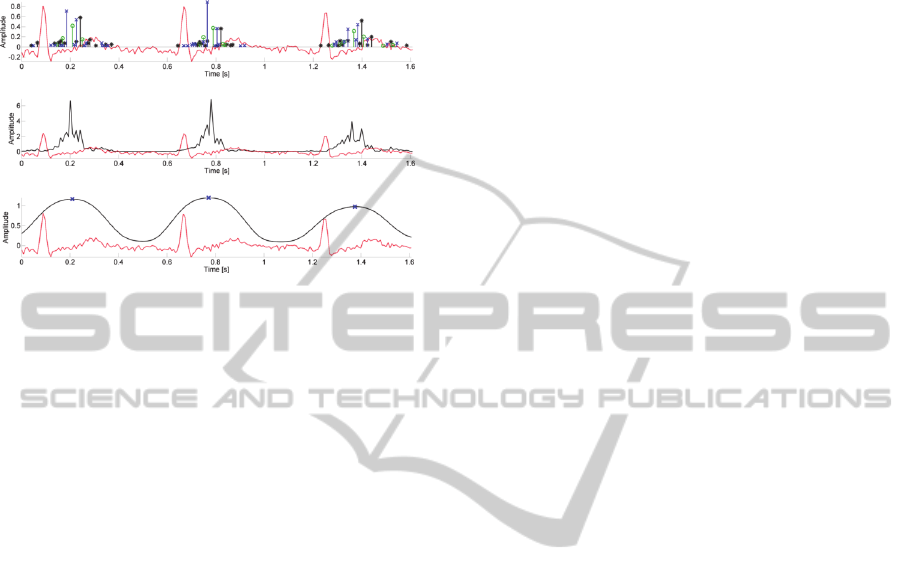
myocardium activity (Šprager and Zazula, 2012).
However, in multivariate observations s
M,L
(n), new
symbols can also be generated by aforementioned
nonlinear extension of single observation s(n).
a)
b)
c)
Figure 1: Heartbeat detection using CKC method: (a)
Three pulse trains (PTs) obtained by the CKC method are
depicted by asterisks, crosses, and circles; (b) marginal
energy of PTs in 1.a over time; (c) smoothed version of
signal from 1.b by using local regression with weighted
linear least squares. Detected heartbeats are denoted as
local maxima. Referential ECG is depicted in all the three
panels.
Fig. 1.a confirms that the pulses from the same
PT more or less occur at the same time instant after
referential R waves (see pulse sequence of different
colours for each of three heartbeats). Fig. 1.b shows
marginal energy of PTs over time, underpinning the
locations where pulses concentrate and point out
individual heartbeats. From this point of view, the
heartbeat detection step is trivial. The heartbeat time
instants can be estimated as local maxima of
marginal energy of PTs over time.
In this study, the PT marginal energy was
additionally smoothed by local regression using
weighted linear least squares with window length
corresponding to the highest expected heart rate, i.e.
120 beats per minute (Fig. 1.c).
3 EXPERIMENTS AND RESULTS
The proposed method was applied to the signal set
obtained by experimental protocol described in
(Šprager and Zazula, 2012). The experiment
involved 14 subjects, 11 males and 3 females (age of
30 ± 9 years, height of 176 ± 6 cm, and weight of 77
± 15 kg), and was performed on a bed with inserted
6 m long optical fibre. Referential ECG signal was
acquired with four electrodes firmly attached to the
subject’s extremities. ECG lead II was taken as the
referential one. Each of the observed persons was
asked to cycle an ergometer until their submaximal
heart rate (85 % of maximal heart rate, which
computes as 220-age) was achieved. Afterwards,
subjects immediately lied down on the mattress (in
the supine position) and were asked to lie still during
4 minutes long acquisition of interferometric and
referential ECG signals. With such a protocol,
gradual change of heart rate was obtained, which
exposed the detection approach to an aggravated
situation.
Signals were acquired by costume made four-
channel sampling device and digitised by a 12-bit
A/D converter built in the microcontroller
PIC18F4458. Interferometric signals were sampled
at 50 kHz, whereas the referential ECG signals were
sampled at 196 Hz. The two signal sequences were
synchronized by hardware. It has been shown
(Šprager and Zazula, 2012) that, in demodulated
signal, the energy of heartbeat contributions due to
mechanical and audible activity of myocardium is
below 60 Hz. Therefore, after frequency
demodulation of interferometric signal, all signals
were down-sampled to 125 Hz.
Recorded signals were divided into four one-
minute-long segments. Each segment was then
nonlinearly extended by using entrywise products up
to the 5
th
order (M = 5) with lags up to L = 10
samples and decomposed by CKC decomposition
approach (Holobar and Zazula, 2007).
The acquired referential ECG signals were used
to validate the efficiency and accuracy of the
proposed approach. The validation step was based
on the R waves in the ECG signal as automatically
detected by the method published in (Pan and
Tompkins, 1985).
Detection efficiency was determined according
to each referential R wave. Due to delays of
mechanical activity of the heart in comparison with
the ECG signal, the heartbeats detected from the
interferometric signal fall between two consecutive
referential R waves. In the ideal case, exactly one
detected heartbeat appears in every RR interval. In
this way, all detected heartbeats can be grouped in
the following three classes:
true positive (TP) – the number of first detected
heartbeats in the RR intervals,
false positive (FP) – the number of all detected
heartbeats in RR intervals, excluding the first
heartbeat in each RR interval,
false negative (FN) – the number of all
undetected heartbeats in RR intervals.
With these classes, sensitivity (r
s
) and precision (r
p
)
were calculated as follows:
BIOSIGNALS2013-InternationalConferenceonBio-inspiredSystemsandSignalProcessing
398

TP TP
and
TP FN TP FP
sp
rr
(6)
Overall sensitivity and precision for all 14 tested
persons yielded 97.8 ± 3.0 % and 93.6 ± 7.6 %,
respectively.
As accuracy metrics, the reference-to-detected
heartbeat delays and the mean absolute error
between the length of RR intervals and the distance
between two consecutively detected heartbeats were
calculated. The stability of both metrics was
assessed by calculating their standard deviation.
The measured reference-to-detected heartbeat
delays for all subjects are shown in Fig. 2.a. When
averaged over all the participants, the overall
reference-to-detected delay yielded 167 ± 65 ms.
Mean absolute errors are shown in Fig. 2.b. The
overall mean absolute error was 79 ± 57 ms.
When measured on a standard personal computer
with 2.4 GHz 4-core Intel processor and 8 GB of
memory, the average processing time for one-
minute-long segment was 10.1 ±1.2 s.
a)
b)
Figure 2: Accuracy metrics for the proposed method
obtained from 14 participants: (a) reference-to detected
delay; (b) mean absolute error (vertical lines indicate
standard deviations).
4 DISCUSSION AND
CONCLUSIONS
Efficiency metrics for 14 subjects (Fig. 2) show that
heartbeat detection is feasible with the proposed
method. Nevertheless, in comparison to more
advanced methods (Šprager and Zazula, 2012),
obtained results indicate lower efficiency (precision
of 93.6 ± 7.6 %) as well as lower accuracy. This also
contributes to relative high overall variability of
detected heartbeat delays (±65 ms) and relatively
high mean absolute error in estimated inter-beat
interval lengths (79 ± 57 ms). The reason probably
lies in relatively high amount of symbols/PTs
comprising the multichannel observations s
M,L
(n).
While a significant portion of them reflect responses
to heartbeats, the other reflect the repeating
interferences from outer world (e.g., due to
breathing, movements etc.) This is also the main
reason why our heartbeat detection was not made
dependent on single pulses in PTs, but was based on
observation of group of pulses as obtained by
calculating marginal energy of all PTs.
Accuracy of heartbeat detection is additionally
degraded by smoothing operation presented in Fig.
1.c. To avoid smoothing, the detection step should
focus on the individual PT and select only those that
represent the actual heartbeats. This is not a trivial
task. Thus, further research of interferometric signal
properties, their nonlinear extensions and their CKC-
based decomposition is required.
The sampling frequency of demodulated
interferometric signal used in the proposed method
was set to 125 Hz, which is four times lower than in
similar approaches (Šprager and Zazula, 2012,
Šprager et al., 2010, Šprager et al, 2011, Šprager et
al., 2012). This is not a limitation as the down-
sampled interferometric signal still preserves all
spectral energy of components induced by
mechanical and audible activity of myocardium
(Šprager and Zazula, 2012). The selected sampling
frequency was also low enough to guarantee
acceptable decomposition time – about 10 s for 60-
second-long signals.
Considering chosen segment length of
interferometric signal, it must be emphasised that
CKC decomposition relies on statistical signal
properties. This means that the signals must be long
enough to contain adequately high number of
symbol repetitions. One-minute-long segments
turned out to be long enough for our decomposition
purposes, but hindered the tracking of heartbeats in
real-time. The real-time version of CKC method is
currently under development and is yet to be tested
on interferometric signals.
Finally, it would be interesting to use the
proposed method with multi-array sensors that, in
contrast to the optical sensor proposed in this paper,
produce multiple observations.
In conclusion, method for heartbeat detection
using decomposition approach based on convolution
kernel compensation has been introduced. Although
the efficiency and accuracy are slightly lower than in
similar detection methods, the obtained results show
great potential in unobtrusive heart rate
measurements. The proposed approach also opens a
new way of decomposing fibre-optic interferometric
signals.
FeasibilityStudyofHeartbeatDetectionfromOpticalInterferometricSignalbyusingConvolutionKernelCompensation
399

REFERENCES
Šprager, S., Zazula, D., 2012. Heartbeat and respiration
detection from optical interferometric signals by using
a multimethod approach. IEEE Transactions on
Biomedical Engineering, 59, 10, 2922-2929.
Šprager, S., Đonlagić, D., Zazula, D., 2010. Monitoring of
basic human vital functions using optical
interferometer. 10
th
International Conference on
Signal Processing, 2, 1738-1741.
Šprager, S., Đonlagić, D., Zazula, D., 2011. Heart beat
monitoring using optical interferometric signal and
pseudo Wigner-Ville distribution, 7
th
International
Conference on Information Technology and
Applications, 271-275.
Šprager, S., Đonlagić, D., Zazula, D., 2012. Heartbeat
detection applying activity index on optical
interferometric signal. 11
th
WSEAS International
Conference on Instrumentation, Measurement,
Circuits and Systems, 77-82.
Holobar, A., Zazula, D., 2007. Multichannel Blind Source
Separation Using Convolution Kernel Compensation.
IEEE Transactions on Signal Processing, 55, 9, 4487-
4496.
Holobar, A., Farina, D., Gazzoni, M., Merletti, R., Zazula,
D., 2009. Estimating motor unit discharge patterns
from high-density surface electromyogram. Clinical
Neurophysiology, 120, 3, 551-562.
Istenič, R., Zazula, D., 2010. Segmentation of Compound
Signals Using Higher-Order Activity Indexes.
International journal on circuits, systems and signal
processing, 4, 3, 120-128.
Udd, E., 1991. Optic Sensors – An Introduction for
Engineers and Scientist, Joh Wiley & Sons.
Pan, J., Tompkins, W. J., 1985. A real-time QRS detection
algorithm. IEEE Transactions on Biomedical
Engineering, 3, 230-236.
BIOSIGNALS2013-InternationalConferenceonBio-inspiredSystemsandSignalProcessing
400
