Interactive Rendering of Complex 3D-Treemaps with a Comparative
Performance Evaluation
Matthias Trapp, Sebastian Schmechel and J
¨
urgen D
¨
ollner
Hasso-Plattner-Institut, University of Potsdam, Potsdam, Germany
Keywords:
3D-Treemaps, Real-time Rendering, Performance Evaluation.
Abstract:
3D-Treemaps are an important visualization technique for hierarchical views. In contrast to 2D-Treemaps,
height can be used to map one additional attribute of the data items. Using the Treemap technique in com-
bination with large datasets (more than 500k) a fast rendering and interaction techniques that are beyond
collapsing/uncollapsing nodes is still one of the main challenges. This paper presents a novel rendering tech-
nique that enables the image synthesis of geometrical complex 3D-Treemaps in real-time. The fully hardware
accelerated approach is based on shape generation using geometry shaders. This approach offers increased
rendering performance and low update latency compared to existing techniques and through it enables new
real-time interaction techniques to large datasets.
1 INTRODUCTION
Motivation The concept of treemaps is an im-
portant tool for visualization of large hierarchical
datasets. Its extension to the third dimension enables
a number of applications, like metaphor-based visual-
ization that support the user’s mental model creation
of abstract datasets and through it the memorability
of items as shown in InformationPyramids (Andrews
et al., 1997) and CodeCity (Wettel and Lanza, 2008).
However, the additional dimension comes with ad-
ditional concerning the geometric representation and
image-synthesis. In particular, this introduces chal-
lenges for the interactive rendering of complex 3D-
Treemaps. Complex 3D-Treemaps are described by a
large number of treemap items, e.g., more than 500k
(Fig. 1), and diverse attribute mappings to color and
height of these items.
Basically the interaction in 3D-Treemaps can be
grouped in three main tasks: (a) Navigational tasks
(e.g., Zooming and Panning), (b) Explorational tasks
(e.g., implicit and explicit visualization of nodes at-
tributes and informations), and (c) Data-Modification
tasks (adding or removing nodes). While naviga-
tion and exploration tasks are independent from the
complexity of the underlying layout algorithm, Data-
Modification tasks result in a recomputation of the
layout. Nevertheless the degree of user experience
for layout-independent tasks are highly connected to
the rendering run-time (Correa et al., 2003). Bladh
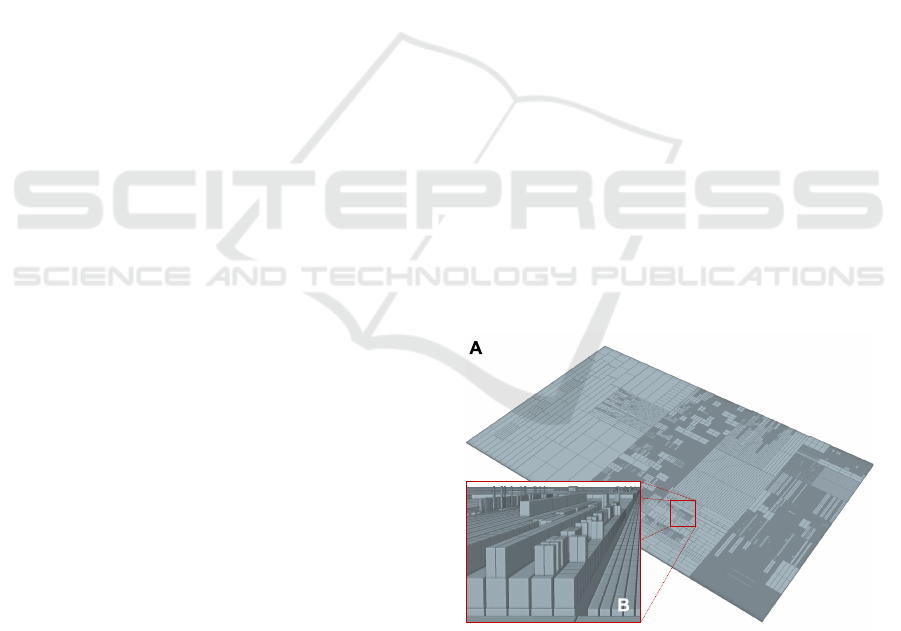
Figure 1: An example of a complex 3D-Treemap with
614k items rendered with the presented shape generation
approach in real-time. It comprises over six million render-
ing primitives.
et al. present a visualization techniques that support
interactive (real-time) image synthesis and allow nav-
igation and exploration tasks through animated transi-
tions (Bladh et al., 2005). In addition to that, a change
or update of mappings on rendered treemap artifacts,
require a high update performance.
Rendering of Complex 3D Scenes. To summarize,
despite the performance of the layout algorithm and
dynamic update of treemaps, the efficient rendering
remains a challenge. The efficient interactive render-
ing of complex 3D-Treemaps depends on the follow-
165
Trapp M., Schmechel S. and Döllner J..
Interactive Rendering of Complex 3D-Treemaps with a Comparative Performance Evaluations.
DOI: 10.5220/0004290101650175
In Proceedings of the International Conference on Computer Graphics Theory and Applications and International Conference on Information
Visualization Theory and Applications (GRAPP-2013), pages 165-175
ISBN: 978-989-8565-46-4
Copyright
c
2013 SCITEPRESS (Science and Technology Publications, Lda.)

ing three aspects concerning the rendering techniques
as well as the underlying data representation:
Rendering Performance. The run-time complexity
for the rendering of a single frame must be small
enough to support interactive frame rates for a
high number of treemap items. The rendering per-
formance often depends on the geometric repre-
sentation of the datasets.
Update Performance. The update performance is
determined by the number of changes in treemap
representation required for a specific visualiza-
tion. Thus, increasing the update performance
contributes to the available per-frame rendering
budget.
Memory Consumptions. The memory consump-
tions (both in main and video memory) of a 3D-
Treemap representation determines the maximum
amount of 3D-Treemap items that can be rendered
without using out-of-core mechanisms, which in-
troduce additional IO operations and more com-
plex implementations. Therefore, the space com-
plexity of a representation should be as compact
as possible.
Thus, the main goals of a rendering technique that
facilitate the interactive rendering of complex 3D-
Treemaps are the reduction of rendering, update, and
storage costs.
Contributions. Concerning the challenges stated
above, this paper presents a novel, fully hardware-
accelerated rendering technique that is capable of per-
forming real-time image-synthesis for complex 3D-
Treemaps within a single rendering pass. The ap-
proach is based on server-side shape generation, i.e.,
the geometry of 3D-Treemap items is created on
graphics hardware. This reduces bandwidth and in-
creases uptime performance, as well as enables a
compact representation of a 3D-Treemap with a min-
imal memory footprint. Its implementation is based
on OpenGL and the OpenGL Shading Language (Se-
gal and Akeley, 2012); an API which is of broad use
within scientific visualization. The presented con-
cepts can also be transfered to D3D compatible ap-
plications. To summarize, this paper makes the fol-
lowing contributions to the community:
1. Presents a novel rendering technique especially
suitable for rendering complex 3D-Treemaps in
real-time. This technique is especially suitable for
interaction metaphors without recomputing the
treemap layout.
2. Describes the implementation of different concur-
rent rendering techniques for the interactive ren-
dering of complex 3D-Treemaps.
3. Evaluates and compares these rendering tech-
niques with respect to rendering performance, up-
date performance, and memory consumptions.
The remainder of this paper is structured as follows.
Section 2 reviews related and previous work with re-
spect to 3D-Treemaps and rendering approaches. Sec-
tion 3 describes the shape generation approach and
existing techniques suitable for the interactive render-
ing of complex for 3D-Treemaps. Section 4 gives
implementation details. Section 5 presents a perfor-
mance analysis and comparison of the rendering tech-
niques. Finally, Section 6 concludes the paper.
2 RELATED WORK
Treemaps are a common used technique for space-
restricted visualization in the last two decades. The
original algorithm presented by Shneiderman recur-
sively splits parent nodes alternating in horizontal and
vertical direction by their child nodes (Shneiderman,
1992). One major disadvantage of the Slice’n Dice
algorithm is the creation of unfavorable aspect ratios
of the node representations. Bruels et al. as well as
Bederson and Shneiderman counter the problem with
Squarified- (Bruls et al., 2000) and Strip-Treemap
(Bederson et al., 2002) layouts. Fekete and Plaisant
use treemaps to visualize datasets with about one mil-
lion nodes. In addition to visualize the structure of the
hierarchy, the items’ attributes were also visualized
by mappings onto size and color (Fekete and Plaisant,
2002). The increasing number of items in large hier-
archies leads to perceptional questions about Treemap
visualizations, e.g., how much effect does the width of
a nodes’ border have on the ability to extract the hier-
archical structure of the underlying data (Kong et al.,
2010).
The first extension of 2D-Treemap layout algo-
rithms to the third dimension are presented in the
StepTree by Bladh et al.. They extend the initial
algorithm by stacking the graphical representations
of subdirectories on top of its parent’s one (Bladh
et al., 2004). In a comparative study between the
StepTree and its corresponding 2D-Treemap users
significantly performed better in tasks of interpretat-
ing the hierarchical structure, while preserving per-
formance in other interpretational and navigational
tasks. Wettel and Lanza use 3D-Treemaps to create
a metaphorical view on software system artifact hi-
erarchies with CodeCities (Wettel and Lanza, 2008)
by mapping additional information to the height of
leaf nodes. This leads to a treemap-based layout
with graphical representations of software system ar-
tifacts as high and low “buildings” grouped in areas
GRAPP2013-InternationalConferenceonComputerGraphicsTheoryandApplications
166
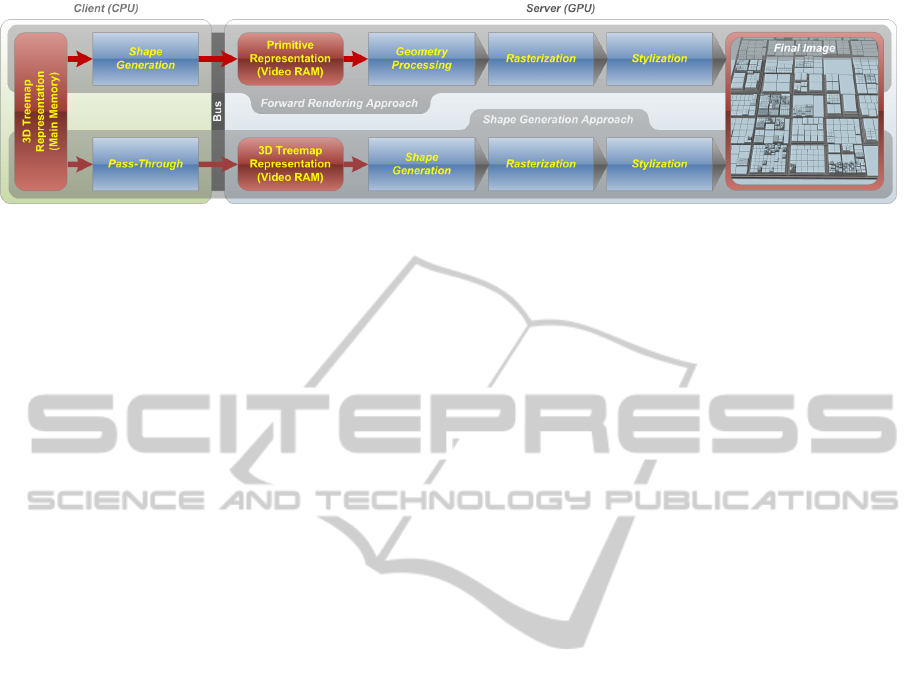
Figure 2: Comparison of different rendering pipelines for client-side (CPU) shape generation (top) and our server-side shape
generation (bottom).
of the “software city”. Several other publications ad-
dresses the use of 3D-Treemaps in Software Visual-
ization in depth (Liggesmeyer et al., 2009; Bohnet
and D
¨
ollner, 2011). Bohnet and D
¨
ollner also men-
tioned that the use of realistic rendering effects, e.g.,
shadowing, in 3D-Treemaps support the users’ per-
ception of the elements as distinguished ones (Bohnet
and D
¨
ollner, 2011). All of the aforementioned pub-
lications uses 3D-Treemaps by extruding the nodes,
calculated with a 2D-layout algorithm, by one addi-
tional attribute mapping. In addition to this classical
approach there exist a variety of modifications and ex-
tensions, e.g., 3D-Polar Treemaps, Treecube or Col-
lector’s Box Treemap (Schulz et al., 2011), one can
categorize by four attributes (a) containment relation-
ship, (b) used graphics primitives, (c) layout method
and (d) alignment (Schulz et al., 2007).
Even though the visualization of a wide range
of large hierarchical datasets, e.g., software sys-
tems, economy data, is frequently studied, the inter-
action techniques used in this field are straightfor-
ward. Appearing techniques in 3D-Treemaps are the
selection of nodes and leafs, as well as the color-
ing/highlighting of nodes (Wettel and Lanza, 2008).
Sud et al. present a solution to provide interactive
rendering, navigation and animation of dynamically
changing 2D-Voronoi-Treemaps by using a GPGPU-
based rendering technique (Sud et al., 2010).
With an increasing amount of nodes the geomet-
rical complexity of treemap grows directly, resulting
in the need of general computer graphical techniques
to create an interactive visualization. One way to
achieve a lower memory footprint and a faster ren-
dering is the algorithm for triangle strip optimization
shown by Evans et al. (Evans et al., 1996).
3 RENDERING TECHNIQUES
The rendering techniques in this paper is a combina-
tion of standard forward rendering and deferred shad-
ing (Liktor and Dachsbacher, 2012). Despite interme-
diate rendering (also know as the obsolete interme-
diate mode in former OpenGL specifications), three
types of techniques are suitable for the interactive ren-
dering of complex 3D-Treemaps: (1) using (indexed
and non-indexed) vertex buffer objects (Section 3.3),
geometry instancing variants (Section 3.4), as well as
a novel server-side shape generation approach (Sec-
tion 3.2).
For clarification, Figure 2 shows a comparison of
the different, simplified pipelines suitable for render-
ing geometrical complex 3D-Treemaps. The illustra-
tion on top shows classical forward rendering pipeline
as used for the existing rendering approaches. The ge-
ometry required for the rendering of 3D-Treemaps is
generated on the client side (CPU). This implies the
the generated geometry must be transfered to server
every time the representation changes, e.g., due to
changes in the layout or in the thematic mapping. We
denote this pipeline model as client-side shape gener-
ation. In contrast thereto, the illustration on the bot-
tom shows the rendering pipeline for the presented
server-side shape generation. The advantage of this
approach lies in the deferred shape generation on the
graphics board (GPU) for only items that are visible
in the current view frustum.
3.1 Preliminaries
All rendering techniques make the following assump-
tions on the structure and visualization of a 3D-
Treemap. A 3D-Treemap can be considered as a spe-
cial case of 2.5D virtual environment. Such VE is
usually not viewed from below, thus, we do not con-
sider the bottom faces of a treemap item important.
Further, for the simplification of the geometric
representation, it is assumed that 3D-Treemap items
are aligned with world space coordinate axis. Fur-
thermore, we assume that attributes for thematic map-
pings vary usually per treemap item as well as that
thematic mappings vary more often than the layout of
a 3D-Treemap changes.
InteractiveRenderingofComplex3D-TreemapswithaComparativePerformanceEvaluation
167

Layout & Thematic Mapping. There are several
layout approaches for 2D-Treemaps (e.g., squarified
(Bruls et al., 2000) or strip layouts (Bederson et al.,
2002)). For simple 3D-Treemaps the layout costs
are usually higher than the rendering costs. Since,
3D-Treemaps are basically 2D-treemaps with an ad-
ditional height value per item, existing layout ap-
proaches can be used. Thus, the layout-dependent at-
tributes of a 3D-Treemap item are 2D position (hor-
izontal and vertical) and 2D dimensions (width and
height).
However, changes in the layout caused by modi-
fication of the underlying data can be separated from
changes in the visual appearance due to altering the-
matic mappings (layout-independent attributes): both
can occur at different frequencies. Consequently, but
depending on the respective applications, one can as-
sume that separate handling of layout-depended and
layout-independent attributes has influence on the
update performance and thus, the rendering perfor-
mance.
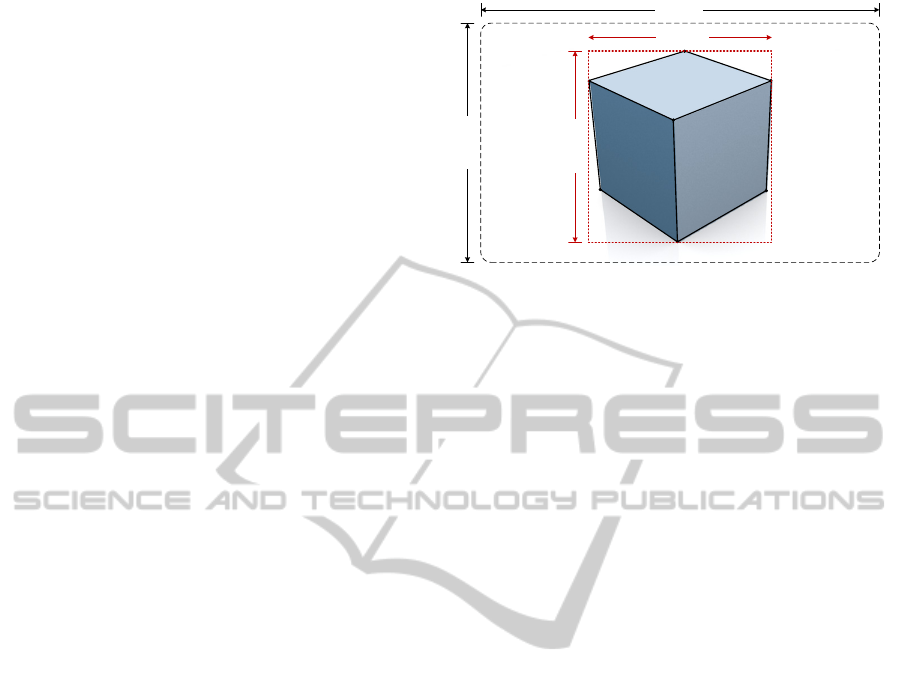
Figure 3: Comparison of the geometric representation for a
2D (left) and a 3D- treemap item (right).
3D-Treemap Items. The additional dimension in-
troduces additional geometric complexity, i.e., geo-
metric primitives. A 3D-Treemap item requires three
to five (depending on the use of backface-culling)
times more geometry than a 2D equivalent. In con-
trast to 2D-Voronoi-Treemaps (Balzer and Deussen,
2005), classical 2D-Treemaps (Bruls et al., 2000)
have a squared footprint that can be geometrically
represents using two triangles (Fig. 3 left). Extending
the 2D-Treemap concept to the third dimension intro-
duces at minimum five times more geometric primi-
tives (Fig. 3 (right)).
For complex 3D-Treemaps an important goal is
to provide a minimal representation, with a small-
as-possible memory footprint on client. The size of
the item representation determines the update perfor-
mance. Further, memory alignment should support
fast client-server updates.
In contrast, to Voronio or cicurlar treemap ele-
ments, a standard treemap item is represented using
a 3D box. A treemap item T of a treemap T can
be expressed as: T = (P, D,C, id, F). The position
P = (x, y, z) ∈ R
3
represents the origin of the cube, the
extends by dimension D = (w, h, d) ∈ R
3
, the color
C ∈ [0, 1] ⊂ R
3
. In addition thereto, a treemap item
can store a number of flags F, describing properties
such as the hierarchy depth or if it is a leaf node. The
unique object identifier id enables the usage of indi-
rections during rendering, i.e., if attributes changes:
no geometry update is required.
Based on the previous layout assumptions, the
presented concept uses two buffers that can be up-
dated separately to save bandwidth and update time
for animated treemaps (Section 4). One buffer rep-
resents the static layout-dependent information (i.e.,
x, y, w, h) while the other one contains the information
about possibly dynamic, layout-independent proper-
ties (i.e., z, d,C).
Compact Representation The major goal is to pro-
vide a compact representation of the 3D-Treemap that
is suitable for client and server storage by conveing
high frame rates at the same time. Figure 5 shows
the used geometry template for an indexed represen-
tation for a cube without a bottom face. It only re-
quires 8 vertices and 12 indicies to describe ten faces.
To summarize, the compact representation also en-
ables a lossless compression for 3D tree maps. For
example, table 1 compares the memory footprints for
n treemap items described by the number a of 32bit
floating point attributes, with a 4Byte representation
of each one. It achieves a compression ratio of 1:2.5
over and index vertex representations and a ratio of
1:3.75 over non-index vertex representations.
This form of lossless compressed representation can
especially be applied for transferring geometric data
using the world wide web. It can become especially
suitable for client-side rendering using WebGL, if ge-
ometry shader functionality will be supported in fu-
ture specifications.
3.2 Shape Generation Approach
This fully GPU accelerated, single-pass rendering ap-
proach is based on the idea of Instance Culling or In-
stance Cloud Reduction (R
´
akos, 2010), which origi-
nally comprises a culling pass and a rendering pass.
We modify the concept by omitting the culling pass
and by shifting the geometric representation and the
assembly of each geometric instance completely to
the geometry shader.
Figure 4 shows an simplified overview of the ren-
GRAPP2013-InternationalConferenceonComputerGraphicsTheoryandApplications
168
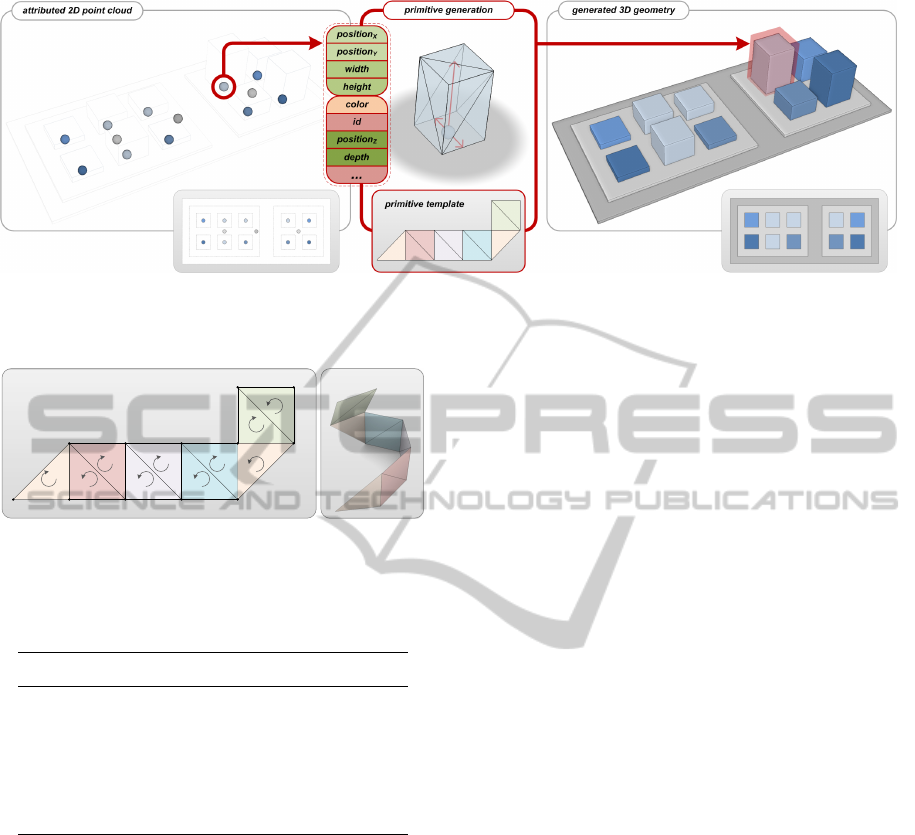
Figure 4: Simplified rendering pipeline for the shape generation approach presented in this paper. An attributed point cloud
is converted to cubes using a primitive template in the geometry shader stage. The insets shows the test datasets from a 2D
perspective.
+X -Z -X
+Y
AB
C
D
E
F
G
H
I
J
KL
+Z
+Z
treemap item triangle strip unrolled perspective view
Figure 5: Example of a primitive template: triangle strip for
representing a 3D-Treemap item on GPU.
Table 1: Comparing memory footprints of the rendering
techniques on VRAM in Byte.
Rendering Technique Memory Footprint
Shape Generation n · (a · 8) + 24 + 12
Indexed VBO n · (a · 8 + 12)
Non-Index VBO n · (a · 30)
Pseudo Instancing 8 + 12
UBO Instancing n · (a · 8) + 24 + 12
TBO Instancing n · (a · 8) + 24 + 12
dering pipeline for the proposed shape generation ap-
proach. Buffer objects encode all items as attributed
point cloud. The point position is the origin of the
3D-Treemap item. During a single draw call, a ge-
ometry shader converts a input point into a triangle
strip, representing the shape of the 3D-Treemap item,
using the indexed primitive template described in the
previous section.
3.3 Vertex Buffer Approaches
An alternative to the shape generation approach is the
rendering using server-side resources known as buffer
objects. Buffer objects is the general term for unfor-
matted linear memory, allocated by the graphics con-
text (Segal and Akeley, 2012). These can be used to
store vertex data. For comparison reasons, two GPU
representation variants for 3D-Treemaps are evalu-
ated:
Indexed Buffer Objects. Indexing, or indexed ver-
tex rendering, enables the reuse of vertices by
using an additional index buffer. In this way,
a treemap item can be represented using eight
vertices and 12 indices (Fig. 5). Indexed
vertex rendering also leverage the GPU’s post-
transform cache (post-T&L cache) (ca. 32 ver-
tices) that reuses already transformed vertices
(Hoppe, 1999).
Non-Indexed Buffer Objects. For reasons of com-
pleteness, we compare the shape generation ap-
proach with the non-indexed buffer object repre-
sentation. Here, a treemap item is represented us-
ing ten faces with three vertices. The represen-
tation does not utilize post-transform cache and
has the largest video memory footprint of all com-
pared rendering techniques.
In contrast to shape generation, such explicit buffer
representation exhibit higher memory consumptions
and increased update-time per treemap item, since the
shape generation is performed client side for the com-
pact treemap representation described in Section 3.1.
3.4 Geometry Instancing
Another important technique for the interactive ren-
dering of uniform geometry is geometry instancing
(Nguyen, 2007). It enables the rendering of a num-
ber of copies (instances) of a single geometric object
in a single draw call and thereby improves the poten-
tial runtime performance. This technique is primar-
ily used for objects such as trees (Bao et al., 2011),
grass, buildings, or objects which can be in general
represented as repeated geometry. Although vertex
data is duplicated across all instanced meshes, each
InteractiveRenderingofComplex3D-TreemapswithaComparativePerformanceEvaluation
169
instance can have differentiating parameters (per-
instance data). This paper evaluates three common
instancing techniques that mainly differ by the encod-
ing of per-instance data such as dimension, color, and
object identifier.
Pseudo Instancing. encodes the instance data in the
shader constant registers. These registers are usu-
ally limited to 4k of floating point values. Pseudo
instancing requires most draw calls because of
the limited number of instances that can be rep-
resented.
Uniform-Buffer Instancing. stores instance data in
uniform buffer objects (UBO) (often with a max-
imum buffer size of 64k). The maximal size of
a uniform buffer determines number of instances
rendered with a single draw call, i.e., the num-
ber of draw calls required to render the complete
treemap.
Texture-Buffer Instancing. uses so called texture
buffer objects (TBO) that provide a 1D storage
as a texture. Similar, to uniform-buffer instanc-
ing, the maximum size of a texture buffer deter-
mines number of draw call. The instance data is
accessed using texel fetches during shader run-
time. The number of item attributes determines
the number of texel fetches required.
For a test machine equipped with a NVIDIA GTX
460, a 3D-Treemap data comprising 614,929 items
the per-instance data require 29,516,592 byte. Pseudo
instancing requires 1809 draw calls with 340 instance
per call, while uniform buffer instancing requires 453
draw calls with 1360 instances per call. Since buffer
textures can be substantially larger than equivalent
one-dimensional textures (up to 2
27
texels), texture
buffer instancing requires only a single draw call. The
performance impact of each technique is discussed
detailed in Section 5.
3.5 Culling Optimizations
The implementation of the rendering techniques de-
scribed above support the following three culling
techniques to improve rendering performance:
View-Frustum Culling. View-frustum culling per-
formed in the vertex stage is used to omit the
shape generation for treemap items outside the
current view frustum. A two-stage approach is
applied: first; test only the origin point, if it is
out-side the current view frustum, each one of the
eight corner points are tested.
Size-Culling. If a 3D-Treemap item passes view-
frustum culling, the area of its projected shape in
viewport
treemap item
width w
item area A
width a
height h
height b
Figure 6: Parameters in screen-space coordinates required
for size culling a 3D-Treemap item.
screen space is tested. No geometry is emitted if
the size is below a threshold . This reduces raster-
ization costs.
Back-Face Culling. To further reduce rasterization
costs, back-face culling is enabled for 3D scenes
with opaque geometry.
The application of occlusion culling is not consid-
ered due to the low geometric complexity of the
3D-Treemap items, i.e., simple approximations of
treemap geometry have the same complexity, thus oc-
clusion culling wont give any benefits. Further, user
mainly look from top-down or oblique perspectives,
thus, most items are visible and not overdrawn.
The size culling approach omits the rasterization
of treemap items which dimensions are too small to
be perceived on screen. This can significantly re-
duces the load of the rasterization stage in the ren-
dering pipeline. We propose a screen-space metric in
combination with a threshold ε > 1 over the item area
A of a projected treemap item (Figure 6):
passSizeCulling(a, b, ε) =
1 a · b > ε
0 otherwise
The area A computes from the 2D hull (axis-
aligned bounding box) of the projected corner points
p
0
, . . . , p
7
of a 3D-Treemap item:
a = |max(p
0
x
, . . . , p
7
x
)| − |min(p
0
x
, . . . , p
7
x
)|
b = |max(p
0
y
, . . . , p
7
y
)| − |min(p
0
y
, . . . , p
7
y
)|
For a given viewport resolution of w width and h
height, we observed that ε ∈ [1, 2.5] the trade-off be-
tween performance improvement and visual artifacts
seems optimal.
4 IMPLEMENTATION DETAILS
To evaluate and compare the performance of the
rendering techniques described above, a prototypi-
GRAPP2013-InternationalConferenceonComputerGraphicsTheoryandApplications
170

X
0
Y
0
W
0
H
0
R
0
G
0
B
0
ID
0
Z
0
D
0
L
0
F
0
Layout Attributes Thematic Mapping Attributes
X
n
Y
n
W
n
H
n
R
n
G
n
B
n
ID
n
Z
n
D
n
L
n
F
n
Layout Buffer Thematic Mapping Buffer
Figure 7: The Split-buffer concept for layout and thematic
mapping information reduces update performance due to to
reduction of consumed bandwidth.
cal implementation using OpenGL (Segal and Ake-
ley, 2012) and GLSL is presented. The implemen-
tation uses modern GPU capabilities such as vertex
buffer objects (VBO), vertex array objects (VAO),
texture buffer objects (TBO), and uniform buffer ob-
jects (UBO). Assuming that the remaining techniques
are well documented, this section focus on implemen-
tation details for the shape generation approach.
Buffer Management. Based on the assumption that
changes in thematic mapping occur more often than
layout changes, we decided to use two buffer ob-
jects: one represents the 2D layout information (lay-
out buffer) and the other represents the thematic map-
ping (thematic mapping buffer) information (Fig. 7).
The buffer contents is organized in groups of four
32bit float values to support memory alignment con-
straints of the GPU. The split buffer implementation is
only relevant for the shape generation, uniform-buffer
as well as texture buffer instancing approaches.
Shape Generation using Shader. For encoding the
primitive template, one can use the approaches sim-
ilar to encoding per-instance data (Section 3.4). We
encode the primitive template using shader constant
registers. Independent of the encoding, the size of
the primitive template (e.g., the number of primitives
represented) is effectively limited by the number of
vertices and attributes that can be emitted by the ge-
ometry shader: 4096 float values.
The listing in Fig. 8 shows the OpenGL geome-
try shader implementation used for shape generation
stage. The geometry template is encoded using con-
stant shader registers for fast access. Shape genera-
tion is triggered only if the input point passes view-
frustum and size culling performed in the previous
vertex shader stage. The number of output vertices
of the geometry shader is capped to 12.
The first loop scales each vertex of the template
with respect to the dimension of the 3D-Treemap
item. The scale vertex is then translated to the item
origin and than projected. The compiled (unrolled)
geometry shader requires only 120 assembly instruc-
tions for the respective geometry template.
3D-Treemap Stylization. Suitable styling of 3D-
Treemaps is essential for human perception. It
should support the differentiation between single
treemap items and facilitate the visual extraction of
the treemap hierarchy. Stylization is implemented as
a post-processing step in the rendering pipeline. Fig-
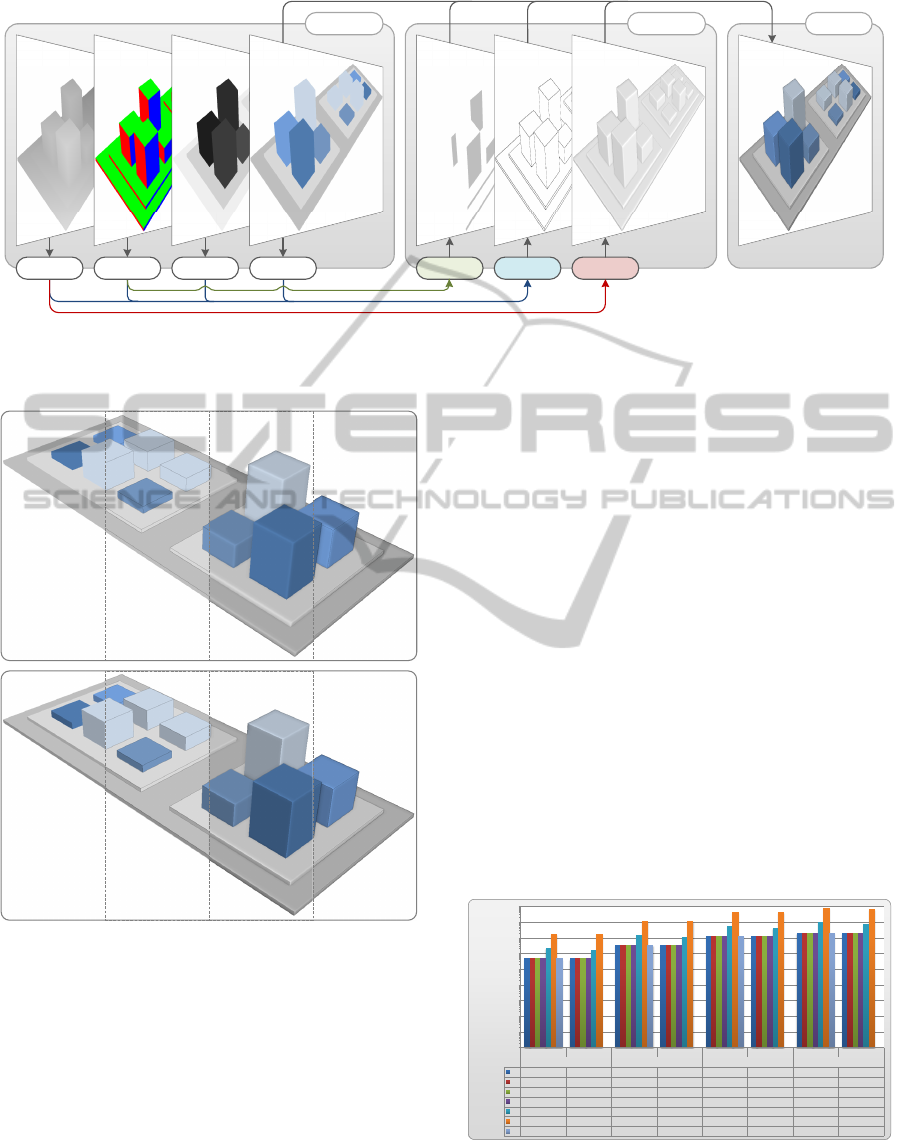
ure 9 shows an overview of the stylization stage and
participated components. The G-Buffer (Saito and
Takahashi, 1990) required for the deferred stylization
are generated using render-to-texture (RTT) (Wynn,
2002) in combination with multiple rendering targets
(MRT). The overhead in rendering performance intro-
duced by RTT varies between 1-3 milliseconds on a
NVIDIA GTX 560, depending on the screen resolu-
tion.
Figure 9 shows a comparison example for the used
stylization variants, ordered by the impact on the ren-
dering performance. Plain coloring and a single dis-
tance light (Fig. 9.A) performs best but makes it dif-
ficult for a user to differentiate between the treemap
items (Bohnet and D
¨
ollner, 2011). This can be par-
tially improved by implementing image-based edge-
enhancement (Nienhaus and D
¨
ollner, 2003) (Fig.
9.2). For this stylization feature, per-face normal vec-
tors are required. The normal vector information is
not part of the treemap representation and generated
procedurally using a geometry shader. For a trian-
gle T = (V
0
,V
1
,V
2
) the normal N is simply computed
by N = normal(T ) = |V
0
− V
1
| × |V
1
− V
2
|. For the
shape generation approach the normal vectors are ex-
plicitly given for each emitted vertex using last pro-
voking vertex (Segal and Akeley, 2012).
5 RESULTS & DISCUSSION
This section presents a comparative performance
evaluation of the presented approach and discusses
limitations and ideas for future work.
in vec4 v4_Dimension_VS[1];
in float v1_Pass_VS[1];
const vec4 VERTEX[8] = vec4[](/* ... */);
const int INDEX[12] = int[](/* ... */);
void main(void){
if(v1_Pass_VS[0] > 0.0){ // pass view-frustum & size culling
vec4 VERTEX_TRANSFORM[8];
for(int i = 0; i < 8; i++) // Transform template vertices
VERTEX_TRANSFORM[i] = gl_ModelViewProjectionsMatrix *
(gl_PositionIn[0] + (VERTEX[i] * v4_Dimension_VS[0]));
for(int j = 0; j < 12; j++){ // Emit primitive
gl_Position = VERTEX_TRANSFORM[INDEX[j]];
EmitVertex();
}
}
}
Figure 8: GLSL geometry shader for the shape generation
approach using shader constant registers to represent the
primitive template.
InteractiveRenderingofComplex3D-TreemapswithaComparativePerformanceEvaluation
171
compositing
shading edges occlusion
final imageimage layer
depth normal identity color
Figure 9: Image-based stylization pipeline used for all presented rendering techniques. The G-Buffer for depth, normal,
identifier, and color, are rendered within a single using multiple render targets. The compositing stage use this data to
synthesize various treemap stylization.
B
1234
A
1234
Figure 10: Various stylization alternatives supported by the
stylization pipeline, without (A) and with static lighting (B).
From left to right shows the item color only (1), applied
edge-enhancement (2), unsharp masking (3), and unsharp
masking combined with edge enhancement (4).
5.1 Test Setup
The rendering technique was tested using four data
sets of different geometric complexity: 35.089,
96.658, 365.645, and 614.929 items. The perfor-
mance tests are conducted on three different test plat-
forms with different GPU generations: (1) NVIDIA
GeForce GTX 460 GPU with 1024MB video mem-
ory on an Intel Xeon W3530 CPU with 2,8GHz and
6GB of main memory; (2) NVIDIA GeForce GTX
480 with 1.5GB video memory on an Intel Xeon
W3520 2.67GHz and 24GB of main memory; and (3)
NVIDIA GeForce GTX 560 Ti with 2GB video mem-
ory on an Intel Xeon W3550 3.07GHz and 6GB of
main memory.
The test application runs in windowed mode at
high-definition resolution of 1280 × 720 pixels. The
complete scene is visible in the view frustum, thus
view-frustum culling is not applied. Further back-
face culling is activated and size culling is deacti-
vated. For each rendering technique, a total of 5000
consecutive frames are rendered and the respective
run-time performance in milliseconds is tracked. Af-
ter performance tracking, all records are averaged. To
determine to update performance, the time required
between committing a new data set to the rendering
techniques and the next frames rendered is measured
in milliseconds. Styling is turned off to measure ge-
ometry throughput only with the RTT overhead.
IV
1999296 1555008 14235552 11072096 52652880 40952240 88548480
NV
15439008 14994720 109930096 106766640 406597240 394896600 683791040
IM
444288 0 3163456 0 11700640 0 19677440
CPU GPU CPU GPU CPU GPU CPU GPU
13.884 98.858 365.645 614.920
SG
444288 444368 3163456 3163536 11700640 11700640 19677440 19677520
PI
444368 444368 3163536 3163536 11700640 11700640 19677520 19677520
UI
444368 444368 3163536 3163536 11700640 11700640 19677520 19677520
TI
444368 444368 3163536 3163536 11700640 11700640 19677520 19677520
IV
1999296 1555008 14235552 11072096 52652880 40952240 88548480 68871040
NV
15439008 14994720 109930096 106766640 406597240 394896600 683791040 664113600
IM
444288 0 3163456 0 11700640 0 19677440 0
1
10
100
1000
10000
100000
1000000
10000000
100000000
1E+09
byte
Figure 12: Memory footprint comparison of the presented
rendering techniques using four test datasets. The ver-
tical axis shows the amount of Bytes required for the
client-(CPU) and server-side (GPU) representation of 3D-
Treemaps using a logarithmic scale.
GRAPP2013-InternationalConferenceonComputerGraphicsTheoryandApplications
172
SG PI UI TI IV NV IM
35,089
1.68 3.11 2.29 2.3 2.12 3.85 13.42
98,858
2.25 6.58 4.53 4.53 3.88 9.48 36.52
365,645
6.77 22.94 15.78 15.68 13.24 33.15 133.08
614,920
13.51 38.1 26.04 26.04 21.98 56.15 237.59
1
10
100
1000
milliseconds
GTX 460
SG PI UI TI IV NV IM
35,089
1.23 3.12 1.96 2.01 1.38 2.21 15.37
98,858
1.02 7.48 4.07 3.91 1.81 4.74 38.78
365,645
3.11 29.55 15.93 15.23 6.25 17.24 146.78
614,920
7.7 46.68 24.21 23.42 10.79 28.61 243.89
1
10
100
1000
miliseconds
GTX 480
GPU
19677520
19677520
19677520
19677520
920
SG PI UI TI IV NV IM
35,089
1.28 2.64 1.91 1.91 1.57 3.37 12.45
98,858
1.51 7.74 3.43 4.01 2.87 8.09 33.65
365,645
4.89 23.47 13.48 13.42 9.60 28.81 131.54
614,920
10.03 42.01 22.24 22.41 16,15 48.17 212.87
1
10
100
1000
milliseconds
GTX 560
Figure 11: Comparison of the rendering performance for the presented rendering techniques on three different hardware
platforms using four test datasets of varying complexity. The vertical axis shows the run-time performance in milliseconds on
a logarithmic scale.
5.2 Performance Evaluation
Figure 11 shows the results for the run-time per-
formance evaluation for the novel shape generation
(SG), pseudo instancing (PI), uniform-buffer instanc-
ing (UI), texture-buffer instancing (TI), index vertex
buffer (IV), non-indexed vertex buffer (NV), and in-
termediate approach (IM). Figure 12 shows the re-
spective memory consumptions important for com-
parison. The visualized values are computed based
on the functions presented in Table 1. The results
show that the presented server-side shape generation
approach outperforms the remaining rendering tech-
niques on all tested hardware platforms. Indexed
vertex- buffer rendering outperforms geometry in-
stancing but comes at the cost of a larger memory foot
print.
Uniform-buffer instancing outperforms pseudo-
and texture-buffer instancing. In comparison to
texture-buffer instancing, the number of required
draw calls are higher, but the data access (L1 for uni-
form buffers) is faster (L2 for texture buffers). The
performance of pseudo-instancing is CPU-bound be-
cause of the limited constant shader memory. The
memory footprint the server-side 3D-Treemap repre-
sentation of the instancing and shape generation are
almost the same.
Rendering in intermediate mode do not require
any video memory for the representation of a 3D-
Treemap but is CPU-bound and thus performs worst.
Non-indexed vertex buffer rendering performs worst
of all rendering techniques using server side storage.
5.3 Discussion & Future Work
To summarize, if video memory is a limiting fac-
tor, shape generation and instancing approaches are
preferable over vertex-buffer approaches. Based on
the average run-time performance, the estimated the-
oretical number of 3D-Treemap items that can be ren-
dered in real-time (assuming 12 frames-per-second)
is approximately 5 millions.
However, the presented approach and its imple-
mentation has some conceptual and technical limita-
tions. One major technical limitation concerns the
encoding of the primitive template. Its geometrical
complexity is limited to primitives and its attributes
that can be represented using 4096 float values. (as
described in Section 4).
Figure 13 shows a rendering of a complex 3D-
Treemap. Due to static layout and border sizes,
the perspective projection introduces cluttering and
Moir
´
e effects. Further, single 3D-Treemap items can-
not be perceived anymore and complex 3D-Treemaps
of the presented extends are hard to read and to inter-
pret. To challenge these conceptual problems, some
aspects of the treemap layout should be altered dur-
ing rendering in a view-dependent or view adaptive
way. This requires effective level-of-detail or level-
A
B
Figure 13: Problems for rendering of complex 3D-
Treemaps: indistinguishable 3D-Treemap items (A) and
Moir
´
e effects (B) caused by perspective projection and high
zoom levels.
InteractiveRenderingofComplex3D-TreemapswithaComparativePerformanceEvaluation
173

Figure 14: Visualization of overdraw for a 3D-Treemap of
35k items using a slice’n dice layout. Dark areas show high
amount of overdraw (gamma-corrected).
of-abstraction approaches, which can be applied in
real-time during rendering.
Although, the rendering techniques are not fill-
limited, overdraw can be a further topic to address
further performance increase (Sander et al., 2007).
The current data representation for the shape gener-
ation approach enables independent (height) scaling
of each item but exhibit a relatively large amount of
overdraw (Fig. 14). The average overdraw ratio of all
rendered fragment to all visible fragments for a data
set of 35k 3D-Treemap map items using a strip layout
and oblique viewing of (Fig. 14) orientation are 96
percent, i.e., almost every pixel is overdrawn once.
To reduce the overdraw ratio for possibly complex
fragment processing, we strive for representing the
3D-Treemap item origin and dimensions based (cur-
rently Fig. 15.A) on a function of the level within the
treemap hierarchy (Fig. 15.B).
For future work, we plan to focus on hardware
accelerated implementation of treemap layout algo-
rithms using parallel processors to enable true inter-
active 3D-Treemaps. We further strive towards a gen-
eralization of the rendering concept to support other
types of 3D-Treemaps, such as 3D Voronoi treemaps
(similar to (Choi et al., 2011)). Further, to deal for
3D tree maps with even higher geometric complexity,
we plan to combine our approach with dynamic spa-
tial data structures, such as the skip quad tree (Epp-
stein et al., 2005), and out-of-core rendering tech-
Figure 15: Side view for a possible approach to reduce un-
necessary overdraw (A) by computing the the origin and di-
mension of a 3D-Treemap item based on its hierarchy level
L (B).
niques. Furthermore, to increase the perception of
complex 3D-Treemaps we research to what extent
known level-of-detail (LoD) and level-of-abstraction
(LoA) approaches (e.g., for the visualization of vir-
tual 3D city models (Glander and D
¨
ollner, 2007)) can
be transfered to the rendering and visualization of 3D-
Treemaps.
6 CONCLUSIONS
This paper presents a novel rendering technique that
enables real-time image synthesis of complex 3D-
Treemaps. It can be completely implemented using
consumer graphics hardware and outperforms exist-
ing rendering approaches. The presented technique
is suitable for interaction metaphors that does not re-
quire to recompute the treemap layout. Further, it en-
ables a compact, i.e., memory efficient, geometry rep-
resentation of tree maps with large amount of items.
Furthermore, a throughly performance evaluation and
comparison is provided, that shows the superiority of
the presented approach over existing rendering tech-
niques.
ACKNOWLEDGMENTS
The authors would like to thank the anonymous
reviewers for their valuable comments. This
work was funded by the Federal Ministry of Ed-
ucation and Research (BMBF), Germany, within
the InnoProfile Transfer research group ”4DnD-
Vis” (www.4dndvis.de) and the Research School
on ”Service-Oriented Systems Engineering” of the
Hasso-Plattner-Institute.
REFERENCES
Andrews, K., Wolte, J., and Pichler, M. (1997). Informa-
tion pyramids (tm): A new approach to visualizing
large hierarchies. In Proceedings of the IEEE Visu-
alization97, pages 49–52.
Balzer, M. and Deussen, O. (2005). Voronoi treemaps.
In Information Visualization, 2005. INFOVIS 2005.
IEEE Symposium on, pages 49–56. Ieee.
Bao, G., Meng, W., Li, H., Liu, J., and Zhang, X. (2011).
Hardware instancing for real-time realistic forest ren-
dering. In SIGGRAPH Asia 2011 Sketches, SA ’11,
pages 16:1–16:2, New York, NY, USA. ACM.
Bederson, B., Shneiderman, B., and Wattenberg, M. (2002).
Ordered and quantum treemaps: Making effective use
of 2d space to display hierarchies. AcM Transactions
on Graphics (TOG), 21(4):833–854.
GRAPP2013-InternationalConferenceonComputerGraphicsTheoryandApplications
174

Bladh, T., Carr, D., and Kljun, M. (2005). The effect of
animated transitions on user navigation in 3d tree-
maps. In Information Visualisation, 2005. Proceed-
ings. Ninth International Conference on, pages 297–
305. IEEE.
Bladh, T., Carr, D., and Scholl, J. (2004). Extending tree-
maps to three dimensions: A comparative study. In
Computer Human Interaction, pages 50–59. Springer.
Bohnet, J. and D
¨
ollner, J. (2011). Monitoring code qual-
ity and development activity by software maps. In
Proceeding of the 2nd working on Managing techni-
cal debt, pages 9–16. ACM.
Bruls, M., Huizing, K., and Van Wijk, J. (2000). Squarified
treemaps. In Proceedings of the joint Eurographics
and IEEE TCVG Symposium on Visualization, pages
33–42. Citeseer.
Choi, J., Kwon, O.-h., and Lee, K. (2011). Strata treemaps.
In ACM SIGGRAPH 2011 Posters, SIGGRAPH ’11,
pages 87:1–87:1, New York, NY, USA. ACM.
Correa, W., Klosowski, J., and Silva, C. (2003). Visibility-
based prefetching for interactive out-of-core render-
ing. In Proceedings of the 2003 IEEE Symposium on
Parallel and Large-Data Visualization and Graphics,
page 2. IEEE Computer Society.
Eppstein, D., Goodrich, M. T., and Sun, J. Z. (2005). The
skip quadtree: a simple dynamic data structure for
multidimensional data. In Proceedings of the twenty-
first annual symposium on Computational geometry,
SCG ’05, pages 296–305, New York, NY, USA. ACM.
Evans, F., Skiena, S., and Varshney, A. (1996). Optimizing
triangle strips for fast rendering. In Visualization’96.
Proceedings., pages 319–326. IEEE.
Fekete, J. and Plaisant, C. (2002). Interactive information
visualization of a million items. In Information Visu-
alization, 2002. INFOVIS 2002. IEEE Symposium on,
pages 117–124. IEEE.
Glander, T. and D
¨
ollner, J. (2007). Cell-based generaliza-
tion of 3d building groups with outlier management.
In 15th International Symposium on Advances in Geo-
graphic Information Systems (ACM GIS). ACM Press.
Hoppe, H. (1999). Optimization of mesh locality for trans-
parent vertex caching. In Proceedings of the 26th
annual conference on Computer graphics and inter-
active techniques, SIGGRAPH ’99, pages 269–276,
New York, NY, USA. ACM Press/Addison-Wesley
Publishing Co.
Kong, N., Heer, J., and Agrawala, M. (2010). Perceptual
guidelines for creating rectangular treemaps. Visual-
ization and Computer Graphics, IEEE Transactions
on, 16(6):990–998.
Liggesmeyer, P., Heidrich, J., M
¨
unch, J., Kalckl
¨
osch, R.,
Barthel, H., and Zeckzer, D. (2009). Visualization of
software and systems as support mechanism for in-
tegrated software project control. Human-Computer
Interaction. New Trends, pages 846–855.
Liktor, G. and Dachsbacher, C. (2012). Decoupled deferred
shading for hardware rasterization. In Proceedings of
the ACM SIGGRAPH Symposium on Interactive 3D
Graphics and Games, I3D ’12, pages 143–150, New
York, NY, USA. ACM.
Nguyen, H. (2007). Gpu gems 3. Addison-Wesley Profes-
sional, first edition.
Nienhaus, M. and D
¨
ollner, J. (2003). Edge-enhancement -
an algorithm for real-time non-photorealistic render-
ing. In WSCG.
R
´
akos, D. (2010). Instance culling using geometry
shaders. http://rastergrid.com/blog/2010/02/instance-
culling-using-geometry-shaders/.
Saito, T. and Takahashi, T. (1990). Comprehensible ren-
dering of 3-d shapes. SIGGRAPH Comput. Graph.,
24(4):197–206.
Sander, P. V., Nehab, D., and Barczak, J. (2007). Fast tri-
angle reordering for vertex locality and reduced over-
draw. ACM Transactions on Graphics (Proc. SIG-
GRAPH), 26(3).
Schulz, H., Hadlak, S., and Schumann, H. (2011). The
design space of implicit hierarchy visualization: A
survey. Visualization and Computer Graphics, IEEE
Transactions on, (99):1–1.
Schulz, H., Luboschik, M., and Schumann, H. (2007). Ex-
ploration of the 3d treemap design space. Poster Com-
pendium of IEEE InfoVis07, pages 78–79.
Segal, M. and Akeley, K. (2012). The OpenGL Graphics
System: A Specification (Version 4.2 (Core Profile) -
April 27, 2012).
Shneiderman, B. (1992). Tree visualization with tree-maps:
2-d space-filling approach. ACM Transactions on
graphics (TOG), 11(1):92–99.
Sud, A., Fisher, D., and Lee, H. (2010). Fast dynamic
voronoi treemaps. In Voronoi Diagrams in Science
and Engineering (ISVD), 2010 International Sympo-
sium on, pages 85–94. IEEE.
Wettel, R. and Lanza, M. (2008). Codecity: 3d visual-
ization of large-scale software. In Companion of the
30th international conference on Software engineer-
ing, pages 921–922. ACM.
Wynn, C. (2002). OpenGL Render-to-Texture. In GDC.
NVIDIA Corporation.
InteractiveRenderingofComplex3D-TreemapswithaComparativePerformanceEvaluation
175
