
Modeling H
2
Adsorption Processes at SnO
2
Nanowire Surfaces
Parameter Estimation and Simulation
G. Tulzer
1,2
, S. Baumgartner
1,2
, E. Brunet
1
, G. C. Mutinati
1
, S. Steinhauer
1
, A. K
¨
ock
1
and C. Heitzinger
1,2,3
1
AIT Austrian Institute of Technology, Donau-City-Strasse 1, A-1220 Vienna, Austria
2
Department of Mathematics, University of Vienna, Vienna, Austria
3
Department of Applied Mathematics and Theoretical Physics (DAMTP), University of Cambridge,
Cambridge CB3 0WA, U.K.
Keywords:
Nanowire Gas Sensors, Selectivity, Modeling, Simulation, Inverse Modeling, Parameter Estimation.
Abstract:
Metal-oxide gas sensors are advantageous for various purposes due to their physical and chemical as well
as electrical properties. However, a lack of selectivity remains the central issue in this field. A quantitative
understanding of the processes at the semiconductor surface is crucial to overcome these difficulties. In this
work, we determine numerical values for the parameters governing the interaction of H
2
with the device to
obtain quantitative information regarding the influence of the atmosphere on the sensor. With the computed
values, simulations regarding the surface charge can be performed to understand the sensor behavior under
different ambient conditions.
1 INTRODUCTION
Metal-oxide gas sensors show high thermal stabil-
ity, chemical resistivity and excellent sensitivity to-
wards various gases. In particular, the high surface-
to-volume ratio of nanowires enables detection of tar-
get gas concentrations in the low ppm range (Comini,
2006; Brunet et al., 2012). As a consequence, there
are numerous potential applications, ranging from en-
vironmental monitoring to portable medical devices.
However, a lack of selectivity is still the central issue
in this field, which inhibits the realization of the full
potential and the optimization of sensor performance.
To overcome this fact, it is crucial to understand
the processes taking place at the nanowire surface and
their influence on the electrical properties of the semi-
conductor (Barsan and Weimar, 2001; Rehrl, 2011).
There are several reaction path models proposed in
the literature for various gases (Hahn et al., 2003;
Malyshev and Pislyakov, 2008) but the determination
of numerical values of the reaction parameters is still
an open problem, although first steps have been made
with carbon monoxide adsorption (Fort et al., 2007;
Fort et al., 2010; Tulzer et al., 2012). The parameter
estimation for H
2
adsorption processes in dry air will
be the central part of this work.
The extracted information on the surface proper-
Figure 1: SEM image of an SnO
2
nanowire.
ties can be implemented into a self-consistent 3D-
model of the carrier transport in the nanowire, as
it was already done with biosensors ((Baumgart-
ner et al., 2011; Baumgartner and Heitzinger, 2012;
Baumgartner et al., 2012)).
2 MODEL EQUATIONS
Starting from the chemical reactions describing the
gas-surface interactions and using a rate-equation ap-
proach (Higham, 2008), we obtain a coupled sys-
265
Tulzer G., Baumgartner S., Brunet E., C. Mutinati G., Steinhauer S., Köck A. and Heitzinger C..
Modeling H2 Adsorption Processes at SnO2 Nanowire Surfaces - Parameter Estimation and Simulation.
DOI: 10.5220/0004249402650268
In Proceedings of the International Conference on Biomedical Electronics and Devices (BIODEVICES-2013), pages 265-268
ISBN: 978-989-8565-34-1
Copyright
c
2013 SCITEPRESS (Science and Technology Publications, Lda.)

tem of nonlinear ordinary differential equations, in
which the essential parameters appear as coefficients.
Chemical reactions are described in terms of concen-
trations of the agents present at the surface and of
kinetic parameters k
i
. In fact, the k
i
vary depending
on temperature, which can be taken into account us-
ing the Arrhenius form, i.e. writing k
i
:= κ
i
e
−E
i
/k
B
T
,
where κ
i
is a frequency factor and E
i
is an activation
energy. All the charged species at the nanowire sur-
face can be identified as occupied energy levels, the
so called extrinsic surface states. Their charge may
be positive or negative. The adsorption of any species
at the surface also changes the electrical properties in-
side the nanowire, which can be described in the oc-
cupation of certain energy levels, i.e. intrinsic surface
states. These states are always negatively charged.
The total surface charge is given by superposition of
all the intrinsic and extrinsic surface states.
2.1 Sensor in Inert Atmosphere
The occupation of the intrinsic surface states is de-
scribed by the following reaction:
N
u
+ e
−
N
S
, (1)
where N
u
:= N
i
− N
S
is the number of unoccupied in-
trinsic surface states. Applying the mass action law,
the differential equation for the occupation is
dN
S
d t
= k
1
n
S
N
u
− k
2
N
S
, (2)
where
n
S
= N
D
e
−
q
2
(N
e f f
)
2
2εε
0
N
D
k
B
T
(3)
is the number of free electrons in the sensor that can
reach the surface. N
D
is the number of ionized donors
in the nanowire, which is set to be 6·10
23
m
−3
in this
work. The other parameters follow the usual notation
and are listed in Table 1. If the sensor is exposed to
an inert (e.g. nitrogen) atmosphere, this is the only
equation to investigate.
2.2 H
2
Adsorption
In the case of H
2
adsorption in an atmosphere con-
sisting of 80% nitrogen and 20% dry air, the reaction
path is (Malyshev and Pislyakov, 2008).
O
2
+ S
u
O
ads
, (4)
O
ads
+ e
−
O
−
ads
, (5)
H
2
+ O
−
ads
H
2
O + e
−
. (6)
The first and the second equation describe the ad-
sorption and ionization of oxygen molecules from the
Table 1: Quantites and Symbols.
N
i
# available intrinsic surface states
N
S
# occupied intrinsic surface states
N
u
# unoccupied intrinsic surface states
S # available extrinsic surface states
S
u
# unoccupied extrinsic surface states
N
∆
# surface states occupied by species ∆
N
e f f
effective # surface states
N
D
# ionized donors
k
B
Boltzmann constant
T temperature in Kelvin
q elementary charge
ε relative permittivity of SnO
2
ε
0
dielectric constant
k
i
reaction constants
κ
i
frequency factors
E
i
activation energies
air; the last equation describes the oxygen desorption
from the surface by generation of water molecules.
Note that that the gaseous hydrogen just interacts with
the adsorbed oxygen and not with the nanowire lattice
in this model. Using the mass action law again we ob-
tain
dN
O
d t
= k
3
[S
u
][O]
1/2
− k
4
N
O
−
−
dN
O
−
d t
, (7)
dN
O
−
d t
= k
5
n
S
N
O
− k
6
N
O
− −
dH
2
O
dt
, (8)
dH
2
O
dt
= k
7
N
O
−
[H
2
], (9)
where [S
u
] := [S] − N
O
− N
O
+
is the number unoccu-
pied extrinsic surface states. The effective number
of surface states is then given by N
e f f
:= N
S
+ N
O
+
.
These equations together with equation (2) give the
full system to investigate.
2.3 Parameter Estimation
The considered equations contain parameters of dif-
ferent orders of magnitude. To obtain accurate results,
it is therefore necessary to perform a nondimension-
alization and scaling step. We will here use the fol-
lowing scaling (similar to (Ding et al., 2001)):
e
N
∆
:=
N
∆
N
2/3
D
e
S
∆
:=
S
∆
N
2/3
D
e
T :=
ε
0
k
B
q
2
N
1/3
D
· T, (10)
where ∆ stands for the symbol of any species involved
in the respective framework. This procedure yields
the following system
N
′
S
= k
1
e
−
(N
S
+N
O
−
)
2
2εT
N
u
− k
2
N
S
, (11)
BIODEVICES2013-InternationalConferenceonBiomedicalElectronicsandDevices
266
N
′
O
= k
3
[S
u
][O]
1/2
− k
4
N
O
− − N
′
O
−
, (12)
N
′
O
−
= k
5
e
−
(N
S
+N
O
−
)
2
2εT
N
O
− k
6
N
O
− − H
2
O
′
, (13)
H
2
O
′
= k
7
N
O
−
[H
2
], (14)
where the k
i
now may also contain further constants
according to the non-scaled system.
To obtain numerical values, a simulated-annealing
algorithm was used within the Mathematica environ-
ment. Here, the numerical solution of the system
(11)-(14) is compared to the experimental data. The
deviation of the model from the experimental results
is then minimized with respect to the unknown pa-
rameters.
ss
ss
s1K
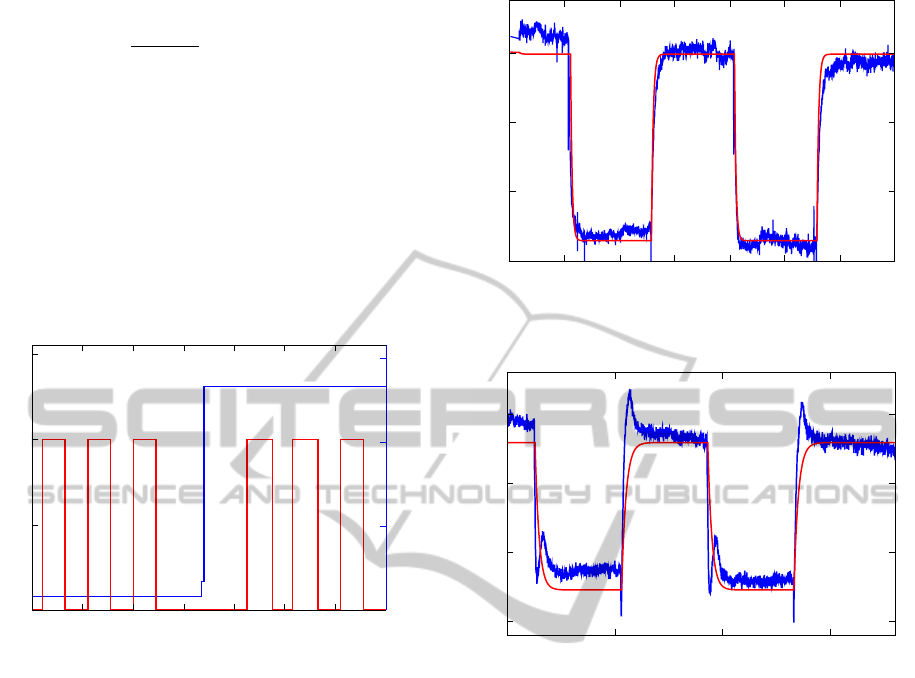
Figure 2: Experimental conditions for the investigated mea-
surement.
3 RESULTS
The investigated experiment is described in detail in
(Brunet et al., 2012), where the sensor preparation is
explained as well.
In this work, we investigate the response of a
single SnO
2
nanowire sensor to 20ppm hydrogen
pulses in an atmosphere consisting of 80% N
2
and
20% O
2
. To obtain information on the temperature
dependence, the measurement is taken at 250
◦
C and
300
◦
C. The setup can be seen in Figure 2. The sim-
ulations show very good agreement with the experi-
mental data and are shown in Figures 3 and 4. The
deviation in the beginning of both diagrams is due
to the fact that the sensor has not yet attained equi-
librium regarding its resistive properties. The origin
of the spikes in the 300
◦
C degree measurement is not
clear at the moment, but is under further investigation.
rr]2
3i
rm
T
r]2
i
r
Figure 3: Comparison of experimental data (blue) to simu-
lation results (red) at 250
◦
C. Very good agreement is found.
rrT2
3s
rm
i
rT2
s
r
Figure 4: Comparison of experimental data (blue) to simu-
lation results (red) at 300
◦
C.
4 CONCLUSIONS
Regarding the simulations at constant temperatures,
the agreement of the simulation with the experimental
data is very good. The qualitative as well as quanti-
tative behavior of the sensor is covered by the inves-
tigated model. However, it turned out that the sim-
ulation of temperature changes during the measure-
ment shows deviations from the experiment. There
are many factors that may be responsible for this fact,
such as response times of the sensor or non-validity of
the mass action law for temperature transients. Nev-
ertheless, the results can be used to extract character-
istic features of the interaction of H
2
molecules with
the SnO
2
surface.
ModelingH2AdsorptionProcessesatSnO2NanowireSurfaces-ParameterEstimationandSimulation
267

ACKNOWLEDGEMENTS
The authors acknowledge support by the WWTF (Vi-
ennese Science and Technology Fund) high-potential
project No. MA09-028 and the FWF (Austrian Sci-
ence Fund) project No. P20871-N13. The publica-
tion is based on work supported by Award No. KUK-
I1-007-43, funded by the King Abdullah University
of Science and Technology (KAUST). The computa-
tional were performed on the Vienna Scientific Clus-
ter (VSC).
REFERENCES
Barsan, N. and Weimar, U. (2001). Conduction model of
metal oxide gas sensors. Journal of Electroceramics,
7:143–167.
Baumgartner, S. and Heitzinger, C. (2012). Existence
and local uniqueness for 3d self-consistent multiscale
models for field-effect sensors. Commun. Math. Sci.,
10(2):693–716.
Baumgartner, S., Vasicek, M., Bulyha, A., and Heitzinger,
C. (2011). Optimization of nanowire DNA sensor sen-
sitivity using self-consistent simulation. Nanotechnol-
ogy, 22(42):425503/1–8.
Baumgartner, S., Vasicek, M., and Heitzinger, C. (2012).
Modeling and simulation of nanowire based field-
effect biosensors. In Korotcenkov, G., editor, Chem-
ical Sensors: Simulation and Modeling, pages 447–
469. Momentum Press.
Brunet, E., Maier, T., Mutinati, G., Steinhauer, S., K
¨
ock,
A., Gspan, C., and Grogger, W. (2012). Compari-
son of the gas sensing performance of SnO
2
thin film
and SnO
2
nanowire sensors. Sensors and Actuators
B: Chemical , 165(1):110–118.
Comini, E. (2006). Metal oxide nano-crystals for gas sens-
ing. Analytica Chimica Acta, 568(12):28 – 40.
Ding, J., McAvoy, T., Cavicchi, R., and Semancik, S.
(2001). Surface state trapping models forSnO2-based
microhotplate sensors. Sensors and Actuators B:
Chemical, 77(3):597–613.
Fort, A., Mugnaini, M., Rocchi, S., Serrano-Santos, M.,
Vignoli, V., and Spinicci, R. (2007). Simplified
models for sno
2
sensors during chemical and ther-
mal transients in mixtures of inert, oxidizing and re-
ducing gases. Sensors and Actuators B: Chemical,
124(1):245–259.
Fort, A., Mugnaini, M., Rocchi, S., Vignoli, V., Comini,
E., Faglia, G., and Ponzoni, A. (2010). Metal-oxide
nanowire sensors for CO detection: Characterization
and modeling. Sensors and Actuators B: Chemical,
148(1):283–291.
Hahn, S., B
ˆ
arsan, N., Weimar, U., Ejakov, S., Visser, J., and
Soltis, R. (2003). CO sensing with SnO
2
thick film
sensors: role of oxygen and water vapour. Thin Solid
Films, 436(1):17–24.
Higham, D. (2008). Modeling and simulating chemical re-
actions. SIAM Review, Education Section , 50(2):347–
368.
Malyshev, V. and Pislyakov, A. (2008). Investigation of
gas-sensitivity of sensor structures to hydrogen in a
wide range of temperature, concentration and humid-
ity of gas medium. Sensors and Actuators B: Chemi-
cal, 134(2):913–921.
Rehrl, M. (2011). Differential Equation Models for Surface
Reactions of SnO
2
Nanowire Gas Sensors and their
Inverse Modeling. PhD thesis, Diploma Thesis, Uni-
versity of Vienna.
Tulzer, G., Baumgartner, S., Brunet, E., Mutinati, G. C.,
Steinhauer, S., K
¨
ock, A., and Heitzinger, C. (2012).
Inverse modeling of CO reactions at SnO
2
nanowire
surfaces for selective detection. Procedia Engineer-
ing, 47:809–812.
BIODEVICES2013-InternationalConferenceonBiomedicalElectronicsandDevices
268
