
Enhancing Security Event Management Systems
with Unsupervised Anomaly Detection
Markus Goldstein
1
, Stefan Asanger
2
, Matthias Reif
1
and Andrew Hutchison
3
1
German Research Center for Artificial Intelligence (DFKI), Trippstadterstr. 122, 67663 Kaiserslautern, Germany
2
Department of Computer Science, University of Cape Town, Cape Town, South Africa
3
T-Systems International, 4 Churchill Close Tyger Waterfront, Bellville 7530, South Africa
Keywords:
Anomaly Detection, Event Management, SIEM, Outlier Detection, Windows Events, User Profiling, Behavior
Profiling, Behavioral Analysis.
Abstract:
Security Information and Event Management (SIEM) systems are today a key component of complex enter-
prise networks. They usually aggregate and correlate events from different machines and perform a rule-based
analysis to detect threats. In this paper we present an enhancement of such systems which makes use of
unsupervised anomaly detection algorithms without the need for any prior training of the system. For data
acquisition, events are exported from an existing SIEM appliance, parsed, unified and preprocessed to fit the
requirements of unsupervised anomaly detection algorithms. Six different algorithms are evaluated qualita-
tively and finally a global k-NN approach was selected for a practical deployment. The new system was able
to detect misconfigurations and gave the security operation center team more insight about processes in the
network.
1 INTRODUCTION
In today’s IT environments, a complex combination
of security solutions is typically deployed in order to
protect the network from advanced security threats of
both external and internal origin. This includes but is
not limited to firewalls, intrusion detection and pre-
vention systems as well as anti-virus and patch man-
agement solutions. Each of these point solutions per-
forms specific tasks and generates large volumes of
log information which is often stored without further
consideration. In order to detect security breaches at
an early stage, log files from all individual systems
should be correlated and analyzed. This is hard to
achieve due to the complexity of today’s IT systems.
The more complex and diverse an IT environment, the
more challenging it is to perform log management,
threat management and incident response in real-time.
SIEM systems support the aggregation, correla-
tion and analysis of events from diverse sources.
Threat management, incident response and log man-
agement are key capabilities of today’s SIEM solu-
tions. Although SIEM systems have matured in the
last years, they still rely on complex rules to detect
security threats. However, rule-based correlation is
no longer sufficient in protecting an IT environment
from continuously evolving dynamic security threats.
There is an increasing demand to complement rule-
based correlation with more advanced techniques
such as anomaly detection (Nicolett, 2011) for several
reasons: Obviously, rule-based systems can only de-
tect incidents which have been observed and defined
beforehand. In some cases, unknown zero-day threats
may not be detected by today’s appliances and can
cause tremendous damage due to network down times
or even data leakage. Additionally, the habitual events
effect on administrators from standard alarm events
recurring over and over can be dangerous. Such regu-
larly occurring events like login failures due to wrong
passwords, port scans or detected and removed virus
alerts tend to be ignored. However, a certain com-
bination or a trend of such events can reveal a secu-
rity threat, which cannot be detected by today’s appli-
ances if the correlation is not known in advance. Fur-
thermore, rules are often based on manually defined
thresholds, which also might not be ideal in many
cases. For example, intruders can learn how much
data they can smuggle out before being detected in
order to “fly under the radar” in future attacks. Also,
thresholds need to be adjusted over time due to a
changing behavior of the norm.
In this context, anomaly detection (Chandola
530
Goldstein M., Asanger S., Reif M. and Hutchison A. (2013).
Enhancing Security Event Management Systems with Unsupervised Anomaly Detection.
In Proceedings of the 2nd International Conference on Pattern Recognition Applications and Methods, pages 530-538
DOI: 10.5220/0004230105300538
Copyright
c
SciTePress

et al., 2009) can help to overcome the above short-
comings. In contrast to rule-based systems, anomaly
detection does not rely on statically created rules:
Aggregated events are analyzed with a multivariate
unsupervised anomaly detection algorithm and an
anomaly score is assigned to each instance. Anomaly
detection has been successfully applied to many ap-
plication domains in the field of network security
(Garcia-Teodoro and et al, 2009) and is a promising
approach to further enhance SIEM systems.
In this paper we present a practical system to ap-
ply anomaly detection to the data streams of SIEM
systems. Our goal is not to replace SIEM systems,
but to have an additional module besides the rule-
based engines in order to give security operators hints
of potential threats. The main research focus is the
detection of suspicious authentication attempts, pass-
word guessing attacks and unusual user account ac-
tivities. The deployment is done within a large-scale
SIEM environment, operated as a managed service for
a global financial services provider.
2 BACKGROUND AND RELATED
WORK
2.1 Anomaly Detection
Anomaly Detection is a sub-area of machine learning
which aims to find outlying records in data sets. It
is also known as intrusion detection, fraud detection,
misuse detection or outlier detection according to dif-
ferent application domains. However, the basic idea
remains the same: Normal multivariate data is mod-
eled and instances being different from the majority
should be identified. This leads to the two basic as-
sumptions in anomaly detection:
• anomalies are very rare compared to normal data
(typically < 2%) and
• their feature values significantly deviate from nor-
mal data.
In the survey articles of (Chandola et al., 2009; Hodge
and Austin, 2004) attempts are made to classify the
different fields of anomaly detection as summarized
in the following. The most important difference
is with respect to the availability of labels in the
data, leading to three different categories. Super-
vised anomaly detection uses labeled training and test
data and traditional machine learning methods such
as SVMs or Neural Networks can be applied. In prac-
tice, this scenario is hardly of interest since anno-
tated anomalies are often not known. Second, semi-
supervised anomaly detection refers to the scenario
where training data only contains the normal class
and thus a model of the normal behavior is learned.
In contrast, the test data contains normal data and
anomalies which can then be identified. In some mod-
ern SIEM systems this scenario has been used, which
we will discuss in Subsection 2.3. In terms of ma-
chine learning algorithms, one class classifiers can be
used, e.g. One-Class-SVMs. Finally, unsupervised
anomaly detection does not make any assumptions
about the data and no separation between training and
test set is performed. The unlabeled data set is only
analyzed according to its intrinsic nature and records
are usually scored according to outlier probability. Of
course, this scenario is the most flexible one but this
comes at the price of being sensitive to irrelevant in-
formation. Thus it requires an appropriate preprocess-
ing which is usually done by generating data views. In
this paper we present an approach based on unsuper-
vised anomaly detection.
Another important question is whether a global
or local anomaly detection problem should be ad-
dressed. Simply speaking, global anomalies are
records being “far away” from the normal data
whereas local anomalies are suspicious with respect
to their local neighborhood. Local anomalies can
thus occur in data sets with different dense clusters
as illustrated in Figure 1. It is important to know
which anomaly problem has to be solved, since lo-
cal anomaly detection methods fail on global anomaly
detection problems (Amer and Goldstein, 2012).
attribute 1
a
t
t
r
i
b
u
t
e
2
p
1
p
2
p
4
c
2
c
1
c
3
Figure 1: Global and local outliers. p
1
and p
2
are global
outliers since their distance to other points is large. The
clusters c
1
and c
2
represent normal data points with differ-
ent (local) densities. p
4
is a local outlier with respect to
cluster c
2
. Cluster c
3
is called a microcluster, a case often
not obvious if it should be treated as an anomaly or not.
The approaches in unsupervised anomaly de-
tection can be categorized in three main classes:
(1) Nearest-neighbor based methods, (2) Clustering-
based methods and (3) Statistical methods. Statisti-
cal methods comprise parametric or non-parametric
EnhancingSecurityEventManagementSystemswithUnsupervisedAnomalyDetection
531

methods and include histograms, kernel-density-
estimation methods or the well known univariate
Grubb’s outlier test (Grubbs, 1969). They often as-
sume a certain distribution of the data or assume in-
dependability of features making them not ideal for
real-world data. Clustering-based methods are ideal
for very large data sets, especially when k-means as
a clustering algorithm is used. A well-known al-
gorithm is the Clustering-based Local Outlier Fac-
tor (CBLOF) (He et al., 2003). Unfortunately the
precision is worse when comparing with nearest-
neighbor based algorithms (Amer and Goldstein,
2012). Nearest-neighbor based approaches are by far
the most used methods today. Besides the global k-
NN algorithm (Ramaswamy et al., 2000; Angiulli
and Pizzuti, 2002), the well-known Local Outlier
Factor (LOF) (Breunig et al., 2000) was the basis
for many other algorithms, such as the Connectivity-
Based Outlier Factor (COF) (Tang et al., 2002),
the Local Outlier Probability (LoOP) (Kriegel et al.,
2009) or the Influenced Outlierness (INFLO) (Jin
et al., 2006). For the reason of having a higher pre-
cision, we also decided to evaluate nearest-neighbor
based methods in this work.
2.2 SIEM Solutions
The acronym SIEM is a combination of the terms Se-
curity Event Management (SEM) and Security Infor-
mation Management (SIM). Whereas the former of-
fers real-time event monitoring, threat management
and incident response capabilities, the latter primarily
focuses on centralized log management and compli-
ance reporting. A SIEM system integrates both dis-
tinct technologies into one complete solution.
In the past, compliance regulations were the main
driver for SIEM systems. Nowadays, more and more
SIEM systems are deployed due to their enhanced
threat management and incident response capabilities.
SIEM systems assist in understanding and interpret-
ing massive volumes of log files and increase visi-
bility, enabling security operators to possibly prevent
or react to security breaches in time. The key goal
of SIEM systems is to turn raw, diverse events into
meaningful information, also known as actionable in-
telligence. A concise understanding and overview of
security-threatening event activities is essential in or-
der to achieve situational awareness (Endsley, 1987).
In the SIEM context, situational awareness means to
detect a security threat, assess its implications and re-
spond to it in time. Situational awareness is necessary
to transition from current reactive to future predictive
SIEM solutions.
2.3 Semi-supervised Anomaly Detection
in SIEM Systems
According to a market evaluation conducted by
(Nicolett, 2011; Nicolett and Kavanagh, 2012b), the
SIEM market has matured and become very com-
petitive in the last few years and is comprised of
more than twenty individual vendors. Capabilities
that are well-supported are log and threat manage-
ment as well as compliance reporting. However, the
majority of SIEM systems still rely on rule-based
correlation techniques. In times of advanced persis-
tent threats and targeted attacks, enhanced correlation
techniques are needed to protect IT networks from
these emerging threats. An increased trend can be
identified to complement rule-based correlation tech-
niques with anomaly detection capabilities (Nicolett
and Kavanagh, 2012b).
In this context, semi-supervised anomaly detec-
tion is used, which requires an “anomaly-free” train-
ing phase, also known as behavior profiling (Nicolett
and Kavanagh, 2012a). As an example, NetIQ
1
incor-
porates a dedicated anomaly detection engine which
detects trend deviations from normal, expected be-
havior. Normal behavior is defined using a baseline of
events requiring at least one week of collected data. A
similar approach is followed by NitroSecurity
2
which
detects anomalous trend deviations by dynamically
calculating baseline behavior. Furthermore, Alien-
Vault
3
incorporates anomaly-based detectors in order
to complement pattern or signature based detectors
(Miller, 2011). In literature, time-series analysis is
also used for this task (Rodriguez and de los Mozos,
2010).
3 EVENT MANAGEMENT
SYSTEM/FRAMEWORK
3.1 SIEM Environment
In support of the managed security service, IBM’s
Tivoli Security Operations Manager (TSOM) is de-
ployed as a SIEM system in the enterprise network.
TSOM gathers data from systems and network appli-
ances in an agent-less manner, using transport proto-
cols such as the Simple Network Management Proto-
col (SNMP) and Syslog. Alternatively, agent-based
communication is supported by the Universal Collec-
tion Module (UCM). Table 1 gives an overview of the
1
http://www.netiq.com
2
http://www.nitrosecurity.com/
3
http://www.alienvault.com/
ICPRAM2013-InternationalConferenceonPatternRecognitionApplicationsandMethods
532

diverse data sources which feed security event infor-
mation into TSOM.
Table 1: Overview of data sources and conduits.
# Source Conduit
421 UNIX/Linux servers Syslog
108 Cisco routers/switches Syslog
57 Windows servers SNMPv2c, UCM
8 IDS solutions Syslog
2 Anti-virus solutions SNMPv2c
The focus of this work is currently based on spe-
cific authentication events originating from 57 Win-
dows servers, the majority of which are Windows
domain controllers hosting Active Directory (AD)
instances. The servers and workstations that are
deployed in the managed services environment are
based on diverse Windows operating systems includ-
ing Windows Server 2003 (R2), Windows Server
2008 (R2), Windows XP, Windows Vista and Win-
dows 7.
In order to forward Windows security events from
TSOM to an external application such as our anomaly
detection engine, the send trap action was configured
(IBM, 2008; Buecker, 2008). The send trap action
makes use of SNMPv2c as a transport protocol and
allows the content of the SNMP trap message to be
customised. Nevertheless, we decided to forward the
entire, native Windows security event. Within our
framework, the content of the SNMP message is then
preprocessed and transformed into a well-structured
data set.
3.2 Anomaly Detection Engine
Our framework is an agent-based platform for collect-
ing, aggregating and interpreting audit trails using ad-
vanced anomaly detection techniques. It is based on
the Java Intelligent Agents Component (JIAC) frame-
work (Albayrak and Wieczorek, 1998) and consists
of three main components which acquire, process and
exploit event information from diverse systems. Fig-
ure 2 gives an overview of all components which are
part of our anomaly detection engine.
Anomaly Detection Engine
Data
Processing
Data
Exploitation
Data
Acquisition
SNMPv2c
TSOM
DB
Windows
Server
CMS
DB2
Anomaly
Detection
Engine
Windows
Server
...
TSOM
S
N
M
P
v
2
c
EAM
Figure 2: Overview of the anomaly detection engine.
Agent technology is a key component of the
framework and provides functionality for data ac-
quisition, data preprocessing, anomaly detection as
well as exploitation. The JIAC framework allows
each component to be distributed amongst individ-
ual agents which can be located on different agent
nodes, thus providing load balancing capabilities.
The data acquisition component currently supports
Comma Separated Value (CSV) files as well as the
Attribute-Relation File Format (ARFF) and is capable
of processing SNMP traps. All event data is stored in
a MySQL database.
The SNMP traps forwarded from TSOM consist
of 24 managed objects, including the native Windows
security event. Within our framework, the content of
all managed objects is preprocessed and transformed
into a well-structured data set which can be effectively
analyzed by anomaly detection techniques. The pars-
ing of SNMP traps is carried out by the SNMP4J
4
API which transforms each trap according to a spe-
cific format that is discussed in the following section.
3.3 Event Parsing
In order to detect suspicious authentication attempts,
password guessing attacks and unusual user account
activities, specific Windows security events need to
be analyzed. Relevant events are provided by the
Logon/Logoff and Account Logon security auditing
policies in Windows domain environments. Lo-
gon/Logoff events enable administrators to track all
successful and failed logon and logoff attempts. Ac-
count Logon events document attempts to authenti-
cate user and computer accounts. Out of both auditing
categories, thirteen Logon/Logoff and four Account
Logon events were selected, as illustrated in Table 2.
Windows security events which are not listed
in Table 2 are neglected by our data acquisition
component. Within our framework, the event con-
tent, entailed in SNMP traps, is transformed into a
well-structured data set according to a specific for-
mat. It consists of a comprehensive set of attributes
which is grouped into two parts: TSOM-specific and
event-specific attributes. TSOM-specific attributes
are based on event information provided by TSOM
itself. Event-specific attributes are based on attributes
which originate from the native Windows security
event.
Additionally, the resulting data set was augmented
by various attributes to increase the contextual back-
ground information. As an example, certain attributes
are useful to distinguish between standard and priv-
ileged users as well as domain controllers, member
4
http://www.snmp4j.org/
EnhancingSecurityEventManagementSystemswithUnsupervisedAnomalyDetection
533

Table 2: Overview of Windows security events.
Logon/Logoff
Use CaseEvent ID Description
1 528 / 4624 Successful Logon
2 540 / 4624 Successful Network Logon
3 529 / 4625 Logon Failure: Unknown user name or bad pass-
word
4 530 / 4625 Logon Failure: Account logon time restriction vi-
olation
5 531 / 4625 Logon Failure: Account currently disabled
6 532 / 4625 Logon Failure: The specified user account has ex-
pired
7 533 / 4625 Logon Failure: User not allowed to logon at this
computer
8 534 / 4625 Logon Failure: The user has not been granted the
requested logon
9 537 / 4625 Logon Failure: An unexpected error occurred dur-
ing logon
10 539 / 4625 Logon Failure: Account locked out
11 576 / 4672 Special privileges assigned to new logon
12 538 / 4634 User Logoff
13 551 / 4647 User initiated logoff
Account Logon
Use CaseEvent ID Description
14 672 / 4768 A Kerberos authentication ticket (TGT) was re-
quested
15 673 / 4769 A Kerberos service ticket was requested
16 675 / 4771 Kerberos pre-authentication failed
17 680 / 4776 A domain controller attempted to validate account
credentials
servers and workstations. Furthermore, geographical
IP information was added for all records containing
external IP addresses.
4 GLOBAL ANOMALY
DETECTION ALGORITHM
4.1 Data Views
As already pointed out previously, unsupervised
anomaly detection algorithms rely on an appropri-
ate preprocessing. In contrast to supervised algo-
rithms which are able to learn which features are im-
portant, this is not possible in an unsupervised set-
ting. For this reason, data views need to be gen-
erated which guide the anomaly detection algorithm
to find outliers. Since single records in the data set
are not an anomaly but a combination of multiple
records might represent one, an appropriate data ag-
gregation is used. In (Chandola et al., 2009) this is
referred to as a complex anomaly detection problem,
whereas anomaly detection algorithms can only deal
with point anomaly detection problems. We defined
the following five data views based on aggregation as
follows:
Per User and Day: Events of single users are aggre-
gated with a time unit of one day,
Per User and Hour: Events of single users are aggre-
gated on an hourly basis. This could potentially iden-
tify users using a workstation during non-business
hours,
Per User, Day and Hour: Same as above with adding
the day as additional feature,
Different Workstations per User: Events generated
at different workstations for each user. This could for
example help to identify fraudulent users “scanning”
the network shares,
Different Users per Workstation: Events of a single
workstation for each single user. The idea behind this
data view is to identify password guessing attempts
(in combination with use cases 3-10) or to identify
violations against company rules for servers (e.g. in
combination with use case 2 one could identify non-
authorized server applications).
Each of the data views was created for all of the 17
event types (use cases) as defined in Table 2. Further-
more, each of the data views above was created for
standard users and privileged users separately since
we assume a different behavior of both groups. Users
to be known as system users (such as backup jobs, ad-
ministrative jobs) were filtered out and not processed
any further. In total, we generated 170 different data
views (17 use cases with 5 different aggregations for
standard and privileged users), whereas some do not
contain enough data and are not processed further, in
particular use cases 4,6,7 and 11. This is most likely
due to the setup of policies in the used infrastructure.
However, if such events will occur in the future they
will be processed automatically.
4.2 Sliding Window
Within our anomaly detection engine, data is
streamed into the database. The anomaly detection al-
gorithm is then applied immediately after the data of a
new time unit is complete (e.g. one hour or one day).
A sliding window with an appropriate length guaran-
tees that old data is not used any more in the live sys-
tem in order to adapt to changing user behavior or
infrastructure changes. Also, anomalies are only re-
ported once when they occur for the first time.
4.3 Global k-NN Algorithm
The choice of the used anomaly detection algorithms
is crucial, especially if a local or a global anomaly
detection method needs to be used. Although we pre-
sume that our problem is global, we tried out different
ICPRAM2013-InternationalConferenceonPatternRecognitionApplicationsandMethods
534
methods. A very efficient and parallel implementation
of anomaly detection algorithms can be found in the
Anomaly Detection Extension
5
of RapidMiner (Mier-
swa et al., 2006). Since we know from (Amer
and Goldstein, 2012) that clustering based methods
perform not as well as nearest-neighbor based ap-
proaches, we focused on the latter. In particular,
we investigated the local approaches LOF (Breunig
et al., 2000), COF (Tang et al., 2002), LoOP (Kriegel
et al., 2009) and INFLO (Jin et al., 2006). For
global algorithms, the k-nearest-neighbor (Angiulli
and Pizzuti, 2002) and the k
th
-nearest-neighbor (Ra-
maswamy et al., 2000) approach was used. The dif-
ference between both is that the latter uses only one
nearest neighbor for anomaly scoring whereas the first
estimates the score by averaging over all N
k
neigh-
bors:
anomaly score(p) =
∑
o∈N
k
(p)
d(p, o)
|N
k
(p)|
(1)
Our investigation showed that global methods per-
form best, especially the k-NN approach averaging
over all neighbors. Since we do not have a labeled
data set, the evaluation was done qualitative based on
if “interesting” outliers are found as discussed later
in Section 5. Furthermore, the parameter k has to be
determined, which is important for the detection of
microclusters. Recalling the example of Figure 1, the
microcluster c
3
could be identified as normal for k = 2
or as outlier for k ≥ 3. In practice, values smaller then
k = 10 are not used in order to cope with statistical
fluctuation in the data. We performed experiments for
10 ≤ k ≤ 30 and did not find significant changes in the
outlier scores of the algorithm. Thus we can conclude
that microclusters are not contained in the data.
Before the anomaly detection algorithm was ap-
plied, the data was normalized to [0,1] for each single
feature to ensure equal influence on the result. This
also results in anomaly scores in the range of [0,1]
with zero indicating a very normal record and records
close to one indicating anomalies.
5 RESULTS
Our developed anomaly detection framework is able
to run either live in an actual deployment via receiv-
ing SNMP traps in a network infrastructure or as an
offline application with previously collected data. For
the ease of evaluation, we are presenting the results of
a three months data collection with a sliding window
of two months. In the next subsection, the data within
5
For source code and binaries see
http://madm.dfki.de/rapidminer/anomalydetection
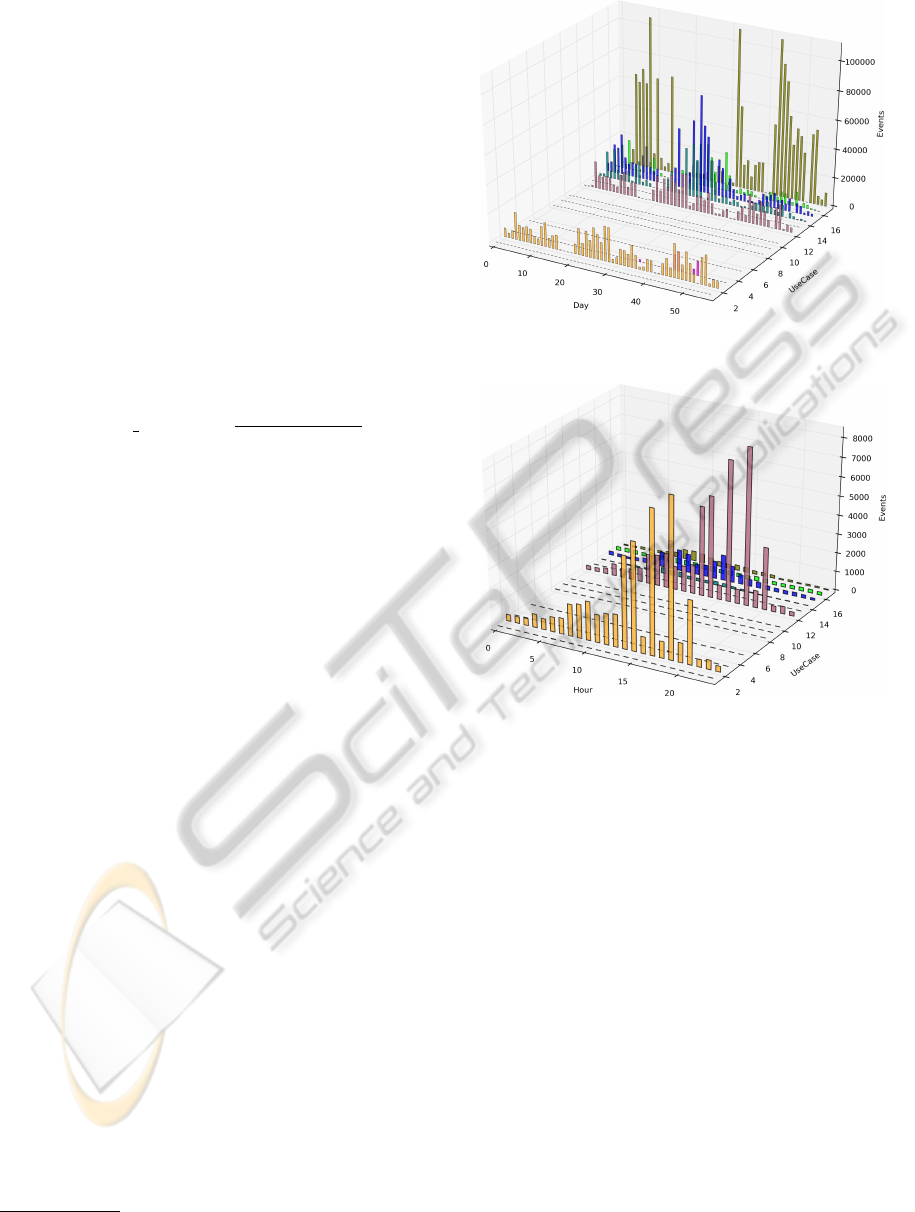
Figure 3: The number of events of standard users per use
case and day.
Figure 4: The number of events of privileged users per use
case and hour of the day.
the sliding window is presented first and the detected
outliers are finally reported in Subsection 5.2.
5.1 Data Analysis/Manual Investigation
Figure 3 shows the number of events generated by
standard users for each single day of the two months
sliding window and for each use case separately. It
can be seen that the amount of events does not only
vary between the use cases but also among the days.
Determining whether single users are responsible for
such large deviations or if this is indeed a normal be-
havior is the task of the anomaly detection algorithm.
For a second visualization, the data was aggre-
gated based on 24 time bins in order to investigate
the distribution of the events over the day. As ex-
pected, Figure 4 shows a typical distribution of events
for most of the use cases with a majority of the events
within the business hours and only few events during
the rest of the day for privileged users. However, use
case 2 (successful network logon) and 12 (user log-
EnhancingSecurityEventManagementSystemswithUnsupervisedAnomalyDetection
535
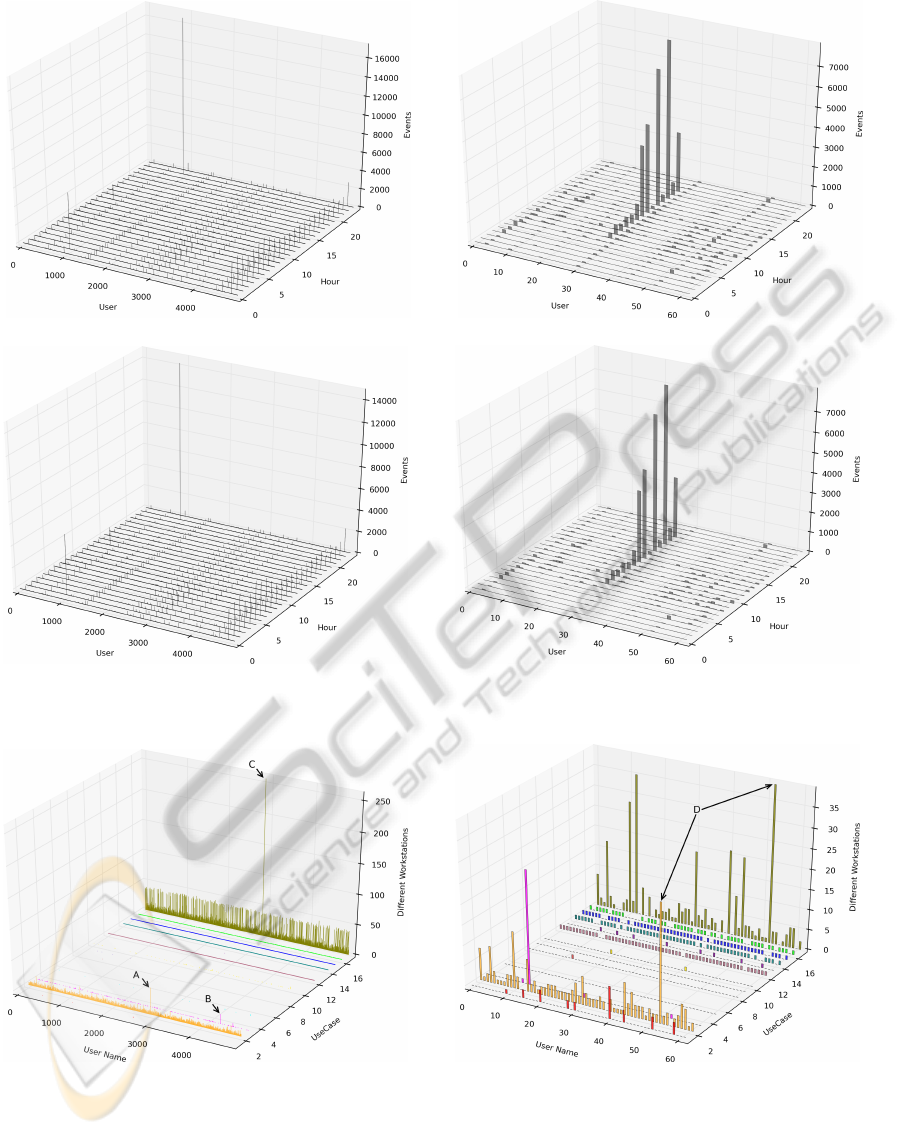
(a) Use case “successful network logon” (standard users). (b) Use case “successful network logon” (privileged users).
(c) Use case “user logoff” (standard users). (d) Use case “user logoff” (privileged users).
Figure 5: Data views for different use cases based on an hourly data aggregation.
(a) Standard users. (b) Privileged users.
Figure 6: The different number of workstations per use case used by each (a) standard and (b) privileged user.
off) already show a non-expected peaky behavior in
the afternoon that will also be subject of the anomaly
detection.
5.2 Unsupervised Anomaly Detection
Although the system handles 170 data views, we can
only describe a few interesting results exemplary in
ICPRAM2013-InternationalConferenceonPatternRecognitionApplicationsandMethods
536

this work. Figure 5 shows four data views for the
hourly data aggregation. While Figure 5(a) and 5(b)
show the data of use case 2 for standard and privileged
users, Figure 5(c) and 5(d) show the data of use case
12.
It can be seen that most of the events of each data
view are generated by a few users only. Thus, the
applied k-NN anomaly detection reports one standard
user as anomalous in hour 22, with an anomaly score
of 0.93 for use case 2 and 0.92 for use case 12. Sim-
ilarly, our system reports one privileged user for both
use cases 2 and 12. He receives an anomaly score of
0.76 for hour 18 and 0.63 in hour 16. Please note that
the visualization of the data can only be performed
when having at most three dimensions which is not
the case for all of our defined data views. In this case,
the results are presented as tables to the security oper-
ators.
As a second exemplary result, we look at the num-
ber of different workstations per user. Figure 6 shows
the aggregated data for (a) standard users and (b) priv-
ileged users.
Our system detected the three anomalies A, B
and C within the standard users although especially
anomaly B contains a rather small absolute amount of
events as compared to the amount of normal events
of use case 17. Within the data view of privileged
users, one account could be identified as anomalous
in use cases 2 and 17 (D). Among others, the system
detected a “SAS Business Intelligence” account that
performed several transactions on multiple worksta-
tions and was previously incorrectly categorized as a
user account. Additionally, a legacy account that was
used to manage all Windows computers in a Novell
network was identified as an anomaly because it gen-
erated a high logon failure rate due to a mismatch be-
tween the Novell password and the account’s pass-
word.
6 CONCLUSIONS
In this work we present an unsupervised anomaly de-
tection approach for extending SIEM appliances with
two main contributions: (1) The proposed system is
applicable in practice and extends already deployed
commercial systems with an anomaly detection en-
gine and (2) the usefulness of unsupervised anomaly
detection was evaluated qualitatively on real world
data in a large enterprise network. In contrast to semi-
supervised anomaly detection, which is already part
of commercial systems, our proposed unsupervised
system does not require any “anomaly-free” train-
ing phase and is to our knowledge the first proposed
approach combining unsupervised anomaly detection
and SIEM systems. Six different anomaly detection
algorithms have been evaluated and finally the global
k-NN approach was selected. The detected anomalies
in our field study were valuable to the security op-
erator center team: Besides misconfigurations some
interesting insights about the infrastructure have been
found. Those results have not been reported by the
traditional rule-based SIEM system.
ACKNOWLEDGMENTS
This work is part of ADEWaS, a project of Deutsche
Telekom Laboratories supported by German Research
Center for Artificial Intelligence (DFKI) GmbH and
T-Systems International, South Africa.
REFERENCES
Albayrak, S. and Wieczorek, D. (1998). JIAC - an open and
scalable agent architecture for telecommunication ap-
plications. Intelligent Agents for Telecommunication
Appl.
Amer, M. and Goldstein, M. (2012). Nearest-neighbor
and clustering based anomaly detection algorithms for
rapidminer. In Proc. of the 3rd RCOMM 2012.
Angiulli, F. and Pizzuti, C. (2002). Fast outlier detection in
high dimensional spaces. In PKDD, volume 2431 of
LNCS, pages 43–78. Springer.
Breunig, M. M., Kriegel, H.-P., Ng, R. T., and Sander, J.
(2000). Lof: identifying density-based local outliers.
SIGMOD Rec., 29(2):93–104.
Buecker, A., e. a. (2008). IBM Tivoli Security Operations
Manager 4.1. Deployment Guide Series. IBM Red-
books, 1st edition.
Chandola, V., Banerjee, A., and Kumar, V. (2009).
Anomaly detection: A survey. ACM Comput. Surv.,
41(3):1–58.
Endsley, M. R. (1987). The application of human factors to
the development of expert systems for advanced cock-
pits. In Human Factors Society 31st Annual Meeting.
Garcia-Teodoro, P. and et al (2009). Anomaly-based net-
work intrusion detection: Techniques, systems and
challenges. Computers and Security, 28:18 – 28.
Grubbs, F. E. (1969). Procedures for detecting outlying ob-
servations in samples. Technometrics, 11:1–21.
He, Z., Xu, X., and Deng, S. (2003). Discovering cluster-
based local outliers. Pattern Recognition Letters,
24(9-10):1641 – 1650.
Hodge, V. J. and Austin, J. (2004). A survey of outlier de-
tection methodologies. Artificial Intelligence Rev., 22.
IBM (2008). Tivoli Security Operations Manager Version
4.1.1 - Administration Guide. IBM, 1st edition.
http://publib.boulder.ibm.com/infocenter/tivihelp/v2r
1/topic/com.ibm.netcool som.doc/tsom411 admin.pdf.
EnhancingSecurityEventManagementSystemswithUnsupervisedAnomalyDetection
537

Jin, W., Tung, A., Han, J., and Wang, W. (2006). Ranking
outliers using symmetric neighborhood relationship.
In Advances in Knowledge Discovery and Data Min-
ing, volume 3918 of LNCS, pages 577–593. Springer.
Kriegel, H.-P., Kr
¨
oger, P., Schubert, E., and Zimek, A.
(2009). Loop: local outlier probabilities. In CIKM
’09, pages 1649–1652. ACM.
Mierswa, I., Wurst, M., and et al (2006). Yale (now: Rapid-
miner): Rapid prototyping for complex data mining
tasks. In Proc. of the ACM SIGKDD 2006.
Miller, D. R. e. a. (2011). Security Information and Event
Management (SIEM) Implementation. The McGraw-
Hill Companies.
Nicolett, M., e. a. (2011). Magic Quadrant for Security In-
formation and Event Management. Gartner RAS Core
Research, (ID:G00212454).
Nicolett, M. and Kavanagh, K. M. (2012a). Critical Capa-
bilities for Security Information and Event Manage-
ment. Gartner RAS Core Research, (ID:G00227900).
Nicolett, M. and Kavanagh, K. M. (2012b). Magic Quad-
rant for Security Information and Event Management.
Gartner RAS Core Research, (ID:G00227899).
Ramaswamy, S., Rastogi, R., and Shim, K. (2000). Efficient
algorithms for mining outliers from large data sets. In
Proce. of the 2000 ACM SIGMOD, pages ”427–438”.
Rodriguez, A. C. and de los Mozos, M. R. (2010). Improv-
ing network security through traffic log anomaly de-
tection using time series analysis. In CISIS’10, pages
125–133.
Tang, J., Chen, Z., Fu, A., and Cheung, D. (2002). Enhanc-
ing effectiveness of outlier detections for low density
patterns. In Advances in Knowledge Discovery and
Data Mining, volume 2336 of LNCS, pages 535–548.
Springer.
ICPRAM2013-InternationalConferenceonPatternRecognitionApplicationsandMethods
538
