
Comparing Touch and Tilt Interaction using an iPhone Game for
Children
David Furió
1†
, M.-Carmen Juan
1∗
, Ignacio Seguí
2
, M. José Vicent
1
and Francisco Abad
1
1
Instituto Universitario de Automática e Informática Industrial, Universitat Politècnica de València,
Camino de Vera, s/n, 46022 Valencia, Spain
2
AIJU, Avda. de la Industria, 23, 03440 Ibi, Alicante, Spain
Keywords:
Mobile Devices, Interaction Preference, Touch Interaction, Tilt Interaction, iPhone.
Abstract:
In this paper, we present a study that compares tilt and touch-screen interaction in a 2D iPhone game for
children. The trials involved 58 children from 8 to 10 years old. The results showed that the children found
touch-screen interaction easier. With regard to engagement and fun, no significant differences were found
between the two interaction methods. However, differences between boys and girls were found with the score
given to the game. Another interesting result is that the children had no preferred interaction method.
1 INTRODUCTION
Mobile devices incorporate touch displays and other
hardware features that let the consumers use bodily
and gestural interaction. Touch sensitive screens let
the users have precise control in their actions like
other pointer interaction methods such as a mouse or
a stylus (Schwarten et al., 2008). Touch-based in-
teraction has received positive feedback from users,
which has made possible to improve the user experi-
ence when using mobile devices (Dittenberger et al.,
2009). Bodily and gestural interaction has become
very widespread in the last years, possibly due to pro-
gresses that have made this technology cheaper and
more easily integrated in mobile devices (Kratz et al.,
2011). Bodily interaction that involves device move-
ment, like tilting, has been successfully applied in
gaming scenarios (Kratz et al., 2011). Tilt interaction
method uses the inclination angle of a device. This
kind of interaction let the users have intuitive manip-
ulation since the device is at their hands (Schwarten
et al., 2008).
1.1 Motivation and Objective
Studies about interaction methods that use mobile de-
vices are centred primarily on scrolling web pages,
panning maps or navigating in menus (Schwarten
et al., 2008). These kind of studies are mainly fo-
cused on adults and not on children (Inkpen, 2001).
Furthermore, not many studies examine gender dif-
ferences. For these reasons, we decided to conduct
a study with the aim to investigate children’s interac-
tion experience, ease of use and their preference for
the interaction method in an iPhone 2D game.
In order to obtain a better understanding of chil-
dren’s interaction experience, we tried to answer the
following questions in our study: Will touch interac-
tion be faster and easier to use for children as it is for
adults? Will tilt interaction be funnier for children as
it is for adults? Will gender have a significant effect
on the interaction method used?
The paper is organised as follows. Section 2 dis-
cusses related work. Section 3 describes the game.
Section 4 presents the study. Section 5 displays the
results. Finally, in Section 6, a number of conclusions
and areas for future research are identified.
2 RELATED WORK
In the lasts few years, the advances in mobile tech-
nology has made possible the popularisation of in-
teraction forms that use the accelerometer and the
touch-screen display. Since then, several interaction
studies related to mobile devices comparing tilt or
touch-screen interaction to other interaction methods
have been presented (van Tonder and Wesson, 2010;
Büring et al., 2008; Schwarten et al., 2008; Cho et al.,
2007), but to our knowledge no work that compares
tilt and touch-screen interaction for children has been
submitted.
389
Furió D., Juan M., Seguí I., Vicent M. and Abad F..
Comparing Touch and Tilt Interaction using an iPhone Game for Children.
DOI: 10.5220/0004218403890392
In Proceedings of the International Conference on Computer Graphics Theory and Applications and International Conference on Information
Visualization Theory and Applications (GRAPP-2013), pages 389-392
ISBN: 978-989-8565-46-4
Copyright
c
2013 SCITEPRESS (Science and Technology Publications, Lda.)
In van Tonder and Wesson and Büring, Gerken,
and Reiterer studies map navigation applications were
developed (van Tonder and Wesson, 2010; Büring
et al., 2008). Schwarten et al., and Cho et al., de-
veloped image editing or manipulation applications
(Schwarten et al., 2008; Cho et al., 2007). The re-
sults of these studies showed that tilt interaction pre-
sented some problems such as reflections or strained
wrists. Despite this, tilting was considered funnier
and more interesting than other interaction methods.
Touch-screen was considered more precise and easier.
Furthermore, all of these studies were centred on tasks
(e.g., map navigation or image manipulation) that re-
quire to check which interaction method is the most
efficient and usable, leaving the engagement and the
preferences in a second place. But in our case, since
we have developed a game, the engagement and fun
and the preferred interaction methods are also impor-
tant factors to take into consideration.
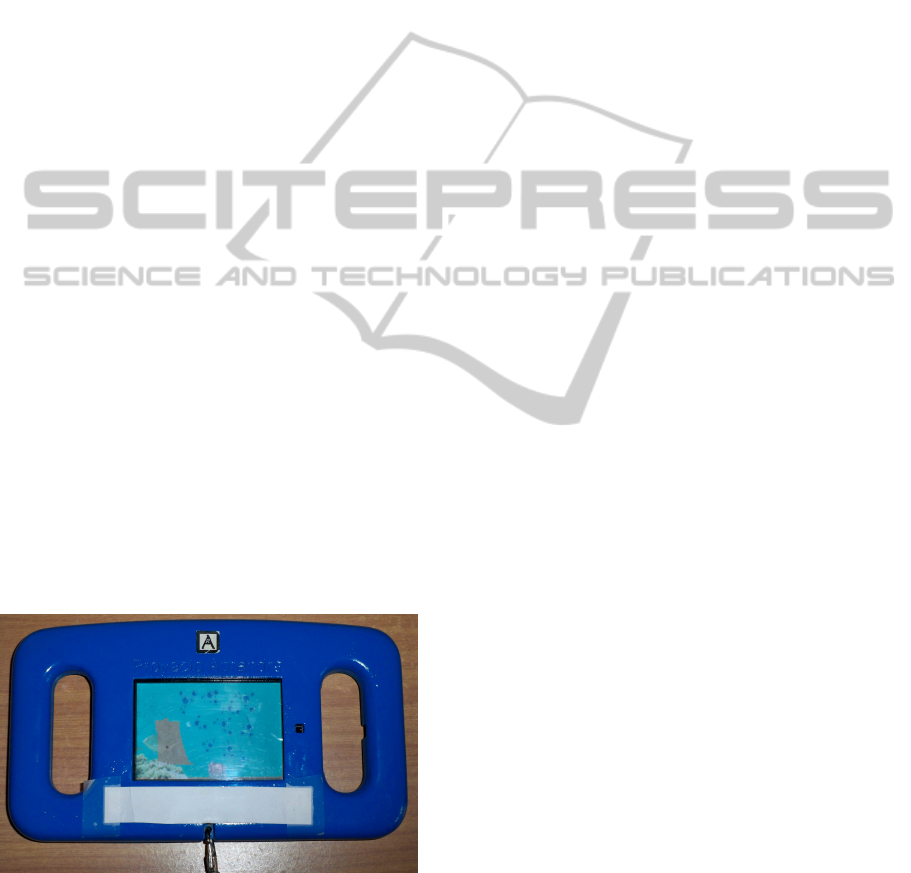
3 THE GAME
The game was aimed to test which interaction style
(touch-screen or tilt) was preferred and felt more com-
fortable for children. During the game, the children
had to clean a dirty sea (turning the sea’s brown colour
to a blue colour) using a soap that appeared in the cen-
tre of the screen (Figure 1). How they could use the
soap depended on the interaction mode. If the game
was in touch-screen mode, they had to touch-and-drag
the soap around the screen to clean the sea. If the
game was in tilt mode, they had to tilt the device to
move the soap around the screen. There was no time
limit for completing the task and tilt mode had a set
calibration for all the children.
Figure 1: Almost cleaned blue sea.
4 STUDY
Fifty-eight children from 8to 10 years old –with a
mean age of 9.14±0.66– took part in the study: 27
boys (47%) and 31 girls (53%). The children attended
the Summer School of the UPV.
The children who participated in the study were
randomly assigned and counterbalanced to one of two
groups:
• A: Play the game with touch-screen interaction
first and then with tilt interaction.
• B: Play the game with tilt interaction first and then
with touch-screen interaction.
First, some instructions were given to the children
about how to play the game. Then, the group A played
the game with touch-screen interaction. After com-
pleting the game, they answered the post-game ques-
tionnaire Q1. Next, these children played the game
with tilt interaction and filled in the ending question-
naire (Q2). The group B did the same but using first
tilt interaction and then touch-screen interaction. The
questionnaires were filled in in the same room where
the activity took place. One person was in the ac-
tivity room in order to clarify doubts to the children.
During the trials, the children used an iPhone 3GS
equipped with an external case to protect the device
against shocks and falls (see Figure 1).
Two questionnaires were used for the validation.
Table 1 shows the relation of questions for each ques-
tionnaire. Answers of questions 1, 3, 4 and 5 followed
a Likert scale that ranged from 1 (strongly disagree)
to 5 (strongly agree). Questions 2, 6 and 7 had cate-
gorical answers (answers in brackets were the possi-
ble choices). And questions 8 and 9 had hand-written
answers. Questionnaires were kept short since they
would be used by children.
The first questionnaire (Q1) was composed of
questions 1 to 5 (see Table 1). The questionnaire was
made to collect data about the ease of use and en-
gagement the children had after using an interaction
method.
The second questionnaire (Q2) was composed of
questions 1, 3 and 5 to 9 (see Table 1). Some of the
questions were the same as in Q1, which allowed us to
compare if the order of playing affected the children’s
experience.
5 RESULTS
To measure how much fun the children had play-
ing the game (question 1 in Table 1), we performed
a mixed design ANOVA test to take into consid-
eration several factors simultaneously. The signifi-
cance level was set to 0.05 in all tests. No signifi-
cant differences in any of the factors studied (gender:
GRAPP2013-InternationalConferenceonComputerGraphicsTheoryandApplications
390

Table 1: Numbered questions and their appearance in each
questionnaire. The last two questions are hand written. An-
swers in brackets are a summary of the possible choices.
The rest of answers follow a Likert scale.
# Q1 Q2 Question
1 x x Did you have fun playing the game?
2 x
Would you like to play again? [Yes / No /
Maybe]
3 x x Did you find it easy to play?
4 x
Would you like to use this system in other
games?
5 x x Please, score the game from 1 to 10.
6 x
Which interaction method did you find it
easier? [Touch-Screen / Tilt]
7 x
Which interaction method do you prefer?
[Touch-Screen / Tilt]
8 x Why?
9 x What did you like the most?
F[1,54]=0.22, p=0.64; grade: F[1,54]=1.61, p=0.21;
method: F[1,54]=3.05, p=0.09; order: F[1,54]=0.52,
p=0.48). The global rating was high (4.59±0.56),
which means that the children had fun playing the
game with both interaction methods.
We performed another mixed design ANOVA test
to measure how easy it was to play the game for the
children (question 3 in Table 1). While the global
rating was high (4.52±0.73), meaning that the chil-
dren found the game easy to play with both inter-
action methods, the score given to touch-screen in-
teraction was higher (4.71±0.53) than tilt interaction
(4.33±0.84). We can see the results of the mixed de-
sign analysis in Table 2, which showed significant dif-
ferences in the interaction type.
Table 2: Mixed design ANOVA for the ease of use. N = 58.
The symbol * indicates significant differences.
Factor d.f. F p η
2
Gender 1 0.54 0.46 0.01
Grade 1 0.32 0.57 0.01
Interaction method 1 7.79 0.01 * 0.04
Order 1 0.02 0.88 <0.01
Factor Interactions 1 <1.53 >0.22 <0.01
Furthermore, we asked the children if they would
like to use these interaction systems in other games
(question 4 in Table 1). The score given was high, and
both interaction methods obtained almost the same re-
sult (4.59±0.78 for tilt and 4.59±0.63 for touch). A
multifactorial ANOVA was performed in order to ob-
serve if there were significant differences in question
4 responses. No significant differences were found
in any of the factors (gender:F[1,50]=1.41, p=0.24;
grade: F[1,50]=0.10, p=0.76; method: F[1,50]<0.01,
p=0.96).
We performed a mixed design ANOVA to measure
the differences in the score given to the game by the
children when playing with touch-screen or tilt inter-
action (question 5 in Table 1). We can see the results
of the mixed design analysis in Table 3, which show
significant differences in the gender and interaction
type factors. The girls (9.40±0.88) rated the game
higher than the boys (8.52±1.37) and tilt interaction
obtained higher results (9.12±1.24) than touch-screen
interaction (8.86±1.18).
Table 3: Mixed design ANOVA for the game scores. N =
58. The symbol * indicates significant differences.
Factor d.f. F p η
2
Gender 1 8.23 0.01 * 0.1
Grade 1 0.01 0.91 <0.01
Interaction method 1 4.15 0.05 * 0.02
Order 1 0.25 0.62 <0.01
Factor Interactions 1 <2.20 >0.14 <0.02
A Chi-squared test for question 7 in Table 1, re-
vealed that the preference for the touch-screen or tilt
was not affected by the order of play (χ
2
[1, N=58]
= 0.07, p = 0.79, Cramer’s V = 0.07). A total of
55.17% of the children in the group A chose touch-
screen interaction and 51.72% of the children in the
group B preferred tilting. We also performed a Chi-
squared test to determine if there were differences in
preference of the interaction types between boys and
girls. The results showed that there were no differ-
ences (χ
2
[1, N=58] = 1.11, p = 0.29, Cramer’s V =
0.17). Girls preferred slightly more the tilt interaction
(58.06%) while boys favoured marginally the touch-
screen interaction (59.26%).
Regarding the preference for the easiest interac-
tion method (question 6 in Table 1), the children
of both groups favoured touch-screen rather than tilt
(group A: 63.33% and group B: 60.71%). The Chi-
squared test showed no significant differences be-
tween the interaction types (χ
2
[1, N=58] = <0.01, p
= 0.95, Cramer’s V = 0.03). The same test was ap-
plied to determine if there were differences between
boys and girls, but the results revealed no significant
differences (χ
2
[1, N=58] = 0.47, p = 0.49, Cramer’s
V = 0.13). Boys (55.56%) and girls (67.74%) found
easier touch-screen interaction than using tilting.
6 CONCLUSIONS
We have conducted a study with the aim to research
on children’s interaction experience and their pref-
erences about their favourite and easiest interaction
method. Fifty-eight children have participated in the
trials.
ComparingTouchandTiltInteractionusinganiPhoneGameforChildren
391

The results have shown some interesting findings.
Girls gave a higher score to the game. Girls seem
to prefer to use computers for goal-oriented activities
with meaningful contexts (Kay, 2008). The game de-
veloped provided a goal with a meaningful context
(clean the dirty sea). This might have been the reason
why the girls scored higher the game. With regard to
the results about ease of use, we could see that both
groups considered touch-screen interaction easier and
more precise than tilt interaction. This is encouraging
because it shows that children could adapt to differ-
ent interaction types without major problems. With
regard to engagement and fun, the results revealed
that the children had similar enjoyment when play-
ing with tilt and touch-screen interaction. With regard
to the general preferences about the game, the analy-
ses showed that the children did not favour one inter-
action over the other. Subjects also stated that they
would like to use these interaction systems in other
games.
When comparing our study to other studies with
adult people, we can observe similar trends with re-
gard to the ease of use, where touch-screen interac-
tion was found easer and more precise (Schwarten
et al., 2008; van Tonder and Wesson, 2010). In con-
trast, there are differences with regard to the engage-
ment and fun. While, in our study, children consid-
ered equally fun playing with touch-screen or tilt in-
teraction, adults usually found funnier using tilt inter-
action (Schwarten et al., 2008; Cho et al., 2007). It
is important to note that in the studies of (Schwarten
et al., 2008) and (Cho et al., 2007) the tasks performed
were image manipulation and image navigation, re-
spectively. In our case, the task performed was to play
a game. Thus, it is possible that playing an engag-
ing task (like a game) made that the children found
the two interaction methods fun. A future study must
be conducted in order to see how the children would
rate the interaction types in an application that is not
a game.
With regard to future work, allowing them to cal-
ibrate the accelerometer when using tilt interaction
could enhance the experience. The game could also
be improved by adding different levels where obsta-
cles appear in the middle of the screen making the
experience more difficult. We could also add other
interaction methods to compare, like the use of but-
tons. In this study, using the device with or without
an external case was not tested. Thus, it would be in-
teresting to perform a comparison between using the
device with the external case and using it without the
external case, in order to observe whether or not the
external case actually helps the children move the de-
vice.
ACKNOWLEDGEMENTS
This work was funded by the Spanish APRENDRA
project (TIN2009-14319-C02). For their contribu-
tions, we would like to thank the following: the peo-
ple who helped in the development and validation; the
Summer School of the UPV; the children who partic-
ipated in this study; and the ETSInf for letting us use
its facilities during the testing phase.
REFERENCES
Büring, T., Gerken, J., and Reiterer, H. (2008). Zoom
interaction design for pen-operated portable devices.
International Journal of Human-Computer Studies,
66(8):605–627.
Cho, S. J., Choi, C., Sung, Y., Lee, K., Kim, Y. B., and
Murray-Smith, R. (2007). Dynamics of tilt-based
browsing on mobile devices. In CHI 07 extended ab-
stracts on Human factors in computing systems CHI
07, page 1947. ACM Press.
Dittenberger, S., Geven, A., Tscheligi, M., and Mayer, M.
(2009). Touch based interaction using a three dis-
play interface design. Proceedings of the 11th In-
ternational Conference on HumanComputer Interac-
tion with Mobile Devices and Services MobileHCI 09,
page 1.
Inkpen, K. M. (2001). Drag-and-drop versus point-
and-click mouse interaction styles for children.
ACM Transactions on Computer-Human Interaction,
8(1):1–33.
Kay, R. (2008). Exploring Gender Differences in
Computer-Related Behaviour: Past, Present, and Fu-
ture. In Kidd, T. T. and Chen, I., editors, Social Infor-
mation Technology: Connecting Society and Cultural
Issues, pages 12–30. IGI Global.
Kratz, S., Rohs, M., Wolf, K., Müller, J., Wilhelm, M., Jo-
hansson, C., Tholander, J., and Laaksolahti, J. (2011).
Body, movement, gesture & tactility in interaction
with mobile devices. Proceedings of the 13th In-
ternational Conference on Human Computer Interac-
tion with Mobile Devices and Services MobileHCI 11,
page 757.
Schwarten, L., Walther-Franks, B., Grimmer, C., and Feige,
S. (2008). A comparison of motion and keypad in-
teraction for fine manipulation on mobile devices. In
Proceeding BCS-HCI ’08 Proceedings of the 22nd
British HCI Group Annual Conference on People
and Computers: Culture, Creativity, Interaction, vol-
ume 2, pages 93–103.
van Tonder, B. and Wesson, J. (2010). Is tilt interaction
better than keypad interaction for mobile map-based
applications? In Proceedings of the 2010 Annual
Research Conference of the South African Institute of
Computer Scientists and Information Technologists on
- SAICSIT ’10, pages 322–331, New York, New York,
USA. ACM Press.
GRAPP2013-InternationalConferenceonComputerGraphicsTheoryandApplications
392
