
Identifying Characteristic Physiological Patterns of Mentally Ill
Patients using Nonlinear Analysis of Plethysmograms
Yuyu Hu, Wenbiao Wang, Takashi Suzuki and Mayumi Oyama-Higa
Department of Systems Innovation, Osaka University, Toyonaka, Osaka 560-8531, Japan
Keywords: Plethysmogram, Mental Illness, Largest Lyapunov Exponent, Autonomic Nerve Balance.
Abstract: We measured the pulse waves of 195 mentally ill patients and 113 healthy students. Using heartbeat
changes, we calculated the values which represent the intensity of their sympathetic and parasympathetic
activities, and the values of their autonomic nerve balance (ANB). In addition, we obtained the largest
Lyapunov exponents (LLE) by non-linear analysis of plethysmograms. Values were analyzed by group. The
results revealed a significant relationship between LLE and ANB. The sympathetic nerve values in the
patient group were significantly higher than those in the student group, whereas the LLE values were
significantly lower. Furthermore, we illustrated the dynamic change in the results for single participants
over several testing times. The measurement of pulse waves is easy and economical and does not put a
strain on the subject. Additionally, these values are likely to provide information that is more accurate than
medical examination obtained from an interview. Our study contributed to the existing methodology in this
field, and future data collection and measurement will be carried out. We hope that our study will be useful
for neurologists and psychotherapists in their detection and treatment of mental illnesses.
1 INTRODUCTION
The total number of people suffering from
depression in Japan which was 433,000 in 1996 and
1,041,000 in 2008, has increased to 2.4 times over
the 13 years according to “the patient investigation”
held every three years by Japanese Ministry of
Health, Labour and Welfare. Depression, a mental
disorder marked by sudden feelings of melancholia,
anxiety, and worthlessness, which is closely related
to suicide, has become a serious social problem.
Early detection of depression is therefore
necessary for sustained mental health in everyday
life. Motivated by this urgent need, we examined in
this study how physiological data of depression
sufferers differed from those of individuals in good
health.
This study has succeeded in identifying the
characteristic patterns of mentally disease sufferers
in terms of certain physiological indexes.
Furthermore, a self-check system has been
developed, enabling people to check their status of
mental health in a convenient and economical way.
The next section will describe the experiment
and explain the method, namely, chaos analysis,
which is essential in this study and has been
effectively applied in numerous previous studies.
Then the following section will give the analysis and
results in details.
2 EXPERIMENT AND METHOD
2.1 Subjects
A professional counsellor helped measure the pulse
waves of the mentally ill patients, whose ages and
names of diseases are shown in Table 1. The gender
is undisclosed.
The students’ data were collected from healthy
university students of Kwansei Gakuin University in
Nishinomiya, Japan. They include 42 males and 71
females, with the average age of 19.61 and the
standard deviation of 1.90. Informed consent was
obtained from all participants in the study. Table 1
also presents the number of times the pulse waves
were measured, and the total duration of the pulse
waves measurement in a sub-sample of the patient
group.
69
Hu Y., Suzuki T., Wang W. and Oyama-Higa M. (2012).
Identifying Characteristic Physiological Patterns of Mentally Ill Patients using Nonlinear Analysis of Plethysmograms.
In Proceedings of the Sixth International Symposium on e-Health Services and Technologies and the Third International Conference on Green IT
Solutions, pages 69-73
DOI: 10.5220/0004474300690073
Copyright
c
SciTePress
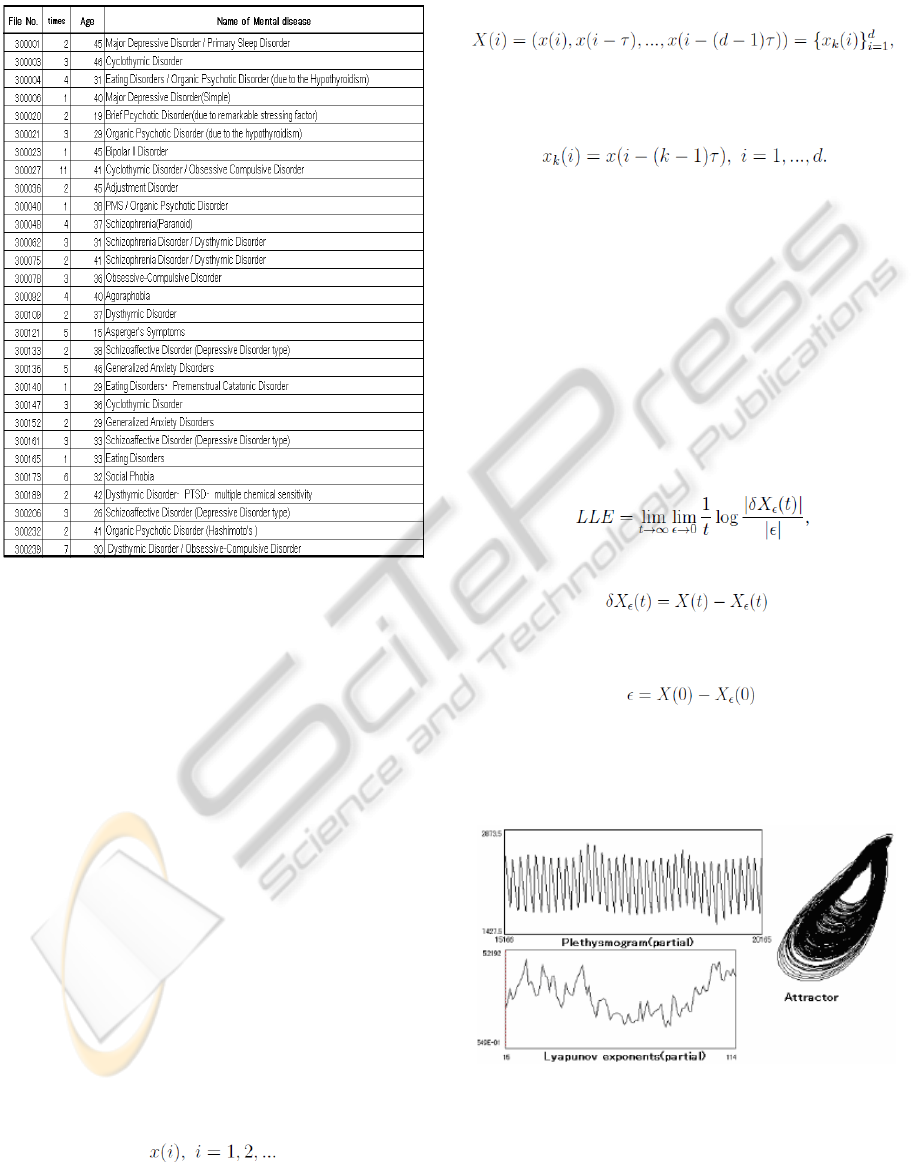
Table 1: Partial list of the mentally ill patients included in
the calculations.
2.2 Procedure
After obtaining informed consent, we measured the
pulse waves using a photoplethysmography sensor
(CCI BC2000). The room temperature was 25°C.
Each subject was asked to sit in a chair and keep
his or her eyes open during the measurements, which
were taken using a cuff attached to the left index
finger. For each time of the measurement, the pulse
waves of each subject were measured for at least
three minutes, since the measurement for more than
two minutes is necessary to correctly calculate the
autonomic nerve balance (ANB), which is an
important parameter in our study and will be
explained in Section 3.1.
2.3 Method of Chaos Analysis—The
Calculation of Largest Lyapunov
Exponent
It has been evidenced that time series data with
deterministic chaos can be constituted by fingertip
plethysmograms (Tsuda, Tahara and Iwanaga, 1992).
Let
denote the time series data. By the method of delays,
the phase space is reconstructed, which contains
vectors in the form of
(1)
where τ is a constant delay, d is the embedding
dimension and
(2)
In order to reconstruct the phase space correctly, the
parameters of the delay τ and the dimension d should
be chosen optimally (Abarbanel et al., 1993). In our
study, considering the time series recorded from
fingertip pulse waves, it has been shown that the
optimal choice is τ = 50 ms and d = 4 (Sano and
Sawada, 1985; Sumida et al., 2000).
The largest Lyapunov exponent (LLE) is one of
the essential measures of complexity in the
reconstructed phase space, which reflects the
divergence of the attractor trajectory. Considering
X(t) as the evolution with time from some initial
trajectory X(0), LLE is given by
(3)
where
(4)
and the initial difference vector
(5)
in the phase space. LLE is estimated by applying the
algorithm of Sano and Sawada (1985).
Figure 1 shows the plethysmogram and attractor
obtained from the measurements, and LLE obtained.
Figure 1: Plethysmogram (top), attractor (right) and LLE
(bottom).
Previous studies (Imanishi and Oyama-Higa,
2006; Oyama-Higa and Miao, 2006; Oyama-Higa,
EHST/ICGREEN 2012
70
Miao and Mizuno-Matsumoto, 2006) have shown
that LLE serves as a significant indicator of mental
immunity. The values of LLE of a mentally healthy
individual fluctuate within a reasonable scope. When
LLE is abnormally high, the mental immunity of the
individual is so strong that he or she is likely to go to
extremes, such as committing crime. On the other
hand, when it is abnormally low, the mental
immunity is so weak that the individual is prone to
mental illnesses.
3 ANALYSIS AND RESULT
3.1 Analysis of Plethysmograms using
“Lyspect”
We analyzed the plethysmograms using a software
called Lyspect, developed by Chaos Technology
Research Lab in Shiga, Japan. Lyspect is able to
perform chaos analysis and analysis of ANB, using
finger plethysmograms as input data.
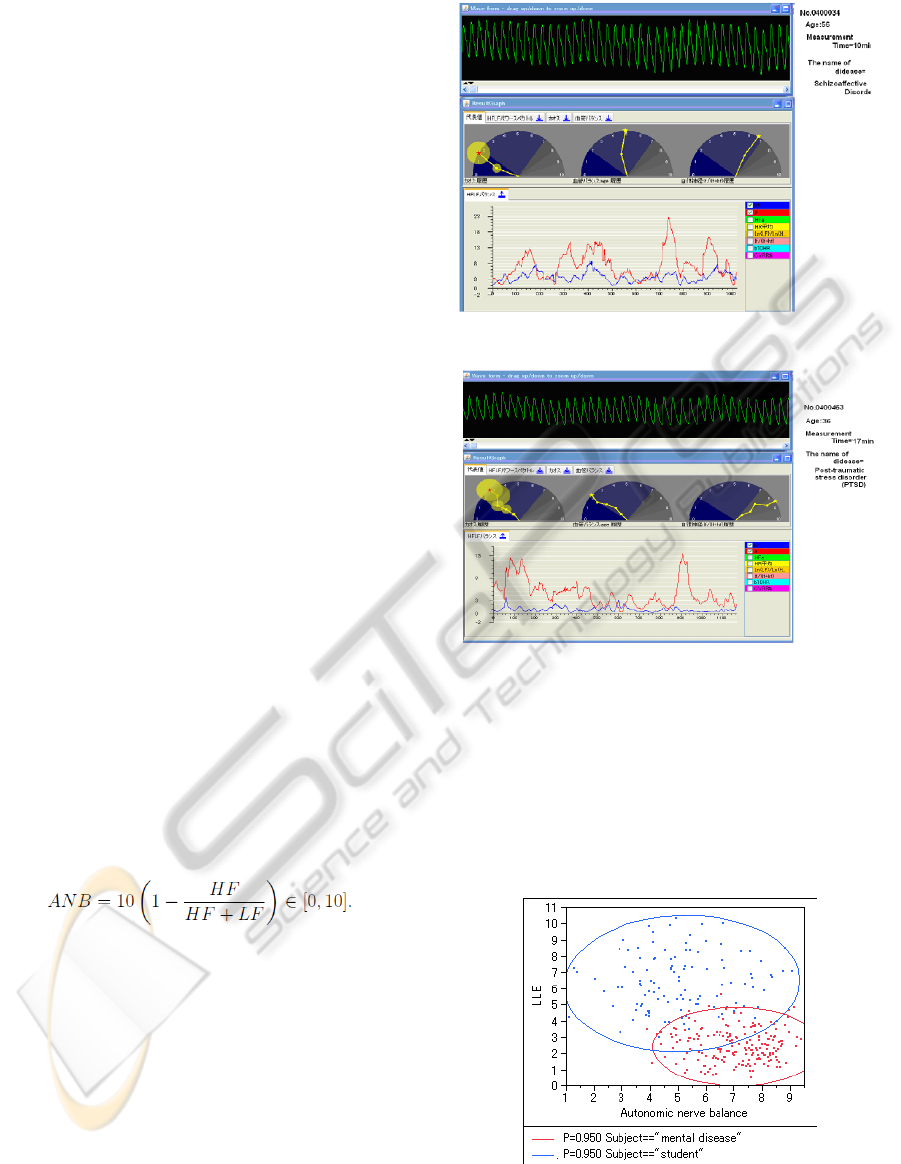
The top panel shows the pulse wave. In the
middle panel, three semicircles display, from the left,
LLE, blood vessel balance, and ANB, respectively.
Each semicircular graph represents a normalized
scale of 0–10, and a value for each time is shown by
the angle of the line drawn in yellow. The line graph
in the bottom panel shows changes in values for the
low frequency of heartbeat period (LF, in red) and
high frequency (HF, in blue) with respect to time.
To put it concretely, HF is referred to in the scale
of 0.15-0.40 Hz, which reflects the parasympathetic
activity; LF is in the domain of 0.04-0.15 Hz, which
is influenced by both sympathetic and
parasympathetic nerves. ANB is defined as
normalized value:
(6)
ANB < 5 indicates parasympathetic predominance,
and ANB > 5 indicates sympathetic predominance.
The patients in Figures 2 and 3 are diagnosed
with schizoaffective disorder and post-traumatic
stress disorder, respectively. In both graphs, LLE is
low, and ANB is greater than 5.
Notice that the values shown in Figures 2 and 3
are averages obtained through several measurements.
That is, results of several measurement times are
shown in the figures. Through several times of
measurements for each patient, LLE and ANB tend
to be stable, so we are confident that the results of
the repeated measurements are reliable.
Figure 2: Results for patient A (Schizoaffective Disorder).
Figure 3: Results for patient B (Post-traumatic Stress
Disorder).
3.2 Identification of Characteristic
Patterns in Mentally Ill Patients
The values of LLE and ANB are found to reflect
data characteristic of the mentally ill patients. Figure
4 shows the relationship between LLE and ANB in
the patient and student groups.
Figure 4: The relationship between LLE and ANB [All the
data are shown. Mental ill patients’ group (red) and
healthy students’ group (blue) are shown with an
establishment oval of 95%].
Identifying Characteristic Physiological Patterns of Mentally Ill Patients using Nonlinear Analysis of Plethysmograms
71
3.3 Autonomic Nerve Balance Analysis
Figure 5 shows the results of a one-way ANOVA on
the ANB.
Figure 5: Comparison of the average ANB and LLE
between a mentally ill patient and a healthy individual.
3.4 Detection of Mental Illnesses using
Pulse Waves
Figure 6 shows the rules for distinguishing mentally
ill patients from mentally healthy individuals using
partition analysis.
Figure 6: The distinction rule for the mentally ill patients
and mentally healthy individuals using partition analysis.
Recall that the total sample size is 308, including
195 mentally ill patients and 113 mentally healthy
students. For partition analysis,
Rule 1. LLE ≥ 4.84: the number of mentally
healthy students is 87;
Rule 2. 3.73 ≤ LLE < 4.84: the numbers of
mentally healthy students and mentally ill patients
are 23 and 15 respectively;
Rule 3. LLE < 3.73 and ANB < 5.40: the
numbers of students and patients are 3 and 21
respectively;
Rule 4. LLE < 3.73 and ANB ≥ 5.40: the number
of patients is 158.
3.5 Discriminant Analysis
In this subsection, discriminant analysis is carried
out with the help of statistical software.
Table 2: Discriminant weights of the variables.
Function
LLE 0.911
ANB -0.436
Table 3: Discriminant loadings of the variables.
Function
LLE 0.900
ANB -0.414
Tables 2 and 3 show the discriminant weights
and discriminant loadings respectively, which reflect
the contribution of the two variables to the function.
Table 4: Unstandardized coefficients.
Function
LLE 0.696
ANB -0.306
Constant -0.734
Table 4 shows the unstandardized coefficients,
which enabled us to directly calculate the
unstandardized function:
(7)
Table 5: Unstandardized canonical discriminant functions.
V Function
0 -1.221
1 2.108
Table 5 shows the unstandardized canonical
discriminant functions evaluated at the group means,
where V is a two-valued notation, which equals 0 or
1, representing a mentally ill participant or a healthy
participant, respectively; the right side shows their
magnitudes. Thus, using the number of mentally ill
and healthy participants, the critical value can be
obtained:
EHST/ICGREEN 2012
72

(8)
We judged whether a participant suffered from
mental illnesses by comparing the values of f and y:
the participant was classified as mentally ill if f < y
and as mentally healthy if f > y.
Table 6: Classification results.
V
Predicted
group
membership
Total
0 1
Original Count 0 190 5 195
1 10 103 113
Percentage 0 97.4 2.6 100.0
1 8.8 91.2 100.0
Cross-
validated
Count 0 189 6 195
1 10 103 113
Percentage 0 96.9 3.1 100.0
1 8.8 91.2 100.0
Table 6 presents the classification results for the
participants. We were able to correctly classify
97.4% of the mentally ill patients and 91.2% of the
mentally healthy students in our sample.
4 CONCLUSIONS AND REMARK
To conclude, this study has identified characteristic
physiological patterns of mentally ill patients using
pulse waves measurement. From the results of the
analysis, we obtained a significant difference
between these groups in LLE and ANB.
Notably, this system can display the activity of
sympathetic nerves, parasympathetic nerves, and
LLE at the same time, which enables us to assess the
mental status of patients when measuring their
fingertip pulse waves. Furthermore, the
methodology is simple and the operation is
economical. It can be used for early detection of
mental illnesses.
We hope that this system can contribute to
promoting better medical care. We will strive to
collect and analyze more data of mentally illness
sufferers, and intend to continue relevant studies in
the future.
ACKNOWLEDGEMENTS
We are deeply thankful to Dr. Oshima, president and
psychological counsellor at the Insight Counselling
Corporation (Tokyo, Japan) who helped provide the
pulse waves measurements of the mentally ill
patients and diagnoses of their mental illnesses. We
thank Dr. Shomura who provided the English names
of the mental illnesses.
REFERENCES
Abarbanel, H. D. I., Brown, R., Sidorowich, J. J.,
Tsimring, L. S. (1993). The Analysis of Observed
Chaotic Data in Physical Systems. Rev. Mod. Phys.,
65, 1331-1992.
Imanishi, A. and Oyama-Higa, M. (2006). The Relation
Between Observers’ Psychophysiological Conditions
and Human Errors During Monitoring Task. 2006
IEEE Conference on Systems, Man, and Cybernetics,
2035–2039.
Ministry and Health, Labour and Welfare (Japan). (n.d.).
The patient investigation. Retrieved March 26, 2012,
from http://www.mhlw.go.jp/toukei/list/10-20.html
Oyama-Higa, M. and Miao, T. (2006). Discovery and
Application of New Index for Cognitive Psychology.
2006 IEEE Conference on Systems, Man, and
Cybernetics, 2040–2044.
Oyama-Higa, M., Miao, T. and Mizuno-Matsumoto, Y.
(2006). Analysis of Dementia in Aged Subjects
Through Chaos Analysis of Fingertip Pulse Waves.
2006 IEEE Conference on Systems, Man, and
Cybernetics, 2863–2867.
Sano, M. and Sawada, Y. (1985). Measurement of the
Lyapunov Spectrum From a Chaotic Time Series.
Phys. Rev. Lett., 55, 1082-1085.
Sumida, T., Arimitu, Y., Tahara, T. and Iwanaga, H.
(2000). Mental Conditions Reflected by the Chaos of
Pulsation in Capillary Vessels. Int. J. Bifurcation and
Chaos, 10, 2245–2255.
Tsuda, I., Tahara, T. and Iwanaga, I. (1992). Chaotic
Pulsation in Capillary Vessels and Its Dependence on
Mental and Physical Conditions. Int. J. Bifurcation
and Chaos, 2, 313–324.
Identifying Characteristic Physiological Patterns of Mentally Ill Patients using Nonlinear Analysis of Plethysmograms
73
