
Adaptive Smoothing Applied to fMRI Data
M. Bartés-Serrallonga
1
, J. M. Serra-Grabulosa
2,3
, A. Adan
2,4
, C. Falcón
3,5
,
N. Bargalló
6
and J. Sole´- Casals
1
1
Digital Technologies Group, University of Vic, Vic, Spain
2
Departament de Psiquiatria i Psicobiologia Clínica, Universitat de Barcelona, Barcelona, Spain
3
Institut d’ Investigacions Biomèdiques August Pi i Sunyer (IDIBAPS), Barcelona, Spain
4
Institute for Brain, Cognition and Behaviour (IR3C), Barcelona, Spain
5
CIBER-BBN, Barcelona, Spain
6
Secció de Neuroradiologia, Servei de Radiologia, Centre de Diagnòstic per la Imatge (CDI),
Hospital Clínic de Barcelona, Barcelona, Spain
Keywords: Adaptive Smoothing, fMRI, Wiener Filter, Smoothing, Gaussian Kernel, Noise.
Abstract: One problem of fMRI images is that they include some noise coming from many other sources like the heart
beat, breathing and head motion artifacts. All these sources degrade the data and can cause wrong results in
the statistical analysis. In order to reduce as much as possible the amount of noise and to improve signal
detection, the fMRI data is spatially smoothed prior to the analysis. The most common and standardized
method to do this task is by using a Gaussian filter. The principal problem of this method is that some
regions may be under-smoothed, while others may be over-smoothed. This is caused by the fact that the
extent of smoothing is chosen independently of the data and is assumed to be equal across the image. To
avoid these problems, we suggest in our work to use an adaptive Wiener filter which smooths the images
adaptively, performing a little smoothing where variance is large and more smoothing where the variance is
small. In general, the results that we obtained with the adaptive filter are better than those obtained with the
Gaussian kernel. In this paper we compare the effects of the smoothing with a Gaussian kernel and with an
adaptive Wiener filter, in order to demonstrate the benefits of the proposed approach.
1 INTRODUCTION
Functional Magnetic Resonance Imaging (fMRI) is a
method to map the brain which does not require any
invasive analysis. This is a very useful technique to
identify brain regions of interest activated by
different types of stimulation or activity and also
during resting state. The indicator used to identify
the local activity is the Blood Oxygenation Level
Dependent (BOLD) contrast, which is based on the
brain oxygenation of the neuronal processes
associated with the experimental tasks. Oxygen and
other nutrients is what neurons need to work. Thus,
when brain neurons are activated, there is a change
in blood flow and oxygenation that causes a change
in the Magnetic Resonance (MR) signal received by
the receiver coils. A major level of oxygen in blood
in a particular area means that there is an increase in
neural activity in this zone and a lower level means
the opposite (D’Esposito et al., 1999).
To obtain the BOLD contrast, the subject under
study lies in the magnet under the influence of a
powerful magnetic field and perform a task or is
exposed to an external stimulus. At the same time, a
large amount of images are acquired using ultra-fast
sequences through magnetic resonance. For some of
these scans the stimulus is present and for some
others the stimulus is absent. The low resolution
brain images of the two cases can then be compared
in order to see which parts of the brain were
activated by the stimulus.
After the experiment has finished, the set of
images is pre-processed and analyzed.
One problem of fMRI data is that includes
contributions from many other sources including the
heart beat, breathing and head motion artifacts,
which can cause wrong results (S.A Huettel. et al.,
2004). In order to reduce as much as possible the
amount of noise and to improve signal detection, the
fMRI data is spatially smoothed prior to the analysis.
677
Bartés-Serrallonga M., M. Serra-Grabulosa J., Adan A., Falcón C., Bargalló N. and Solé-Casals J..
Adaptive Smoothing Applied to fMRI Data.
DOI: 10.5220/0004182306770683
In Proceedings of the 4th International Joint Conference on Computational Intelligence (SSCN-2012), pages 677-683
ISBN: 978-989-8565-33-4
Copyright
c
2012 SCITEPRESS (Science and Technology Publications, Lda.)

The most common and standardized method to do
this task is by using a Gaussian kernel. The principal
problem of this method is that some regions may be
under-smoothed favoring the presence of false
positives, while others are over-smoothed causing a
loss of information. This problem is due to the fact
that the extent of smoothing is chosen independently
of the data and is assumed to be equal across the
image.
Several studies have proposed approaches which
are different from the Gaussian proposal based on
the same theoretical principles, the extent of
smoothing is choosen independently of the data, fact
that can carry on the problems discussed. Some of
these methods are the prolate spheroidal wave
functions (Lindquist and Wager, 2008), wavelets
(Van DeVille, Blu, and Unser, 2006), Gaussians of
varying width (Poline and Mazoyer,1994; Worsley
et al., 1996) and rotations (Shafie et al.,2003). To
solve these problems and limitations, some authors
have proposes to use adaptive smoothing methods as
the use of the Gaussian Markov random field
specifies (Yue et al., 2010) and Propagation-
separation procedures (Tabelow et al.,2006).
In this report we present an alternative procedure
to denoise the fMRI images that differs from the
ones used in the traditional fMRI analysis. This
method is based on an adaptive Wiener filter which
smooths the images adaptively minimizing the loss
of information caused by the over-smoothing and the
apparition of the false positives when the images are
under-smoothed. In this paper, we compare the
effects of the adaptative smoothing based on the
Wiener filter and the effects of the non adaptative
smoothing of the use of the Gaussian kernel,
combinend in both cases with an Independent
component analysis.
2 MATERIALS AND METHODS
The study was performed in a 3 T MRI scanner
(Magnetom Trio Tim, Siemens Medical Systems,
Germany) at the Diagnostic Imaging Centre at
Hospital Clínic of Barcelona (CDIC) using the
blood-oxygen level-dependent (BOLD) fMRI signal.
Whereas the pre-processing of MR images and
the regression model were performed using SPM8
software (SPM8, Wellcome Department of
Cognitive Neurology, London), the data analysis
was carried out using Group ICA of fMRI Toolbox
(Calhoun et al., 2001). Both pre-processing and
analysis software were run on a Matlab platform
(R2009b version).
2.1 Participants
Forty right-handed healthy undergraduate students
[50% women; age range 18–25, mean (+S.D.) 19.6
(+1.7)] were recruited from the University of
Barcelona. Subjects with chronic disorders, nervous
system disorders or history of mental illness were
excluded, as well as regular drinkers and those on
medication. All participants were non smokers and
low caffeine consumers (< 100mg/day), had
intermediate circadian typology and reported an
undisturbed sleep period of at least 6 h during the
night prior to the fMRI scan sessions.
Caffeine may affect the performance of the task
(Serra-Grabulosa et al., 2010a); Adan and Serra-
Grabulosa, 2010). For this reason the participants
abstained from caffeine intake for a minimum of 12
h and fasted for at least 8 h prior to the first fMRI
session.
The study was approved by the ethics committee
of Hospital Clínic de Barcelona. Written consent
was obtained from all participants, who were
financially rewarded for taking part.
2.2 Experimental Design
The functional magnetic resonance imaging was
obtained using gradient echo sequence single-shot
echo-planar imaging, with the following parameters:
TR (repetition time): 2000 ms, TE (echo time): 40
ms, FOV (field of view): 24 x 24 cm, matrix 128 x
128 pixels, flip angle 90, slice thickness: 2 mm, gap
between sections: 0.6 mm, 36 axial slices per scan.
A total of 243 volumes were purchased, with 46
slices each.
During the acquisition of fMRI, in order to
obtain the BOLD contrast, the subjects performed a
sustained attention and working memory task (CPT-
IP, Continuous Performance Test-Identical Pairs),
which is a modification of the Cornblatt task
(Cornblatt et al., 1989) and a control task. CPT-IP
task was created with the software Presentation
(Neurobehavioral System, USA). All stimuli were
presented to the subjects through glasses specially
designed for use in the scanner.
The CPT-IP task was performed using a block
design. It started with a block of 35 seconds of
accommodation to the scanner, which had a blank
screen that the subject had to stare at. After this first
block, 9 blocks of CPT were alternated with 9
blocks of control (Figure 1). Preceding each block,
subjects received instructions for what to do in the
next block for a duration time of 5 seconds.
IJCCI2012-InternationalJointConferenceonComputationalIntelligence
678
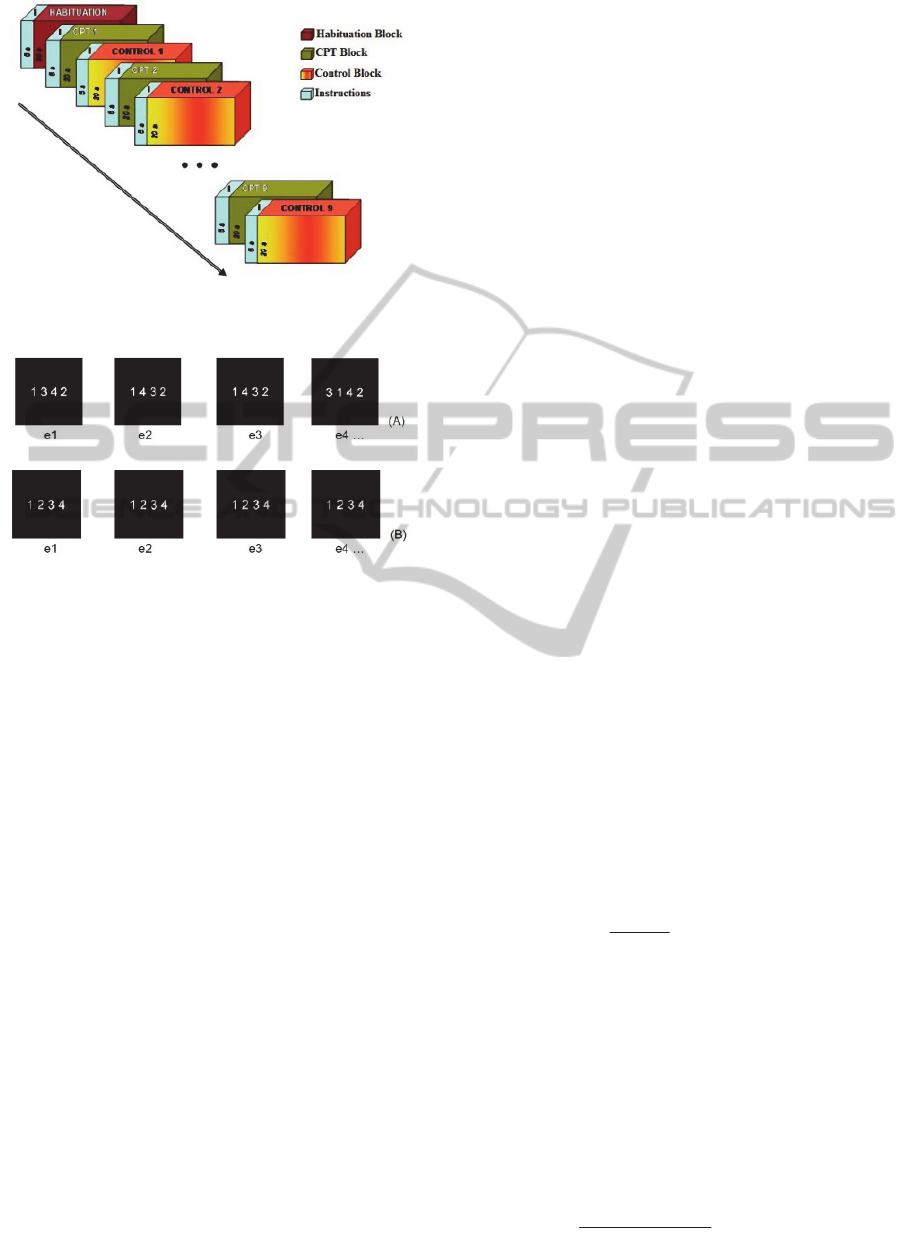
Figure 1: Design of the sustained attention task with
alternation between blocks.
Figure 2: The following figure illustrates the design of the
task blocks. The top (A) exemplifies the figures presented
in the CPT blocks. In this example, you should respond
to the stimulus e3. The bottom (B) exemplifies the figures
presented in the control blocks.
Each of the CPT blocks had a total of 27
numbers formed by 4 digits (1 to 9, without
repeating the same figure), so that 23 of the figures
were different and 4 were repeated. The presentation
time of each number was 450 ms and the interval
between the onsets of each of the 27 consecutive
digits was 750 ms. Subjects’ task was to detect the
repeated figures and respond by pressing a button as
quickly as possible (Figure 2A). The position of the
repeated figures was randomized over the blocks
CPT. Concerning the control block, it always had
the same 4 digits (1 2 3 4) and the task of the
subjects was only to stare at it throughout the
presentation (Figure 2B).
2.3 Data Pre-processing
Image pre-processing was performed with SPM8
(http://www.fil.ion.ucl.ac.uk/spm/software/spm8/) as
described in (http://www.fil.ion.ucl.ac.uk/spm/doc/
spm8_manual.pdf). The pre-processing steps were
(1) realigning and unwarping the images to correct
for movement artifacts and related susceptibility
artifacts, (2) coregistration of the anatomical to the
functional images, (3) segmentation and normalizing
of the anatomical image to the standard stereotactic
space (Montreal Neurological Institute), (4)
application of normalization transformation to the
functional images, and (5) smoothing the images
with a 8 mm full-width half maximum (FWHM)
Gaussian filter and with an adaptive Wiener filter in
order to have two groups of the same images with
different types of smoothing to compare them later.
2.4 Adaptive Wiener filtering
This filter is a (non-linear) spatial filter which
operates on the principle of least squares. Imagine
that we have a noisy image M’ of some original
image M and a restored version R. Obviously, what
we intend is to have R as close as possible to the
original image M. One way to know if the image R
is close as the image M is by adding the squares of
all differences:
∑(m
i,j
– r
i,j
)
2
(1)
where the sum is taken over all pixels of R and M
(which we assume to be of the same size). This sum
can be taken as a measure of the closeness of R to
M. If this value is the minimum the resultant image
of the denoising process will be as close as possible
to the original image. The noisy image M’ can be
written as:
M’ = M +N (2)
where M is the original correct image and N is the
noise which we assume to be zero-mean normally-
distributed.
However, the mean may not be zero. Therefore
we suppose that the mean is m
f
and the variance in
the mask is σ
2
f.
We suppose also that the variance of
the noise over the entire image is known to be σ
2
g
.
Then the output value can be calculated as:
m
f
+ (g - m
f
)
(3)
where g is the current value of the pixel in the noisy
image. See Lim, 1990 for details. In practice, we
calculate m
f
by simply taking the mean of all grey
values under the mask, and σ
2
f
by calculating the
variance of all grey values under the mask. We may
not necessarily know the value σ
2
g
. So the Matlab
function wiener2 (used to filter the images) which
implements Wiener filtering uses a slight variant of
the above equation:
m
f
+ (g - m
f
)
(4)
σ
2
f
+ σ
2
g
σ
2
f
max {0,σ
2
f
–
n}
max {σ
2
f,
n}
AdaptiveSmoothingAppliedtofMRIData
679
where n is the computed noise variance, and is
calculated by taking the mean of all values of σ
2
f
over the entire image. This can be very efficiently
calculated in Matlab.
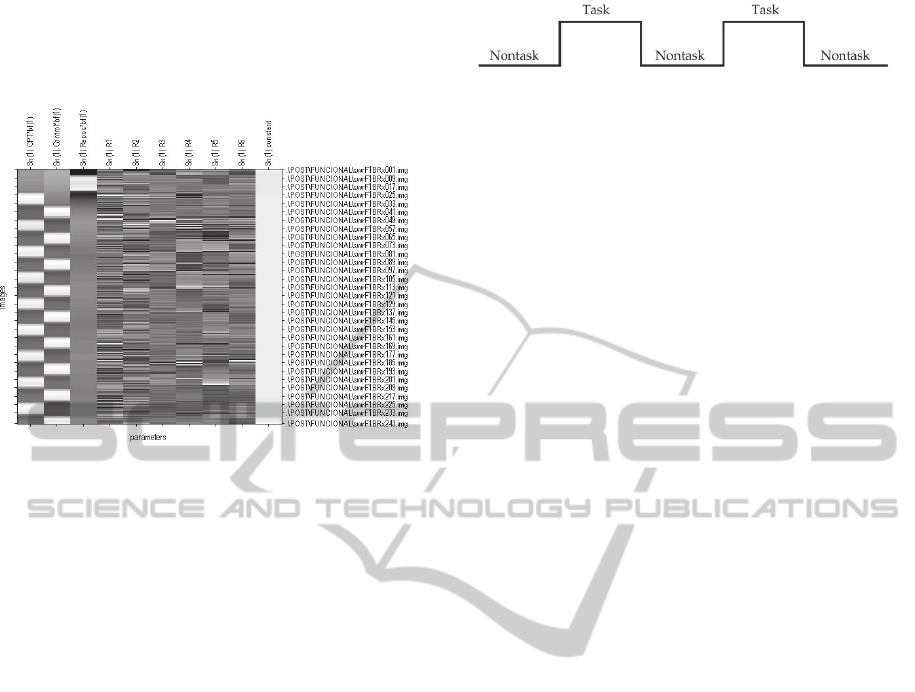
Figure 3: Regression model proposed to explain, for each
voxel of the functional MRI images, the variability in the
signal along the recorded 243 volumes. Each one of the 10
columns corresponds to one of the input variables in the
regression. The first one corresponds to the attention task
in which the subject has to respond to repeated stimuli.
The second one corresponds to the task of looking at
numbers and the third one to the task of initial rest. The
next 6 columns are the values applied to correct the head
movements in the pre-processing step. The last one
represents the error. On the right side of the table the
registered volumes are listed from 1 to 243. For each
variable, white colour indicates that this helps to explain
the variability while black colour indicates the opposite.
2.5 Implementation of the Regression
Model
After the pre-processing step, we proceeded to
perform the regression model to explain brain
activations. To do this, we created a regression line
where signal changes observed in each voxel could
be explained by changes in the proposed task
minimizing the residual error (Figure 3).
2.6 Independent Component Analysis
After pre-processing and regression model creation
steps, we applied ICA analysis in both types of the
smoothed images. What we intend with this analysis
is to check that the components obtained with the
Wiener filter have a time course more similar to the
task pattern than the time course obtained with the
Gaussian kernel (see Figure 4).
Figure 4: Task pattern followed during the CPT task.
To perform the ICA analysis we used the Group
ICA of fMRI Toolbox. This program has the option
to make the analysis using different algorithms, as
Jade, Erica, Infomax, Simbec, Amuse and others.
The chosen algorithm to analyze fMRI data was
Infomax because it has been one of the most
commonly used algorithms for fMRI data analysis
and has proven to be quite reliable (Calhoun et al.,
2004).
3 RESULTS
3.1 Selection of the Independent
Components
After ICA analysis we selected some of the
components in order to evaluate results. For that, we
did a multiple regression and a statistic correlation
with every paradigm. We excluded the components
that had a p-value greater than 0.01, and the ones
which were associated to noise. Therefore we
selected 3 components for the CPT task coming
from every approach.
3.2 Obtention of the Areas of Interest
After the selection of the independent components,
we performed a T – test with all the subjects and all
the components. We also performed a ‘multiple
regression’ SPM8 analysis to establish the
relationship between CPT-IP-related activations.
The fMRI results were interpreted only if they
attained both a voxelwise threshold p<0.05
(corrected) (cluster extent (k) = 10voxels). The
anatomical location of the activated brain areas was
determined by the Montreal Neurological Institute
(MNI) coordinates. Anatomical labels were given on
the basis of anatomical parcellation developed by
(Tzourio-Mazoyer et al., 2002).
3.3 Results with the Different
Smoothing Methods
In the following images taken from one sample, we
can see the results obtained with every smoothing
method. The first image (Figure 5) is an example of
IJCCI2012-InternationalJointConferenceonComputationalIntelligence
680
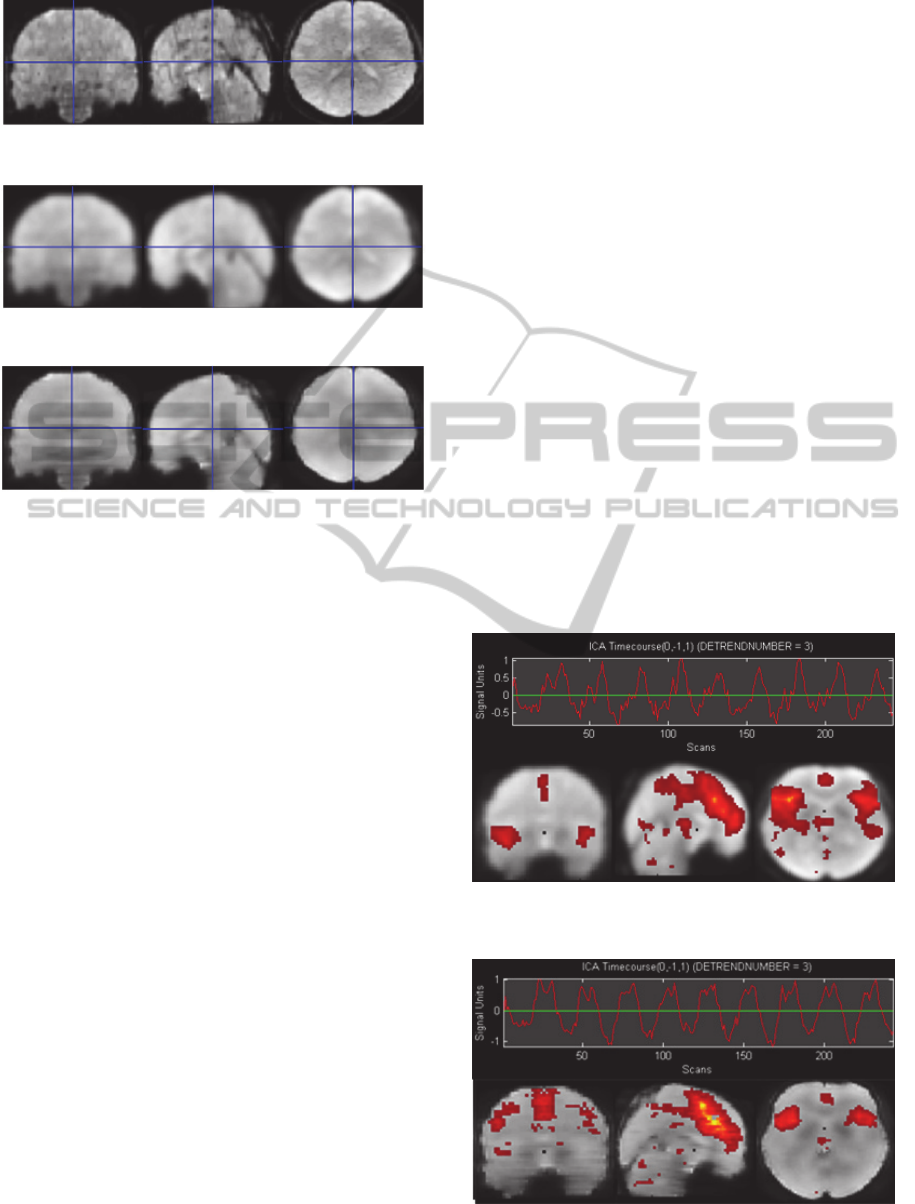
Figure 5: fMRI image without smoothing.
Figure 6: fMRI image smoothed with a Gaussian kernel.
Figure 7: fMRI image smoothed with an adaptive Wiener
filter.
a non smoothed image with noise. The next two
images (Figures 6 and 7) correspond to the same
image smoothed with the two mentioned methods.
As we have mentioned before, we applied an
ICA analysis on all the subjects in order to check the
components obtained with every method, as is
illustrated in the next images.
Activations found in the CPT task with the
Wiener filter were located bilaterally in frontal lobe
(BAs Left 4, 6, 8, 9, 10, 32, right 45, right 46, 47),
parietal (BAs 7, 39, 40), temporal (BAs Left 22, 37)
and occipital (BAs Left 17, 18, 19).
Activations found in the CPT task with the
Gaussian kernel were located bilaterally in frontal
lobe (BAs 4, 6, 8, 9, right 10, right 32, 45, 46, 47),
parietal (BAs right 2, Left 5, 7, 31, Left 39, 40, Left
41), temporal (BAs Left 20, 21, 22, Left 37) and
occipital (BAs Left 17, 18, 19).
4 DISCUSSION
This paper introduces an approach to smooth fMRI
data based on the use of an adaptive Wiener filter.
The results from the proposed method were
compared with those obtained through the
conventionally used Gaussian smoothing.
The principal feature of our approach respect to
the classic methods is that it allows varying the
extent of smoothing across the brain. This
characteristic will help to avoid the problems related
with over and under-smoothing that may occur if
smoothing is performed using a Gaussian kernel of
fixed width. In the following paragraphs we will
comment these problems with the achieved results.
If we take a look at the figures (Figures 5, 6 and
7), we can observe that in figure 6 the edges of the
images are fuzzy and have less resolution than the
images in the figure 7. This fact indicates that the
images in the figure 6 are over-smoothed causing
probably a loss of information. On the other hand,
the images of the figure 7 have more definition and
the edges have been preserved after the smoothing
process because the adaptive Wiener filter smooths
an image adaptively, tailoring itself to the local
image variance. Where the variance is large,
performs little smoothing. Where the variance is
small, performs more smoothing. As a result this
filter is more selective than the Gaussian kernel and
preserves better the edges and other high-frequency
parts of the image.
If we compare the time courses and the
activations maps between the components achieved
with the Gaussian kernel and the adaptive filter we
can see that all of them are very similar except the
ones presented in the figures 8 and 9.
Figure 8: Component from the CPT task obtained with the
Gaussian kernel.
Figure 9: Component from the CPT task obtained with the
adaptive Wiener filter.
AdaptiveSmoothingAppliedtofMRIData
681
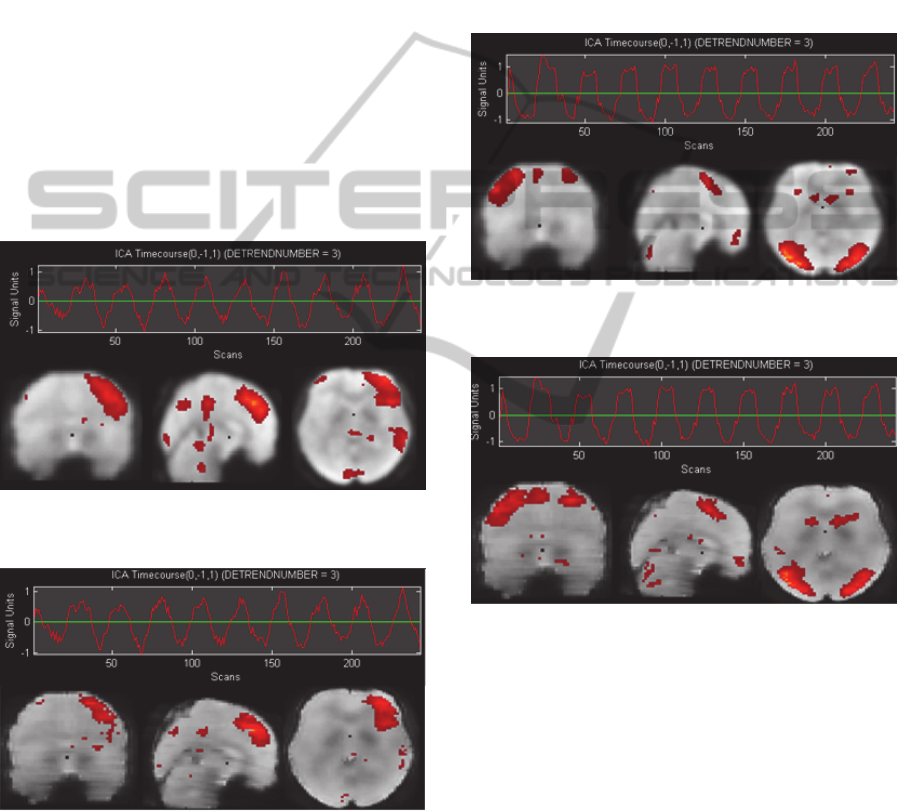
If we take a look to the activations found, we can
see that the adaptive filter found less active regions.
These correspond to the zones parietal (BAs 2, 5, 3,
41) and temporal (BAs 20, 21) which are basically
present in the figures 8 and 10.
Between all of these areas, the ones which
probably could be activated by the task are the BA 5
which is related with the working memory (Yoo et
Al., 2004) and BA 20 which is associated with the
dual working memory task processing (Yoo et Al.,
2004).
However, if we look previous studies (Bartés et
al. 2011) which studied the same task using ICA, we
can see that the BAs 5 and 20 were not found. By
this fact and because the figure 8 has more abrupt
changes in the time course than the figure 9 which
differs a little bit from the task pattern, we believe
that the components of the figures 8 and 10 have
some false positives which are removed by the
adaptive Wiener filter in the figures 9 and 11.
Figure 10: Component from the CPT task obtained with
the Gaussian kernel.
Figure 11: Component from the CPT task obtained with
the adaptive Wiener filter.
5 CONCLUSIONS
We have compared the effects of two different
denoising approaches: the use of Gaussian kernel
and the use of an adaptive Wiener filter. After the
analysis, the adaptive Wiener filter demonstrated to
be a technique with a great potential. Comparing
with the fixed Gaussian approache, is able to remove
the noise minimizing the over/under-smoothing. The
results provided evidences to state that the Gaussian
kernels alter the spatial shape and extent of the
activation regions, when applied for denoising fMRI
data. Therefore, we believe that the approach
proposed in this paper could be a good alternative to
the classic smoothing methods.
Figure 12: Component from the CPT task obtained with
the Gaussian kernel.
Figure 13: Component from the CPT task obtained with
the adaptive Wiener filter.
ACKNOWLEDGEMENTS
This work has been partially supported by the
Secretaria d’Universitats i Recerca of the
Departament d’Economia i Coneixement of the
Generalitat de Catalunya under the grant 2010BE1-
00772 to Dr. Jordi Solé-Casals; by the University of
Vic under de grant R0904; and by grants of the
Ministerio de Educación y Ciencia of the Spanish
Government (SEJ2005-08704) and the Departament
d’Innovació, Universitats i Empresa of the
Generalitat de Catalunya /2009BE-2 00239) to Dr.
Josep M Serra-Grabulosa.
IJCCI2012-InternationalJointConferenceonComputationalIntelligence
682

REFERENCES
Adan, A., Serra-Grabulosa, J.M., 2010. Effects of caffeine
and glucose, alone and combined, on cognitive
performance. Human Psychopharmacology clinical
and experimental, 25 (4), 310 – 317.
Bartés-Serrallonga, M., Solé-Casals, J., Adan, A., Falcon
C., Bargallo, N., and Serra-Grabulosa, J. M., 2011.
Statistical analysis of functional MRI data using
independent component analysis. International
conference on neural computation theory and
applications. 430 – 436.
Calhoun, V. D., Adali, T., Pearlson, G. D. and Pekar, J. J.,
2001. A Method for Making Group Inferences From
Functional MRI Data Using Independent Component
Analysis. Human Brain Mapping, 14, 140 – 151.
Calhoun, V. D., Adali, T., Pearlson,G. D., 2004.
Independent component analysis applied to fMRI data:
a generative model for validating results. The Journal
of VLSI Signal Processing, 37, 281 – 291.
Cornblatt, B.A., Lezenweger, M.F., Erlenmeyer-Kimling,
L., 1989. The Continuous Performance Test, Identical
Pairs Version: II. Contrasting attentional profiles in
schizophrenic and depressed patients. Psychiatry
Research, 29, 65 – 85.
D’Esposito, M., Zarahn, E., Aguirre, G. K., 1999. Event-
Related functional MRI: implications for cognitive
Psychology. Psychological Bulletin, 125, 155 – 64.
Lim, J. S., 1990. Two-Dimensional Signal and Image
Processing. Prentice Hall.
Lindquist, M. and Wager, T., 2008. Spatial smoothing in
fmri using prolate spheroidal wave functions. Human
Brain mapping, 29, 1276 – 1287.
Poline, J. and Mazoyer, B. 1994. Analysis of individual
brain activation maps using hierarchical description
and multiscale detection. IEEE Transactions in
Medical Imaging, 4, 702 – 710.
Serra-Grabulosa J. M, Adan A, Falcon C, Bargallo N,
2010a Glucose and caffeine effects on sustained
attention: an exploratory fMRI study. Human
Psychopharmacology clinical and experimental 25 (7-
8), 543 – 552
Shafie, K., Sigal, B., Siegmund, D., and Worsley, K.,
2003. Rotation space random fields with an
application to fmri data. Annals of Statistics, 31, 1732
– 1771.
Tabelow, K., Polzehl, J., Voss, H. U., Spokoiny, V., 2006.
Analyzing fMRI experiments with structural adaptive
smoothing procedures. NeuroImage, 33, 55 –62.
Tzourio-Mazoyer, N., Landeau, B., Papathanassiou, D.,
Crivello, F., Etard, O., Delcroix, N., Mazoyer, B. and
Joliot, M., 2002. Automated anatomical labeling of
activations in SPM using a macroscopic anatomical
parcellation of the MNI MRI single-subject brain.
Neuroimage 15, 273 – 289.
Van De Ville, D., Blu, T., and Unser, M., 2006. Surfing
the brain: An overview of wavelet-based techniques
for fmri data analysis. IEEE Engineering in Medicine
and Biology Magazine, 25, 65 – 78. .
Worsley, K. J., Marrett, S., Neelin, P., Vandal, A. C.,
Friston, K. J., and Evans, A. C., 1996. A unified
statistical approach for determining significant signals
in images of cerebral activation. Human Brain
Mapping, 4, 58 – 73.
Yoo, S. S., Paralkar, G., Panych, L. P., 2004. Neural
substrates associated with the concurrent performance
of dual working memory tasks. The international
journal of neuroscience. 114(6), 613 – 31.
Yue, Y., Loh, J.M., Lindquist, M.A., 2010. Adaptive
spatial smoothing of fMRI images. Statistics and Its
Interface, 3, 3 – 13.
AdaptiveSmoothingAppliedtofMRIData
683
