
EEG Signal Analysis via a Cleaning Procedure based on Multivariate
Empirical Mode Decomposition
Esteve Gallego-Jutglà
1
, Tomasz M. Rutkowski
2,3
, Andrzej Cichocki
2
and Jordi Solé-Casals
1
1
Digital Technologies Group, University of Vic, Sagrada Família 7,08500 Vic, Spain
2
LABSP, RIKEN Brain Science Institute, 2-1 Hirosawa, Saitama, 351-0106 Wako-Shi, Japan
3
Multimedia Lab,Computer Science Department & Tara Life Science Center, University of Tsukuba, Tsukuba, Japan
Keywords: EEG, Alzheimer Disease, Multivariate Empirical Mode Decomposition, Artifacts, Linear Discriminant
Analysis, Neural Networks.
Abstract: Artifacts are present in most of the electroencephalography (EEG) recordings, making it difficult to interpret
or analyze the data. In this paper a cleaning procedure based on a multivariate extension of empirical mode
decomposition is used to improve the quality of the data. This is achieved by applying the cleaning method
to raw EEG data. Then, a synchrony measure is applied on the raw and the clean data in order to compare
the improvement of the classification rate. Two classifiers are used, linear discriminant analysis and neural
networks. For both cases, the classification rate is improved about 20%.
1 INTRODUCTION
Electroencephalogram (EEG) signals recorded from
the scalp, commonly present different interference
signals due to muscle artifacts, such as eye blinks or
eye movement. Electric potentials due to these
artifacts can be orders of magnitude larger than the
EEG and can propagate across the scalp, masking
and distorting brain signals (Croft and Barry, 2000).
This paper focuses on improving the quality of
the data, removing artifacts from EEG data using a
new signal processing technique, Multivariate
Empirical Mode Decomposition (mEMD). This
technique is an extension of the Empirical Mode
Decomposition (EMD), and provides a
decomposition of the original EEG data into several
oscillatory modes computed along multichannel data
(Rehman and Mandic, 2010). Then the efficiency of
the proposed method of cleaning artifacts is
evaluated on real EEG data from an Alzheimer
Disease (AD) data base. The evaluation of this
cleaning procedure is calculated in terms of
classification rate. Obtained results with clean data
are much better that those obtained with raw data,
hence the detection of AD is simplified.
Recently it was shown that EMD is a good
method to separate eye movements from
neurophysiological signals as pointed out in
(Rutkowski et al., 2009a, Rutkowski et al., 2009b,
Molla et al., 2012), where results were obtained
comparing the extracted modes with the modes of
the EOG.
A previous study using mEMD (Gallego-Jutglà
et al., 2011) presented promising results using this
decomposition on simulated EEG data, where the
cleaned data presented always a correlation higher
than 0.8 with the simulated data without artifacts.
Another study had used mEMD for Seizure
detection in EEG signals (Rehman et al., 2010c). In
this study, Hilbert Huang transform and mEMD are
combined to extract spectral features form
multichannel EEG signals. The spectral feature used
is the mean frequency of the signals derived from
the Hilbert-Huang spectrum, and the method have
shown to be helpful for epileptic seizure detection.
At the end of this article, it is also suggested that
some artifacts can be removed by subtracting the
unwanted signals from the decomposition.
This paper is organized as follows. First,
methods used, including EMD and mEMD
description, the cleaning method, the synchrony
measure used and the classifiers used are presented
in Section 2. Section 3 describes the experimental
results obtained. Finally, discussion and conclusions
are depicted in Section 4 and Section 5 respectively.
670
Gallego-Jutglà E., Rutkowski T., Cichocki A. and Solé-Casals J..
EEG Signal Analysis via a Cleaning Procedure based on Multivariate Empirical Mode Decomposition.
DOI: 10.5220/0004182206700676
In Proceedings of the 4th International Joint Conference on Computational Intelligence (SSCN-2012), pages 670-676
ISBN: 978-989-8565-33-4
Copyright
c
2012 SCITEPRESS (Science and Technology Publications, Lda.)

2 METHODS
To eliminate EEG artifacts, the use of mEMD is
proposed. mEMD is a new technique to decompose
EEG data based on EMD. mEMD decomposition is
applied in an Alzheimer disease data base and then
data is cleaned using the cleaning procedure
presented in (Gallego-Jutglà et al., 2011). It is
important to note that now we deal with any kind of
artefacts and not only eyeblinks, therefore we
generalise the method to be more useful. In order to
evaluate the improvement of the cleaning procedure,
we don’t have a reference cleaned signals to
compare with, phase synchrony is computed and
then a classifier is set up in order to discriminate
between Alzheimer disease subjects and control
subjects. Two types of classifiers, Linear
Discriminant Analysis (LDA) and Neural Network
(NN), are explored in order to see the effect of the
cleaning method.
EEG dataset is composed of 15 healthy Ctrl
subjects and 15 patients with mild AD. The EEG
time series were recorded using 21 electrodes at a
sampling frequency of 128 Hz.
2.1 Empirical Mode Decomposition
EMD algorithm is a method designed for multiscale
decomposition and time –frequency analysis, which
can analyze nonlinear and non-stationary data
(Huang et al., 1998).
With this method, any time-series data set can be
decomposed into a finite and often small number of
oscilatory modes. These oscillatory modes are called
Intrinsic Mode Functions (IMFs). IMFs are defined
so as to exhibit locality in time and to represent a
single oscillatory mode. Each IMF satisfies two
basic conditions: (i) the number of zero-crossings
and the number of extrema must be the same or
differ at most by one in the whole dataset, and (ii) at
any point, the mean value of the envelope defined by
the local maxima and the envelope defined by the
local minima is zero (Huang et al., 1998).
The EMD algorithm (Huang et al., 1998) for the
signal x(t) can be summarized as follows.
(i) Determine the local maxima and minima of
x(t);
(ii) Generate an upper and a lower signal
envelope by connecting the local maxima and
minima computed previously respectively by an
interpolation method;
(iii) Compute the local mean
, by
averaging the upper and lower signal envelopes;
(iv) Subtract the local mean from the data:
ℎ
=
−
;
(v) If ℎ
obeys the stopping criterion, then
define
=ℎ
as an IMF, otherwise set
=ℎ
and repeat the process from step i.
Then, the empirical mode decomposition of a
signal x(t) can be written as:
x
t
=IMF
t
+ε
t
(1)
Where n is the number of extracted IMFs, and the
final residue ε
t
is the mean trend or a constant.
2.2 Multivariate Empirical Mode
Decomposition (mEMD) Applied to
EEG Signals
Multivariate Empirical Mode Decomposition, is an
extension for multivariate signals of EMD.
Even though EMD has achieved optimal results
in data processing (Diez et al. 2009, Molla et al.,
2010), several shortcomings are presented when this
technique is used in multichannel data sets such as
EEG. The IMFs from different time series do not
necessarily correspond to the same frequency, and
different time series may end up having a different
number of IMFs. These shortcomings complicate the
use of this technique to work with multichannels
data sets, because it is difficult to match the different
obtained IMFs from different channels (Mutlu and
Aviyente, 2011).
To solve the presented shortcomings of working
with multichannels data sets, several extensions of
EMD have been proposed. This extensions are
Bivariate Empirical Mode Decomposition (Molla et
al. 2010), to decompose two time series at the same
time, and Trivariate Empirical Mode Decomposition
(Rehman and Mandic, 2010a), to decompose three
time series at the same time. Recently, for
multichannel data sets, such as EEG, an extension of
EMD to mEMD was proposed (Rehman and
Mandic, 2010b).
In mEMD the local mean is computed by
tanking an average of upper and lower envelopes
obtained from all the sensors. The upper and lower
envelopes, in turn are obtained by interpolating
between the local maxima and minima. However, in
general, for multivariate signals, the local maxima
and minima may not be defined directly. To deal
with these problems multiple n-dimensional
envelopes are generated by taking signal projections
along different direction in n-dimensional spaces
EEGSignalAnalysisviaaCleaningProcedurebasedonMultivariateEmpiricalModeDecomposition
671

(Rehman and Mandic, 2010b). mEMD is the
technique used in this paper to compute all the
decompositions.
The algorithm (Rehman and Mandic, 2010b) can be
summarized as follows:
(i) Choose a suitable pointset for sampling on an
−1
sphere (this
−1
sphere resides in an
dimensional Euclidean coordinate system).
(ii) Calculate the projection, p
t
, of the
input signal v
t
along the direction vector, x
for all k giving p
t
.
(iii) Find the time instants t
corresponding to
the maxima of the set of projected
signalsp
t
.
(iv) Interpolate t
,vt
to obtain
multivariate envelope curvese
t
.
(v) For a set of K direction vectors, the mean of
the envelope curves is calculated as
t
=
1K
⁄∑
e
t
(vi) Extract the detail
using
=
−
. If the detail
fulfills the stopping criterion
for a multivariate IMF, apply the above procedure
to
−
, otherwise apply it to
.
Then, the mEMD of a signal x
can be written as
detailed in equation 1
The used stopping criterion is defined in (Rilling
et al., 2003).
2.3 Cleaning Pprocedure
The used cleaning procedure was previously
presented in (Gallego-Jutglà et al., 2011). In this
article the proposed procedure was applied to
simulated EEG data with eyeblink artefacts. Now,
the extension to any kind of artefacts and the
performance on real EEG data is evaluated.
The cleaning procedure is based on mEMD and
seeks the common modes which are present in all
the electrodes. Here the key idea is that if a mode is
present in all the electrodes, it is probably due to
artifacts and not to EEG signals, so this mode is
suppressed in the reconstruction process.
The cleaning procedure can be summarized as
follows:
(i) Apply mEMD to raw EEG data of N
electrodes, in order to obtain M oscillatory modes of
the multivariate data.
(ii) Construct a matrix containing the same mode
for all the channels. Therefore a total of M matrices
are obtained.
(iii) Calculate the Correlation Matrix (CM) of
each one of these previous matrices, obtaining
∈ ℝ
··
(iv) Compute the Communality Index ∈ ℝ
,
containing the mean correlation of each mode for all
the sensors. The CI is computed using the following
expression:
=
1
|
|
(2)
(v) Normalize CI between 0 and 1.
(vi) Threshold CI in order to find which of these
modes are common within all the channels. Modes
with high correlation
|
r
|
>0.8
are eliminated
(vii) Reconstruct clean signals without taking
into account the eliminated modes
The proposed cleaning procedure was applied
independently to all the subjects contained in the
data base.
2.4 Measure
In order to evaluate the efficiency of the proposed
cleaning method, each one of the subjects was
characterized with a measure.
Different studies have shown that Alzheimer
disease cause a change in EEG synchrony, so to
characterize the presents subjects in the data base,
the phase synchrony measure was used.
Phase synchrony measure the phase dependence
between two time series x and y, computing the
dependence between their instantaneous phases
and
. Even though the amplitudes of x and y are
independent, their instantaneous phases may be
synchronized. The instantaneous phase
of a time
serie x may be extracted as:
=arg
+
(3)
where
is the Hilbert transform of x. The phase
synchrony index
for two instantaneous phases
and
is defined as:
=
∈
0,1
(4)
where
n
and
m
are integers (usually
mn 1
).
The phase synchrony value that characterized
each subject was computed as presented in (Dauwels
et al., 2009). For each subject, the synchrony
between all the possible pairs of electrodes was
computed. Then, 5 regions of the head were defined
(frontal, right temporal, left temporal, central and
occipital areas). To evaluate local synchrony, the
average of the synchrony values obtained between
the electrodes of each region was computed. Then,
IJCCI2012-InternationalJointConferenceonComputationalIntelligence
672

to compute the global synchrony, an average of the
computed local synchrony was done.
Phase synchrony was computed in different
frequency bands, according to the classical used
division on (2 to 4 Hz.), (4 to 8 Hz.),
1
(8 to 10
Hz.),
2
(10 to 12 Hz.) and (12 to 25 Hz.) bands.
Signals were band-pass filtered between the selected
frequencies ranges. 3rth order Butterworth filters
were used, as they can be implemented easily and
offer good transition band characteristics at low
coefficient orders.
2.5 Classification
Two different types of classifiers were used to
classify the synchrony measures obtained with the
raw and the clean EEG data. Synchrony measures
obtained in the 5 frequency bands were used as input
features of the classifier.
2.5.1 Linear Discriminant Analysis (LDA)
Linear Discriminant Analysis (LDA) is a well-
known scheme for feature extraction and dimension
reduction. It has been used widely in many
applications involving high-dimensional data, such
as face recognition and image retrieval. Classical
LDA projects the data onto a lower-dimensional
vector space such that the ratio of the between-class
distances to the within-class distance is maximized,
thus achieving maximum discrimination. The
optimal projection (transformation) can be readily
computed by applying the eigendecomposition on
the scatter matrices. See (Duda et al., 2000,
Fukunaga, 1990) for details on the algorithm.
LDA was used to classify the computed
synchrony measures obtained from the EEG data of
Alz and Ctr subjects. As the number of subjects in
the data base is small, Leave-One-Out (LOO)
procedure was used. In this LOO crossvalidation
scheme of N observations, N-1 are used for training
and the last is used for evaluation. This process is
repeated N times, leaving one different observation
for evaluation each time. The mean success
classification value in percentage (%) is obtained as
a final result.
2.5.2 Neural Network
In recent years several classification systems have
been implemented using different techniques, such
as Neural Networks.
The widely used Neural Networks techniques are
very well known in pattern recognition applications.
An artificial neural network (ANN) is a
mathematical model that tries to simulate the
structure and/or functional aspects of biological
neural networks. It consists of an interconnected
group of artificial neurons and processes information
using a connectionist approach to computation. In
most cases an ANN is an adaptive system that
changes its structure based on external or internal
information that flows through the network during
the learning phase.
Neural networks are non-linear statistical data
modelling tools. They can be used to model complex
relationships between inputs and outputs or to find
patterns in data.
One of the simplest ANN is the so called
perceptron that consist of a simple layer that
establishes its correspondence with a rule of
discrimination between classes based on the linear
discriminator. However, it is possible to define
discriminations for non-linearly separable classes
using multilayer perceptrons (MLP).
The Multilayer Perceptron (Multilayer
Perceptron, MLP), also known as Backpropagation
Net (BPN), is one of the best known and used
artificial neural network model as pattern classifiers
and functions approximators (Lippman, 1987),
(Freeman and Skapura, 1991). It belongs to the so-
called feedforward networks class, and its topology
is composed by different fully interconnected layers
of neurons, where the information always flows
from the input layer, whose only role is to send input
data to the rest of the network, toward the output
layer, crossing all the existing layers (called hidden
layers) between the input and output. Essentially the
inner layers are responsible for carrying out
information processing, extracting features of the
input data.
Although there are many variants, usually each
neuron in one layer has directed connections to the
neurons of the subsequent layer but there is no
connection or interaction between neurons on the
same layer (Bishop, 1995, Hush and Horne, 1993).
In this work we have used a multilayer
perceptron with one hidden layer of 30 (empirically
obtained value) different neurons (nodes). Each
neuron is associated with weights and biases. These
weights and biases are set to each connections of the
network and are obtained from training in order to
make their values suitable for the classification task
between the different classes.
The number of input neurons is equal to the
number of frequency bands considered, and the
number of output neurons is just one as we needs to
EEGSignalAnalysisviaaCleaningProcedurebasedonMultivariateEmpiricalModeDecomposition
673
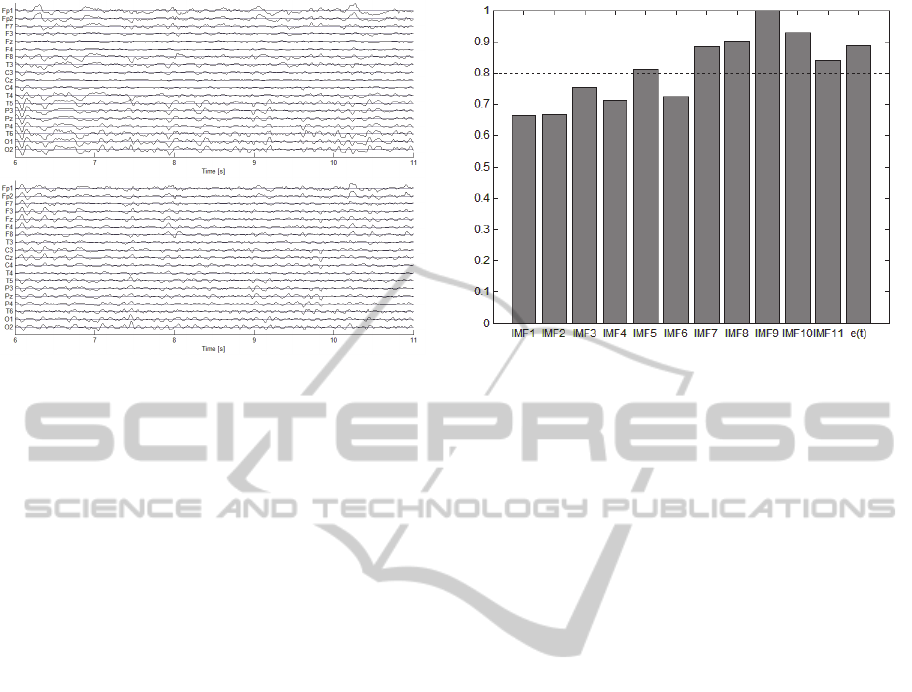
Figure 1: Comparison of the cleaning procedure. The top
image presents a 5-sec portion of raw EEG time series for
an Alzheimer subject. The bottom image presents the
same 5-sec of data after applying the cleaning procedure.
discriminate between only two classes (binary
problem).
For the neural network classifier, again the LOO
crossvalidation was used. To compute the
classification rate the LOO was computed 3 times,
the final classification was the mean of these 3
different values.
3 RESULTS
The proposed cleaning method was applied to all the
subjects contained in the data base. Then the phase
synchrony was computed for raw and clean data and
the classification of each type of data was computed.
The improvement of the quality of the data after
applying the cleaning procedure can be seen in
Figure 1, where some of the visible artifacts are not
present in the image of the clean data (bottom
image). The eliminated IMFs during the cleaning
process for this subject are presented in Figure 2,
where 11 IMFs were obtained. The used threshold
|
r
|
>0.8
is presented with a dotted line.
As can be seen in Figure 2, the presented CI has
several values higher than the threshold. The IMF
that hold the lower frequencies of the decomposition
(IMF7, IMF8, IMF9, IMF10, IMF11) and the
residue ε
t
, are the ones that are eliminated for
this subject during the reconstruction process. IMF 5
was also eliminated by the cleaning process. For all
the subjects the eliminated modes were those that
hold the low frequency oscillation.
Figure 2: Obtained Communality Index for an Alzheimer
diseases patient. 11 IMF where obtained during the
decomposition. Eliminated modes during the cleaning
procedure are the ones that present |r|>0.8. The threshold
|r|>0.8 is presented with a dotted line.
Obtained Classification Rates (CR) of synchrony
measures after classifying each type of data with the
two classifiers, LDA and NN, are presented in
Figure 3. With LDA, 56.67% of CR was obtained
with raw data and 76.67% was obtained with clean
data. On the other hand, the results obtained with
NN presented a CR of 58.89% for raw data and 80%
with clean data.
The presented results improve the classification
rate for both classifiers. For LDA an improvement of
20% was obtained and for NN an improvement of
21.11%.
4 DISCUSSION
The cleaning method presented an improvement of
the quality of the data. The classification results
obtained for both types of classifiers presented better
results for the clean data, than the classification rate
obtained with the raw data.
The eliminated modes presented in Figure 2 and
the modes eliminated from all the subjects,
correspond to low frequency oscillation. These
results are consistent with previous knowledge of
artifacts, in which the artifact interference is found
to be in the low frequencies.
These results point out that the criterion used to
select the modes to be discarded, based on the
Communality Index (CI), is reliable and can be used
for any kind of artifacts.
Also, results emphasizes that the use of mEMD
to correct artifacts may be a good procedure for EEG
IJCCI2012-InternationalJointConferenceonComputationalIntelligence
674
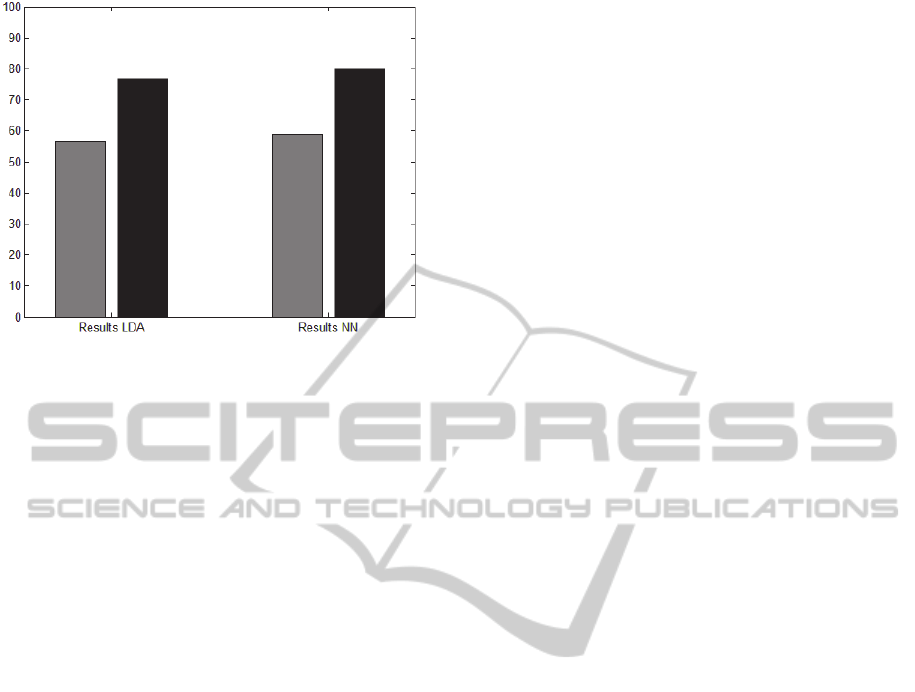
Figure 3: Classification Rates obtained after classifying
the synchrony values with LDA and NN. In both
classifiers, grey bars correspond to results obtained with
raw EEG data, black bars correspond to results obtained
with clean EEG data.
signal preprocessing, a necessary step to be taken
before any kind of EEG signal analysis.
5 CONCLUSIONS
In this paper a procedure for removing artifacts from
EEG data is tested in real data. This method is based
on an EEG decomposing technique, which allows
flexible signal decomposition of the original time
series in different oscillatory modes. The so-
obtained components from each EEG channel have
been analyzed and those that were present in all the
electrodes have been removed from the
reconstructed signal. Then phase synchrony has been
computed for all the subjects, and the obtained
values have been classified using two different
classifiers, linear discriminant analysis and neural
network.
Future work will include the comparison of this
method with ICA-based cleaning procedures (Solé-
Casals et al., 2010), or Wavelet-based cleaning
procedures (Krishnaveni et al., 2006, Vialatte et al.,
2008).
Of course, it is important to point out that the
data set at hand is fairly small. A larger sample size
and a more diverse data set will be used in order to
generalize the results of this study.
ACKNOWLEDGEMENTS
This work has been partially supported by the
Secretaria d’Universitats i Recerca of the
Departament d’Economia i Coneixement of the
Generalitat de Catalunya under the grant 2010BE1-
00772 to Dr. Jordi Solé-Casals; and under a
predoctoral grant from the University of Vic to Mr.
Esteve Gallego-Jutglà, ("Amb el suport de l'ajut
predoctoral de la Universitat de Vic").
REFERENCES
Croft, R. J., Barry, R. J., (2000). Removal of ocular
artefact form the EEG: a review. Neurophysiol
Clin,30, 5-19.
Bishop, C.M., (1995). Neural Networks for Pattern
Recognition. Oxford University Press.
Dauwels, J., Vialatte, F., Musha, T., Cichocki, A. (2010)
A comparative study of synchrony measures for the
early diagnosis of alzheimer’s disease based on EEG.
NeuroImage, 49, 668-693,
Diez, P. F., Mut, V., Laciar, E., Torres, A., Avilla, E.
(2009). Application of the Empirical Mode
Decomposition to the Extraction of Features form
EEG signals for Mental Task Classification. 31
st
Annual International Conference of the IEEE EMBS.
2579-2582.
Duda, R. O., Hart, P. E., Stork, D. (2000). Pattern
Classification. Wiley.
Freeman, J.A., Skapura, D.M. (1991). Neural Networks:
Algorithms, Applications and Programming
Techniques. Addison-Wesley Publishing Company,
Inc. Reading, MA
Fukunaga, K. (1990). Introduction to Statistical Pattern
Classification. Academic Press, San Diego, California,
USA.
Gallego-Jutglà, E., Solé-Casals, J., Rutkowski, T.,
Cichocki, A. (2011). Application of multivariate
empirical mode decomposition for cleaning eye blinks
artifacts from EEG signals. NCTA conference
proceedings, INSTICC 2011.
Huang, N. E., Shen, Z., Long,S. R., Wu, M. C., Shih, H.
H:, Zheng, Q., Yen, N.C., Tung, C. C., Liu, H. H.
(1998). The empirical mode decomposition and the
Hilbert spectrum for nonlinear and non-stationary time
series analysis. Proc. R. Soc. Lond., 495, 2317-2345.
Hush, D. R., Horne, B. G. (1993). Progress in supervised
neural networks. IEEE Signal Processing Magazine,10
(1), pp. 8-39.
Krishnaveni, V., Jayaraman, S., Aravind, S.,
Hariharasudhan, V., Ramadoss, K. (2006). Automatic
Identification and Removal of Ocular Artifacts from
EEG using Wavelet Transform. Measurement Science
Review, Vol. 6, Sec. 2, No. 4.
Lippmann, D. E. (1987). An Introduction to Computing
with Neural Networks. IEEE ASSP Magazine, 3(4),
pp. 4-22
Molla, K. I., Tanaka, T., Rutkowski, T. M., Cichocki, A.,
(2010). Separation of EOG artifacts from EEG singals
using bivariate EMD. Acoustics Speech and Signal
EEGSignalAnalysisviaaCleaningProcedurebasedonMultivariateEmpiricalModeDecomposition
675

Processing (ICASSP), 2010 IEEE Interational
Conference On. 562-565.
Molla, K. I., Islam, R.,Tanaka, T.,Rutkowski, T. M.
(2012). Artifact suppression from EEG signals using
data adaptive time domain filtering. Neurocomputing.
(Accepted manuscrit)
Mutlu, A. Y., Aviyente, S. (2011). Mutivariate Empirical
Mode Decomposition for Quantifying Multivariate
Phase Synchronization. EURASIP Jounal on Advances
in Signal Processing. Article ID 615717.
Rehman, N., Mandic, D. P. (2010a). Empirical Mode
Decomposition for Trivariate Signals. IEEE
Transactions on signal processing 58.3.
Rehman, N., Mandic, D. P., (2010b). Multivariate
empirical mode decomposition. Proc. R. Soc. A. 466,
1291-1302.
Rehman, N., Xia, Y., Mandic, D. P. (2010c). Application
of Multivariate Empirical Mode Decomposition for
Seizure detection in EEG signals. 32nd Annual
International Conference of the IEEE EMBS.
Rilling, G., Flandrin, P., Goncalves, P. (2003). On
Empirical Mode Decomposition and its Algorithms.
Proc of the IEEE-EURASIP, Workshop on Nonlinear
Signal and Image Processing, NSIP-03.
Rutkowski, T. M., Cichocki, A., Tanaka, T., Mandic, D.
P., Cao, J., Ralescu, A. L., (2009a). Multichannel
spectral pattern separation – An EEG processing
application. 2009 IEEE International Conference on
Acoustics, Speech and Signal Processing.
Rutkowski, T. M., Cichocki, A., Tanaka, T., Ralescu,
A.L., Mandic, D.P., (2009b). ICONIP’08 Proceedings
of the 15
th
international conference of Advances in
neuro-information processing. Vol Part I.
Solé-Casals, J., Vialatte, F. B., Pantel, J., Prvulovic, D.,
Haenschel, C., Cichocki, A.: ICA Cleaning Procedure
for EEG Signals Analysis - Application to Alzheimer's
Disease Detection. BIOSIGNALS 2010: 484-489
Vialatte, F. B., Solé-Casals, J., Cichocki, A. (2008). EEG
windowed statistical wavelet scoring for evaluation
and discrimination of muscular artifacts. Physiol.
Meas. 29 1435–1452.
IJCCI2012-InternationalJointConferenceonComputationalIntelligence
676
