
Interpretation of Time Dependent Facial Expressions
in Terms of Emotional Stimuli
Roman Gorbunov, Emilia Barakova and Matthias Rauterberg
Designed Intelligence Group, Department of Industrial Design, Eindhoven University of Technology,
Eindhoven, Netherlands
Keywords:
Genetic Programming, Hidden Model, Affective Computing, Facial Expressions, Emotions.
Abstract:
In this paper we demonstrate how genetic programming can be used to interpret time dependent facial ex-
pressions in terms of emotional stimuli of different types and intensities. In our analysis we have used video
records of facial expressions made during the Mars-500 experiment in which six participants have been iso-
lated for 520 days to simulate flight to Mars. The FaceReader, commercial software developed by VicarVision
and Noldus Information Technology, has been used to extract seven time dependent components of facial ex-
pressions from the video records. To interpret the obtained time dependent components of facial expressions
we have proposed a mathematical model of emotional stimuli assuming that dynamics of facial expressions
is determined by emotional stimuli of different types and intensities and facial expression at the moment of
the stimuli. Genetic programming has been used to find the locations, types and intensities of the emotional
stimuli as well as the way the facial expressions react on them.
1 INTRODUCTION
Tools for an automatic measurement of human emo-
tions open new research possibilities in fields as var-
ied as psychology, sociology, marketing, informa-
tion technology and e-learning. Recent progress
in the field of affective computing has also stimu-
lated measurement of emotions in commercial and
industrial sectors (Poels and Dewitte, 2006; Hill
and Mazis, 1986). The most popular and promis-
ing inputs for measuring emotions are: voice intona-
tion (Scherer, 2003), physiological signals (van den
Broek et al., 2009; Gouizi et al., 2011), body move-
ments (Barakova and Lourens, 2010; Lourens et al.,
2010) and facial expression recognitions (Terzis et al.,
2011). Most of the work in the field of the fa-
cial expression recognition is oriented on a search
of the methods for correct and accurate interpreta-
tion of the facial expression in terms of the emotions
(Terzis et al., 2011). In most of the cases software
for the facial expression recognition interprets facial
expression in terms of the six basic emotions: happy,
sad, angry, surprised, scared and disgusted. Interpret-
ing the emotions in context, however is a subject of
emerging interest (Marian and Shimamura, 2011).
We approach this topic by analyzing a temporal
history of emotions expressed during activity of col-
laborative game playing. From an output of the fa-
cial expressions recognition software, applied to a
video record, we get time dependent facial expres-
sions given in terms of the basic emotions. Since
emotional states experienced by a recorded subject
can be very dynamic, the corresponding output can
be quite complicated. In particular, the facial expres-
sions in a state of transition from one pure expression
to another one (let say from sad to happy) would be
of specific interest for the analysis. We aim to find a
method for interpreting the observed temporal history
of facial expressions in the context of the events that
caused the emotions. In this work we present a model
that can help to analyze and interpret output of fa-
cial expression recognition software. In particular we
develop a model of emotional stimuli which assumes
that time dynamics of facial expressions is determined
by the stimuli of different types and intensities as well
as by facial expressions at the moment of the stimuli.
To find the way in which the facial expressions are de-
termined by the stimuli we use genetic programming
(GP) approach (Banzhaf et al., 1998; Segaran, 2008).
Recently GP has produced many novel and outstand-
ing results in areas such as quantum computing, elec-
tronic design, game playing, sorting, and searching,
due to improvements in GP technology and the ex-
ponential growth in CPU power. The GP has been
231
Gorbunov R., Barakova E. and Rauterberg M..
Interpretation of Time Dependent Facial Expressions in Terms of Emotional Stimuli.
DOI: 10.5220/0004166302310237
In Proceedings of the 4th International Joint Conference on Computational Intelligence (ECTA-2012), pages 231-237
ISBN: 978-989-8565-33-4
Copyright
c
2012 SCITEPRESS (Science and Technology Publications, Lda.)

chosen among other optimization methods since it is
oriented on a search of functions that fulfill certain
criteria (and not on a search of a set of parameters).
As a consequence we do not need to predefine the
structure of the functional relation between the facial
expressions and emotional stimuli.
2 METHODS
2.1 Data Collection
The video records of facial expressions have been
collected during the Mars-500 isolation experiment
in which six participants have been isolated for 520
days to simulate flight for Mars. In more detail, ev-
ery second week the participants had to interact with
each other through a computer environment for ap-
proximately 30 minutes as a part of our experiment.
During these sessions the participants were seating in
front of the computers performing different learning
task and playing with each other the Colored Trails
game (Grosz et al., 2004). The frontal video records
of facial expressions have been made by the cameras
located on the computers of the participants.
2.2 Face Reader
To extract facial expressions from the available video
records we have used the FaceReader, commercial
software developed by VicarVision and Noldus Infor-
mation Technology (Uyl and van Kuilenburg, 2005).
The FaceReader can recognize facial expressions by
distinguishing six basic emotions (plus neutral) with
accuracy of 89 % (Uyl and van Kuilenburg, 2005). In
more detail, the FaceReade recognizes happy, sad, an-
gry, surprised, scared, disgusted and neutral compo-
nents of the facial expressions. The system is based
on Ekman and Friesen’s theory of the Facial Action
Coding System (FACS) that states that basic emotions
correspond with facial models (Ekman and Friesen,
1977). In our study we have used the FaceReader to
generate components of the facial expression for ev-
ery third frame of the video. It gives the time separa-
tions between the two neighboring data points (com-
ponents of the facial expression) equal to 120 mil-
liseconds.
2.3 Model of Emotional Stimuli
By emotional stimuli we understand everything that
influence emotions and, as a consequence, the facial
expressions of participants. In other words, every-
thing that makes participants happy, sad, scared etc.
is considered as an emotional stimulus. In this work
we propose a model that states that components of the
facial expressions
~
f
k+i
are given by the last emotional
stimulus
~
s
k
and the facial expression at the moment of
the stimulus
~
f
k
:
~
f
k+i
=
~
F
~
f
k
,
~
s
k
,i
. (1)
In other words we assume that after an emotional
stimulus the facial expression changes from the cur-
rent state to the state corresponding to the emotional
stimulus. Further on we will call the
~
F-function as a
response function because it determines the response
of the facial expressions on emotional stimuli. In the
above expression (1) the lower indexes are used to nu-
merate the time frames of the video. The k index gives
the position of the last emotional stimulus and the i is
the number of time step between the given facial ex-
pression and the moment when the last stimulus hap-
pened.
In general the emotional stimuli can be described
as a set of parameters. This is the reason why we
denote them as vectors:
~
s. In this work we con-
sider emotional stimuli as two-dimensional vectors in
which the first component indicated the type of a stim-
ulus (e.g. ”sad”, ”funny”, etc) and the second compo-
nent indicates its intensity (how ”sad” of ”funny” was
it?). In this model an emotional stimulus can be rep-
resented by its type t and intensity I. In this notation
the considered model can be written in the following
form:
f
c
k+i
= F
c
~
f
k
,t
k
,I
k
,i
= F
c
t
~
f
k
,I
k
,i
. (2)
In the above equation we have also switched from the
vector to index notation. The upper index c is used
to indicate different components of the facial expres-
sions.
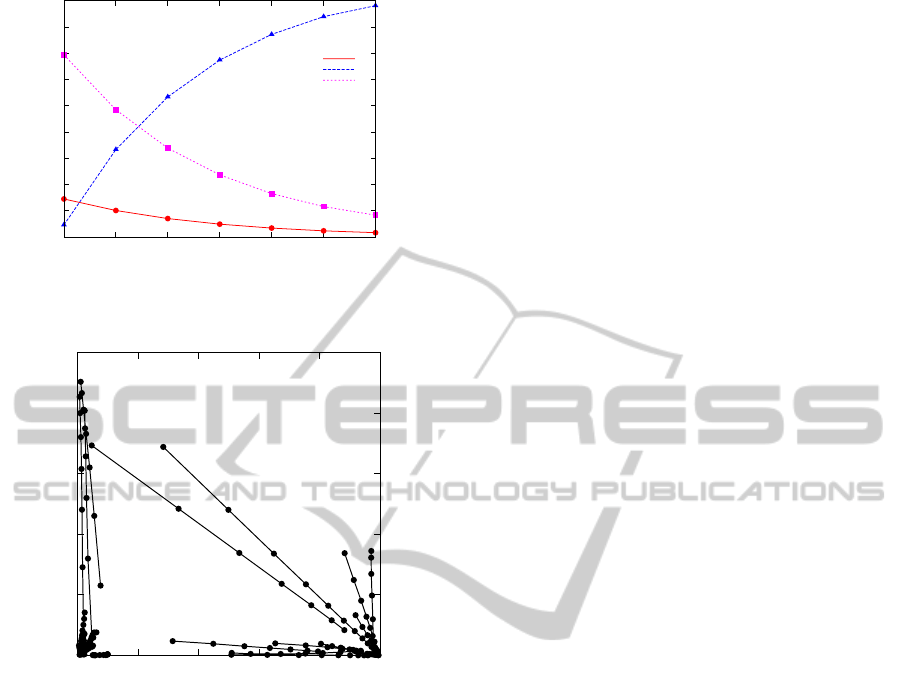
By a preliminary observation of the available data
we have found segments in which components of the
facial expressions are smooth function of time. An
example of such segment is given in figure 1. By a
further analysis of these patters we have found out that
changes of different components of facial expressions
are linearly proportional to each other within a good
approximation. From a geometrical point of view it
means that the considered segments lie on lines in the
7-dimensional space of the facial expressions. This
fact is shown in the figure 2. This property can also
be given by the following mathematical expression:
f
c
k+i
= f
c
k
+ µ(i)(s
c
k
− f
c
k
). (3)
The function µ(i) should be equal to zero if i = 0 and
be equal to one if i is larger enough. In this case the
facial expression starts to change from the expression
IJCCI2012-InternationalJointConferenceonComputationalIntelligence
232
0
0.1
0.2
0.3
0.4
0.5
0.6
0.7
0.8
0.9
19 20 21 22 23 24 25
Components of Facial Expressions
Frame Index
Neutral
Happy
Sad
Figure 1: An example of a segment in which components
of facial expressions are given as smooth functions of time.
0
0.2
0.4
0.6
0.8
1
0 0.2 0.4 0.6 0.8 1
Sad
Happy
Figure 2: Examples of the segments forming straight lines
in the space of the facial expressions.
at the moment of the stimulus ( f
c
k
) and moves along
a line to the final expression (s
c
k
) corresponding to the
given emotional stimulus.
Additionally to the above considered property in
the figure 2 we can see that linear parts of the depen-
dencies form a patter: all the lines are directed to spe-
cific locations in the space of the facial expressions.
For example, in the figure we can see two groups of
lines which point to ”happy” and ”sad” facial expres-
sions, respectively. Because of this property the math-
ematical expression for the dynamics of the compo-
nents of facial expression can be rewritten as:
f
c
k+i
= f
c
k
+ µ(i)(δ
tc
I
k
− f
c
k
), (4)
wehre δ
tc
is the Kronecker’s delta. The t can be con-
sidered as the type of the stimulus and I as its inten-
sity. By fitting the observed dependencies we found
out that µ(i) can be approximated well by an expo-
nential function µ (i) = exp(−α · i). The equation (4)
can be considered as a partial case of the above intro-
duced general model (1). The expression (4) can be
rewritten in the following form:
f
c
k+i
= δ
tc
{ f
c
k
[1 − µ(i)] + µ(i)I
k
} +
(1 − δ
tc
){ f
c
k
[1 − µ(i)]}. (5)
In the present study we use genetic programming
to find the shape of the response function. To reduce
the search space and, in this way, make the problem
solvable we should restrict the form of the response
function. In other words, we cannot search in a space
of functions given by general expressions (1) or (2).
On the other hand the structure of the response func-
tion should be able to capture not only the considered
linear segments, given by the expression (5), but also
more complex dependencies. As a compromise be-
tween these two extremes we will use the response
function of the following form:
f
c
k+i
= δ
tc
F
1
( f
c
k
,I
k
,i) + (1 − δ
tc
)F
2
( f
c
k
,I
k
,i). (6)
We would like to explicitly mention restrictions
used in the expression (6) as compared to the response
function in the general form (2). As we can see, the
response function in the form (2) is given by 49 func-
tions corresponding to different values of c and t. In
other words, by the expression (2) we specify how the
”happy” component of the facial expression changes
after a ”sad” stimulus, or how the ”angry” component
changes after a ”happy” stimulus and so on. In con-
trast, the expression (6) contains only two functions
(F
1
and F
2
). This restriction assumes that the way in
which the i-th component of the facial expression is
influenced by the i-th stimulus is independent on i. In
other word the ”happy” component of the facial ex-
pression is assumed to depend on a ”happy” stimulus
in the same way as the ”sad” component depends on
a ”sad” stimulus (assuming that the initial values of
the components of the facial expressions as well as
the intensities of the stimuli were the same in the two
mentioned cases). In the same way it is assumed that
i-th component of the facial expression depends on
j-th stimulus in the same way for all possible combi-
nations of i and j as soon as i is not equal to j. In other
word the ”happy” component of the facial expression
is assumed to depend on a ”sad” stimulus in the same
way as, let’s say, the ”angry” component depends on
a ”disgusted” stimulus. It more detail, we assume that
i-th component of the facial expressions decays after
j-th stimulus if i is not equal to j and the form of this
decay is the same for all possible combinations of i
and j.
2.4 Genetic Approach for Finding
Response Functions
To find the functions F
1
and F
2
which determine the
response of the facial expression on emotional stim-
InterpretationofTimeDependentFacialExpressionsinTermsofEmotionalStimuli
233

uli of different types and intensities, we have used ge-
netic programming.
In more detail, every function has been repre-
sented as a tree. For example, the exponential func-
tions corresponding two the expression 5 are shown
in the figures 3 and 4. As nodes of the tree we used
Figure 3: Tree representation of the initial exponential
guess for the first component (F
1
) of the response function.
Figure 4: Tree representation of the initial exponential
guess for the fsecond component (F
1
) of the response func-
tion.
either basic functions or real constants or arguments.
The set of the basic function consisted of 7 func-
tions: (1) addition, (2) subtraction and (3) multipli-
cation functions of two arguments, (4) ”if-function”,
(5) ”greater-than-function”, (6) power function and
(7) arctangents. The ”if-function” is a function of 3
arguments. It compares the first argument with zero,
and if it is larger than zero the function returns the
second argument. Otherwise the third argument is re-
turned. The ”greater-than-function” is a function of
two arguments. It returns 1 if the first argument is
larger than the second one. Otherwise the second ar-
gument is returned.
The functions F
1
and F
2
have three arguments.
They are indicated in the figures 3 and 4 as p0, p2 and
p3. The first argument (p0) is the value of those com-
ponent of the facial expression which corresponds to
the type of the emotional stimulus ( f
c
k
in the eqaution
(6)). The k index indicates that this value is taken at
the moment of the stimulus. For example, in case of
a ”happy” stimulus, p0 should be equal to the value
of the ”happy” component of the facial expression at
the moment when the stimulus was observed by the
participant. The second argument (p1) is the number
of frames between the current moment and the mo-
ment of the last emotional stimulus (i in the eqaution
(6)). The third argument (p2) is the intensity of the
stimulus (I
k
in the equation (6)).
To find a response function we have used a sim-
ple evolutionary process. The evolution started from
the earlier defined pair of the exponential functions
given by the equation (5) and shown in the figures 3
and 4. For the given pair of the trees we have calcu-
lated a score which indicated how well the given pair
of functions explains the observed dynamics of the
facial expressions (more details about the calculation
of the score will be given later). Then we created a
new pair of trees by mutation of every tree in the old
pair. To mutate a tree we randomly choose a node in
the tree and replace it by a random tree. A random
tree is generated in the following way. First we cre-
ate a root node. We randomly decide if it should be
a function or not. The probability for the node to be
a function was set to 0.5. If a node is decided to be a
function, then a function is randomly chosen from the
earlier given list of the basic functions. If the node
is decided to be not a function, than we decide if it
should be a parameter (argument) or a constant. The
probability for the node to be a parameter was set to
0.6. If a node is decided to be a parameter, one of
the parameters is randomly chosen (either p0, or p1
or p2). If a node is decided to be a constant, a random
number is generated and associated with the node. A
random number generator with the uniform distribu-
tion between 0 and 1 was used. After a root node
is created, we make a loop over its parameters (ar-
guments) and generate nodes associated with them.
The procedure is repeated recursively for every node
in the tree, whose child-nodes are not specified yet.
The procedure is stopped if there are no nodes that re-
quire child nodes (constants- and parameters-nodes).
The maximal depth of the tree was set to 4 to prevent
a generation of extremely large trees.
2.5 Training Set and Score Function
We have searched for the response function that could
model not all the data but only segments around the
patterns described earlier and shown in the figures 1
and 2. To find a generalization of the dependency
5 we have extended the linear segments by preced-
ing and subsequent steps of the data. The addition
of nonlinear segments requires a use of a more gen-
eral function. To find this function we have used GP
techniques. In more detail we have selected all the
parts of the trajectories in the space of the facial ex-
pression that lie on a line. In more detail, the points
were considered as lying on a line if the angle be-
tween the line connecting the first and second points
and line connecting the second and third points was
not larger than 3 degree. Three video records have
been considered. The number of segments with the
IJCCI2012-InternationalJointConferenceonComputationalIntelligence
234

above described properties in these records was 26,
52 and 21 respectively. The minimal and maximal
length of the segments was 6 and 12 steps, respec-
tively. The average length of the segments was equal
to 7.3 steps. To capture patterns happening imme-
diately before and after the considered segments we
have added to them 20 preceding and 31 subsequent
steps.
For every extended segment we have searched for
the best emotional stimulus that could explain the de-
pendencies observed in the segment. In more detail
we made a loop over all possible locations, types and
intensities of the stimulus. The loop over intensities
of the stimuli was run from 0.0 to 1.0 with the step
equal to 0.01. For every considered stimulus we have
used the available response function to predict the dy-
namic of the facial expressions. First we combine the
intensity and type of the stimulus with the facial ex-
pression at the moment of the stimulus to estimate the
facial expression on the next step. Then the difference
between the estimated and observed facial expression
has been calculated. In more detail, the estimated and
real (observed) facial expressions can be represented
as points in the 7-dimensional space of the facial ex-
pressions. As a measure of the difference between
the estimated and observed facial expression we have
used the distance between the two points, represent-
ing the two kinds of the facial expressions, divided by
the average length of the vectors connecting the origin
of the coordinate system and the two points:
d = 2
|~o −~p|
|~o +~p|
, (7)
where ~o and ~p are the observed and predicted facial
expressions. The predicted facial expression has been
considered as accepted if its deviation from the ob-
served expression has been smaller than 0.03 accord-
ing to the measure (7). After the prediction for the
given step was accepted, a prediction for the next step
was generated and evaluated in the same way. The
procedure was repeated until an unaccepted predic-
tion is reached. Then the total length of the prediction
was calculated. In this way we get a location, type and
intensity of the stimulus which maximize the length
of the prediction for the considered segment. This
procedure was performed for all the segments with
a given response function and the total length of the
predictions has been used as a measure of the quality
of the considered response function.
2.6 Optimization Procedure
We started the evolutionary process from the response
function given by the expression (5) and shown in the
figures 3 and 4. Then we generate new response func-
tions and evaluate their scores until a function with a
score larger than or equal to those of the initial func-
tion is found. The new response function replaces
then the initial function and whole procedure is re-
peated. The procedure is stopped if the score has no
improvement for a large enough number of genera-
tions.
After the evolutionary search is stopped we run a
hill climbing optimization algorithm to find new val-
ues for the constants involved into the trees to im-
prove the predictive power of the response function.
In more detail we make an iteration over all constants
in the pair of trees. For every constant we consider
the two neighboring values separated by 0.1 from its
original value. Then we choose the variable and the
direction of the shift over this variable which maxi-
mize the predictive power of the response function. If
no improvement is possible we decrease the current
step by 1.1.
We have run three independent optimization pro-
cedures for three different video records. After that
the response functions optimized on the three inde-
pendent sets of data have been tested on the data that
were not used during the optimization.
3 RESULTS
We have run the evolutionary optimization procedure
for 3 video records. These optimization procedures
have been manually stopped after 2165, 156 and 672
steps of the evolution, respectively, because the score
did not improved for several hundred steps. In all
three cases we got an improvement of the predictive
power of the response function if compared with the
initial exponential guess given by the equation (5). In
more detail, the average length of the accepted pre-
diction made with the initial exponential guess was
equal to 10.15, 10.98 and 10.48 steps for the 3 video
records, respectively. After the evolutionary opti-
mization the predictive power increased up to 12.50,
12.85 and 12.29 steps, respectively. The additional
hill climbing optimization of the response functions
found in the evolutionary optimization also led to an
increase of the predictive power of the response func-
tions in all three cases. However, the improvement
was very small. After the hill climbing optimization
the predictive power in the three cases increased to
12.65, 13.46 and 12.38 steps. The above found re-
sults are summarized in the table 1.
The examples of the found response functions are
shown in the figure 5 and 6.
To make sure that we do not have an overfitting
InterpretationofTimeDependentFacialExpressionsinTermsofEmotionalStimuli
235

Table 1: Average length of the predictions for different data
sets and response functions.
Video 1 Video 2 Video 3
Initial Guess 10.15 10.98 10.48
After Ev. Opt. 12.50 12.85 12.29
After H. C. Opt. 12.65 13.46 12.38
0
0.2
0.4
0.6
0.8
1
0 10 20 30 40 50
Segment with the Linear Pattern
Preceding and Subsequent Frames
Predictor after the Evolutionary Optimization
Predictor after the Additional Hill Climbing Optimization
Figure 5: An example of the first response function repre-
senting different components of the facial expressions.
0
0.2
0.4
0.6
0.8
1
0 10 20 30 40 50
Segment with the Linear Pattern
Preceding and Subsequent Frames
Predictor after the Evolutionary Optimization
Predictor after the Additional Hill Climbing Optimization
Figure 6: An example of the second response function rep-
resenting different components of the facial expressions.
effect, the response functions have been tested on the
data which were not used in the optimization pro-
cedures. The results of this test are summarized in
the table 2. As we can see in the table, the first re-
sponse function, which was obtained with the first
video record performs well for the second and third
video records. The average lengths of the prediction
for the second and third video records are even larger
than those for the first one. Moreover, the considered
response function has a higher predictive power for
the third video record than the third response func-
tion which was obtained with this record. So, we
can conclude that the first response function has not
been overfitted. The second response function per-
forms best for the second video record and has a low
predictive power for the other two records. However,
even for these two records the predictive power of the
considered response function is larger than those of
the exponential response function used as the initial
guess. The third response function, obtained with the
third video, performs also well with the second record
Table 2: Cross validation of the response functions.
Video 1 Video 2 Video 3
No Opt. 10.15 10.98 10.48
R.F.1 12.65 12.92 13.24
R.F.2 10.31 13.46 11.86
R.F.3 10.35 13.08 12.38
but not so well with the first one. As a general conclu-
sion we can say that response functions obtained just
with one video record are meaningful and could per-
form well for other records. However, a small effect
of the overfitting is present and for further optimiza-
tion of the response functions it is recommended to
use a larger set of data.
4 CONCLUSIONS
We have proposed a model of emotional stimuli that
can be used to interpret time dependent components
of facial expressions. In more detail, the time dynam-
ics of the facial expressions is considered as deter-
mined by emotional stimuli of different types and in-
tensities as well as by facial expression at the moment
of the stimuli. We have also developed a computa-
tional procedure that can help to identify the locations
of the emotional stimuli as well as their types and in-
tensities based on the observed sequence of the facial
expressions. This procedure is also used to determine
the way in which the dynamics of the facial expres-
sions is influenced by the emotional stimuli.
REFERENCES
Banzhaf, W., Nordin, P., Kelller, R. E., and Francone, F. D.
(1998). Genetic programming - An Introduction: On
the Automatic Evolution of Computer Programs and
Its Applications. Morgan Kaufmann.
Barakova, E. I. and Lourens, T. (2010). Expressing and in-
terpreting emotional movements in social games with
robots. Personal and Ubiquitous Computing, 14:457–
467.
Ekman, P. and Friesen, W. V. (1977). Manual for the Fa-
cial Action Coding System. Consulting Psychologists
Press, Palo Alto, CA.
Gouizi, K., Reguig, F. B., and Maaoui, C. (2011). Emo-
tion recognition from physiological signals. Journal
of Medical Engineering and Technology, 35:300–307.
Grosz, B. J., Kraus, S., Talman, S., Stossel, B., and Havlin,
M. (2004). The influence of social dependencies
on decision-making. initial investigations with a new
game. Proceedings of the 3rd international joint con-
ference on autonomous agents and multiagent sys-
tems, 2:782–789.
IJCCI2012-InternationalJointConferenceonComputationalIntelligence
236

Hill, R. P. and Mazis, M. B. (1986). Measuring emotional
responses to advertising. Advances in Consumer Re-
search, 2:164–169.
Lourens, T., van Berkel, R., and Barakova, E. (2010).
Communicating emotions and mental states to robots
in a real time parallel framework using laban move-
ment analysis. Robotics and Autonomous Systems,
58:1256–1265.
Marian, D. E. and Shimamura, A. P. (2011). Emotions in
context: Pictorial influences on affective attributions.
Emotion, 12:371–375.
Poels, K. and Dewitte, S. (2006). How to capture the
heart? reviewing 20 years of emotion measurement
in advertising. KUL Working Paper No. MO 0605.
Available at SSRN: http://ssrn.com/abstract=944401
or http://dx.doi.org/10.2139/ssrn.944401.
Scherer, K. R. (2003). Vocal communication of emotion:
A review of research paradigms. Speech Communica-
tion, 40:227–256.
Segaran, T. (2008). Programming Collective Intelligence:
Building Smart Web 2.0 Applications. O’Reilly Me-
dia.
Terzis, V., Moridis, C., and Economides, A. (2011). Mea-
suring instant emotions based on facial expressions
during computer-based assessment. Personal and
Ubiquitous Computing, pages 1–10.
Uyl, M. J. D. and van Kuilenburg, H. (2005). The fac-
ereader: Online facial expression recognition. Mea-
suring Behavior 2005, 5th International Conference
on Methods and Techniques in Behavioral Research,
pages 589–590.
van den Broek, E. L., Janssen, J. H., Westerink, J. H., and
Healey, J. A. (2009). Prerequisites for Affective Signal
Processing (ASP). INSTICC Press, Portugal.
InterpretationofTimeDependentFacialExpressionsinTermsofEmotionalStimuli
237
