
Time-frequency Filtering of Gaussian and Impulse Noise for Spread
Spectrum Power Line Communication
Gaoyong Luo
School of Physics and Electronic Engineering, Guangzhou University, Guangzhou, Guangdong 510006, China
School of Computing and Advanced Technologies, Buckinghamshire New University,
High Wycombe, Buckinghamshire, HP11 2JZ, U.K.
Keywords: Power Line Communication, Spread Spectrum System, Impulse Noise Detection and Mitigation, Time-
frequency Filtering, Fast Computation.
Abstract: The affluence of impulse noise is one of the challenging problems of the power line communication (PLC)
as a communication channel. However, current methods for impulse noise reduction are either not effective
or requiring heavy computing for detecting impulse noise accurately. This paper presents a time-frequency
filter design method for impulse and Gaussian noise mitigation by a reliable noise detector in the wavelet
domain with local variance analysis. The filtering is applied only to the detected noisy samples with others
unchanged in an effort to reduce the noise level by adapting its operation in accordance with variance
characteristics. The received corrupted signal from spread spectrum system is decomposed into time-
frequency domain by fast implementation of lifting wavelet transform for real-time filtering of mixed
Gaussian and impulse noise. Experimental results demonstrate that the proposed method can significantly
reduce impulse noise and improve bit error rate (BER) without introducing distortion, leading to better
quality of service.
1 INTRODUCTION
Power line communication (PLC) offers many
advantages over other wire line and wireless
communication technology that makes it efficient
and economic to use for many years. The main
driving force lies in that communication over power
lines can provide good business opportunities for a
variety of different areas including electrical power
engineering, communication networks as well as
building automation, because the networks are
almost universal in coverage and are easily accessed
by wall plugs (Guo, 2005). However, unlike the
other wired communication mediums such as the
unshielded twisted pair (UTP) and coaxial cables,
low voltage (LV) power lines present an extremely
harsh environment for channel parameters namely,
noise, impedance mismatch and attenuation are
found to be highly unpredictable and variables with
time, frequency and location (Hossain et al., 2008).
Even though power lines are an attractive solution
for data transmission, a reliable communication is a
great challenge due to the nature of the medium
(Pighi and Raheli, 2007).
The power line is often considered an
unpredictable environment due to the time-variant
characteristics of the noise and the attenuation,
which limits the performance that can be achieved
(Biglieri, 2003). The noise level and the attenuation
depend partly on the set of connected loads, which
varies in time (Barmada et al., 2006). The noise
power on the power line is a sum of many different
disturbances. Noise on the power line, is influenced
by a large number of different noise sources with
different characteristics. There are broadband
disturbances such as universal motors, and
narrowband disturbances such as radio frequency
signals. Generally speaking, the dominant channel
disturbances occurring in power line channels are
colored background noise, narrowband interference
and impulse noise (Gotz et al., 2004); (Degardin et
al., 2002). Background noise is caused by
assembling of multiple sources of noise with low
power, and can be modeled as a white noise process
(Mlynek et al., 2010). Narrowband interference
(NBI) could originate from frequency/phase
modulated signals from broadcasting stations.
Impulse noise can be classified into three classes
(Tiru and Boruah, 2010): (i) periodic impulse noise
12
Luo G..
Time-frequency Filtering of Gaussian and Impulse Noise for Spread Spectrum Power Line Communication.
DOI: 10.5220/0004073500120018
In Proceedings of the International Conference on Signal Processing and Multimedia Applications and Wireless Information Networks and Systems
(SIGMAP-2012), pages 12-18
ISBN: 978-989-8565-25-9
Copyright
c
2012 SCITEPRESS (Science and Technology Publications, Lda.)

asynchronous with the AC mains; (ii) periodic
impulse noise synchronous with the AC mains; (iii)
asynchronous impulse noise.
Besides the background noise and the
narrowband noise which can be effectively reduced
by wavelet notch filter (Luo, 2010), impulsive noise
adversely affects the quality of service (Degardin,
2002). Impulse noise (IN) is a serious problem for
reliable communication over power lines (Lampe,
2011). Its affluence is one of the challenging
problems of the power line communication (PLC) as
a communication channel. Impulsive noise is one of
the most difficult transmission impairments to
suppress and has not been well characterized and
understood. It consists of random occurrences of
energy spikes with random amplitude and spectral
content, and affects data transmission by causing bit
or burst errors. As the ability to reject high levels of
interfering signals is one of the primary benefits of
spread spectrum communications, spread spectrum
modulation for resistance to jamming and multipath
is often used (Zhou et al., 2002). One of the
advantages using direct sequence spread spectrum
(DSSS) systems is an inherent immunity to
interferences, due to the processing gain (Proakis,
2001), i.e. bandwidth expansion factor. However,
this immunity is only effective up to certain
interference power, making it necessary to apply
additional techniques to suppress the effect of strong
impulse noise. Impulse noise has already been
proved as the most influential noise that degrades bit
error rate properties because impulse components of
voltage and current waveforms occur in wide
frequency bands widely due to switching of
semiconductor devices in home appliances. Among
all the types of noise, the asynchronous impulse one
is probably the most difficult to deal with and leads
to heavy detection and computing time (Guillet et
al., 2009). Impulse noise is difficult to remove by
conventional linear filters and wavelet denoising
method (Kuzume et al., 2000). Noise reduction
methods using wavelet transform take full advantage
of the localization both in time and frequency, and
the wavelet shrinkage technique is used to reduce
Gaussian noise (Donoho and Johnstone, 1994).
However, the nonlinear wavelet transform
thresholding method is not effective for impulse
noise reduction or requiring heavy computing for
detecting impulse noise accurately. One of the
main properties of the classical filters is that all input
samples are unconditionally affected by the filtering
process. In the presence of impulse noise, this
approach is not optimal in contrast to continuous
noise distributions, only certain samples of the
original signal are corrupted and others remain
unchanged. Clipping is a popular technique for
impulsive noise reduction (Al-Mawali and Hussain,
2009; Kim et al., 2011). At the receiver the
occurrence of an impulse is determined with a set
threshold and is corrected by replacing it by clipping
operation on the amplitude of the input signal
samples. The problem, however, is that the
definition of impulse length and the detection of an
impulse altogether is threshold dependent. And the
clipping method with nulling strategy may introduce
distortion or cause detrimental effects to the signal.
Due to the high unpredictability of the impulsive
noise, a good knowledge and characterization of
such noises is essential for their mitigation
(Khngosstar et al., 2011). To effectively detect and
suppress impulse noise with less signal distortion,
this paper explores the impulse noise characteristics
and presents a time-frequency filter design method
for impulse and Gaussian noise mitigation by
reliable noise detection in the wavelet domain.
2 TIME-FREQUENCY ANALYSIS
OF NOISE
Impulse noise consists of energy spikes with random
amplitudes and spectra. Because of its non-
stationary unpredictable nature, impulse noise does
not lend itself easily to a statistical description. A
mathematical model of noise in closed form for
power line communication can be expressed as a
probability density function (PDF) (Katayama et al.,
2006):
)
)(2
)(
exp(
)(2
1
))((
2
2
2
t
tn
t
tnP
σ
πσ
−=
(1)
where
)(tn
denotes the noise,
)(
2
t
σ
is the
instantaneous variance of the noise. In particular, the
PDF of impulse noise can be expressed as a sum of
Gaussian functions with different variances. The
noise waveform generated with this model shows
good agreement with that of actually measured noise
(Katayama et al., 2006). It is obvious that the noise
power is time function as well as frequency.
Wavelets introduce new classes of basis functions
for time-frequency signal analysis and have
properties particularly suited to the transient
(impulse like) components (Barmada et al., 2011).
The basic premise of wavelet transformations is that
for any given signal it is possible to decompose this
signal into many functions through translations and
dilations of a single function called a mother
Time-frequencyFilteringofGaussianandImpulseNoiseforSpreadSpectrumPowerLineCommunication
13
wavelet. Wavelet decomposition can be used to
detect and remove impulsive noises with transient
nature. To effectively suppress impulse noise, we
use two features of spread spectrum communication
to discriminate signal from impulse noise: one is the
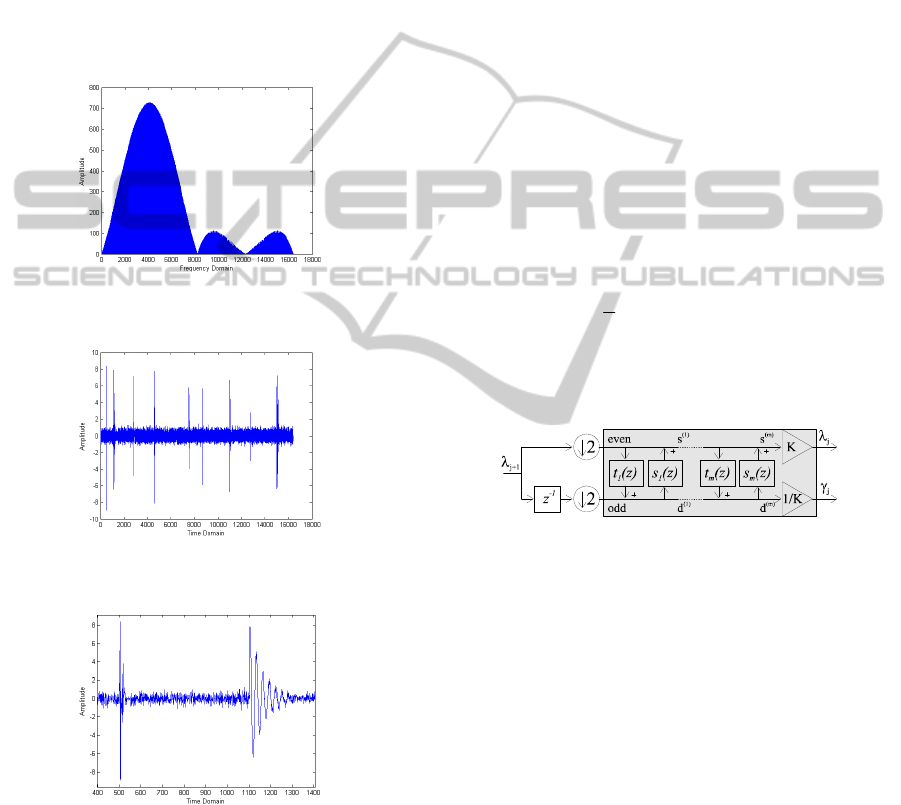
smooth envelope of spread signal’s spectrum (An
example of smooth spectrum of spread spectrum
signal without added noise is shown in Figure 1)
and the other is the nature of transient noise (An
example of spread spectrum signal with mixed
Gaussian and impulse noise in the time doamin is
shown in Figure 2 and Figure 3 shows the details of
the impulse noise).
Figure 1: An example of smooth spectrum of spread
spectrum signal without added noise.
Figure 2: An example of spread spectrum signal with
mixed Gaussian and impulse noise in the time doamin.
Figure 3: Details of the impulse noise.
Wavelet analysis is effectively a mathematical
microscope, which allows the user to zoom on
features of interest at different scales and locations.
However, the need for improvement of wavelets
comes from a shortcoming that is inherent because
of its construction. Second generation wavelets
(Sweldens, 1998), open a new direction to construct
wavelets, and are more general in the sense that all
the classical wavelets can be generated by the lifting
scheme. The lifting scheme makes optimal use of
similarities between the high and low pass filters so
as to achieve a faster implementation of WT.
Classical implementation of WT uses two band
filter bank (FB) with recursion on its low pass (LP).
Equivalent polyphase representation is depicted by
polyphase matrix
~
()Pz
, which is assembled from
even and odd filter components. Output of the FB is:
⎥
⎦
⎤
⎢
⎣
⎡
=
⎥
⎦
⎤
⎢
⎣
⎡
−
odd
even
yz
y
zP
HP
LP
1
)(
~
(2)
where HP denotes high pass and
even
y
is the even
part of the signal, and
odd
y
is the odd part.
~
()
~
()
~
()
~
()
~
()
Pz
hz hz
gz gz
eo
eo
=
⎡
⎣
⎢
⎤
⎦
⎥
(3)
For any filter pair
(, )hg
with
det[ ( )]Pz = 1
, always
exist factorisation of
P
z()
(Daubechies and
Sweldens, 1998):
Pz
K
K
sz
tz
i
i
im
()
()
()
=
⎡
⎣
⎢
⎢
⎤
⎦
⎥
⎥
⎡
⎣
⎢
⎤
⎦
⎥
⎡
⎣
⎢
⎤
⎦
⎥
⎧
⎨
⎩
⎫
⎬
⎭
=
∏
0
0
1
1
01
10
1
1
(4)
Equation (7) allows ladder realization of
~
()Pz
by
reversible lifting steps followed with normalization
by factor
K
as shown in Figure 4.
Figure 4: Ladder structure of lifting steps.
Signal is partitioned into even and odd
components that are then mutually predicted by
t
i
(to zero signal in HP part) and updated by
s
i
(to
retain in LP part signal moments). After
normalization the algorithm is recursively applied to
LP part.
In this study, 9/7 filter pair for fast computation
is used by factoring wavelet transform into lifting
steps. This filter pair is smooth and relatively short.
The analysis low pass filter has 9 coefficients, while
the synthesis high pass filter has 7 coefficients. This
is particularly suited to time-frequency analysis of
spread spectrum signal with strong noise applied to
power line. The lifting wavelet transform can be
implemented using the following lifting coefficients:
586134342.1
)1(
1
−
=
α
;
40529801185.0
)1(
1
−
=
β
;
(5)
8829110762.0
)2(
1
=
α
;
4425068522.0
)2(
1
=
β
;
81.14960439
=
K
.
SIGMAP2012-InternationalConferenceonSignalProcessingandMultimediaApplications
14

The lifting wavelet transform and the inverse
transform by lifting coefficients in floating-point
format is at the core of time-frequency analysis and
consumes the bulk of the processing time. This is
because performing signal decomposition requires
many multiplication operations, which increase the
computational complexity. To speed up the
computation, lifting coefficients can be quantized to
32-bit word-length, allowing fixed-point arithmetic
to be implemented so that all multiplications can be
replaced by bit shifts and additions to reduce
computational load.
3 NOISE DETECTION AND
FILTERING
Consider a baseband digital DSSS (direct sequence
spread spectrum) communications system, the
received signal
)(ty
can be modelled as
)()()()( tntntsty
imw
++=
(6)
where
)2cos()()()( tftctAdts
c
π
=
and
)(tn
w
is background noise,
)(tn
im
is impulse noise,
)(ts
is binary phase shift keying (BPSK) direct
sequence spread spectrum signal,
)(td
is a binary
sequence of data symbols taking on values
1
±
,
)(tc
is
the spreading sequence (PN code) taking on values
1±
,
c
f
is the carrier frequency of the transmitted
signal.
The time-frequency localization provided by
wavelet promises a possibility for better
discrimination between the noise and the real data.
In the case of direct observations of the object
y
, the
wavelet transform of the data results in coefficients
}{
λ
d
of the form using inner product
λλ
σ
zyd
+
>Ψ=< ,
(7)
where
λ
d
represents wavelet coefficients,
Ψ
is
wavelet function,
y
denotes object,
}{
λ
z
represents a
noise process. Specifically, by taking the wavelet
transform of the data, we obtain a representation
which contains the main structure of the signal in a
relatively few large coefficients, and the noise in the
remaining small coefficients. This is because in most
cases, noise can generally be represented as a
normally distributed (Gaussian), zero-mean random
process. Thus, it is required to calculate a threshold
value to identify the insignificant coefficients, which
may be considered as noise (noise coefficients). This
thresholding is adaptively subband dependent and is
based on local variance analysis. The formula for the
threshold on a given subband j is
X
j
σ
σ
λ
)
)
2
=
(8)
where
2
σ
)
is the estimated noise variance, and
2
X
σ
)
is
the estimated signal variance on the subband
considered. The noise variance is estimated as the
median absolute deviation of the coefficients on
level 1 (highest frequency subband):
6745.0
)(
i
WMedian
=
σ
)
, where
1subbandi
W
∈
(9)
The estimate of the signal standard deviation is
)0,max(
2
2
σσσ
)))
−=
WX
, where
∑
=
=
n
i
iW
W
n
1
2
2
2
1
σ
)
(10)
2
W
σ
)
is an estimate of the variance of the observations,
with n being the number of the wavelet coefficients
on the subband under consideration.
For Gaussian noise filtering, we define
j
aT
j
λ
=
(11)
where a (
10
≤
≤
a
) is a parameter that can be used to
moderate the shresholding to optimize the trade-off
between hard and soft thrsholding of wavelet
shrinkage technique for Gaussian noise reduction as
),)(()(
j
TddsigndS −=
λλλ
if
j
d
λ
λ
>
(12)
0
=
, otherwise
and a is set at subband j adaptively to
2
σ
)
as
)(
2
2
2
X
j
a
σσ
σ
))
)
+
=
(13)
The wavelet coefficients at each level (subband) are
treated separately, so the threshold
j
λ
depends only
on the values of the coefficients at level j. Adaptivity
in this technique is based on local variance analysis.
By utilizing the parameter a with local variance
analysis, this method improves the soft wavelet
shrinkage technique to optimally reconstruct a signal
from samples contaminated by Gaussian noise. In
this method, small wavelet coefficients are set to zero
since they are likely to contain little signal energy,
and larger wavelet coefficients are scaled down since
they are likely to contain greater signal energy. In
such a way, noisy wavelet coefficients are eliminated
by comparison to the predetermined threshold.
When studying the effects of impulsive noise on
PLC, both background noise and impulsive noise are
considered. To reduce impulse noise with less signal
distortion, it is required to detect impulse events and
identify correctly their temporal boundaries in a
stream of noise signal samples that also contains
Time-frequencyFilteringofGaussianandImpulseNoiseforSpreadSpectrumPowerLineCommunication
15

nonimpulsive background noise. As impulse noise
can be expressed as a sum of Gaussian functions
with different variances, it can be detected by
measure the changing variance through a sliding
window with subsequent overlapping sections of the
signal. In each window with N samples (wavelet
coefficients) on the subband, the variance is
∑
=
=
N
i
iW
W
N
1
2
2
2
1
σ
)
(14)
If the variance of the windowed wavelet coefficients
is higher than a threshold, the window is marked as
containing an impulse thus the location of impulse
noise is detected. The threshold value is determined
by calculating the median of variances of windowed
samples on each subband. The threshold can be set
at median value multiplied by 1.2 to determine the
presence of impulse noise in a window as
2.1*)(
2
Wv
Median
σλ
)
=
(15)
Then from equation (6), we obtain the estimated
signal
)(ks
)
by using a filter
)(kh
as
)()()( kykhks =
)
(16)
because
))(()(
yy
mkymky −+=
, where
y
m
is the mean
of
)(ky
, we have
)))(()(()(
yy
mkymkhks −+=
)
(17)
If the filtering would not take effects to the mean
y
m
and we would consider always reducing noise
variance, the filter
)(kh
can be designed:
)(
)(
2
2
2
σσ
σ
))
)
+
=
y
y
kh
(18)
where
2
y
σ
)
is the variance of the observations,
2
σ
)
is
the noise variance. Thus the impulse noise filtering
operation can be performed in the time-frequency
domain by the filter on each subband j:
)(
)()(
2
2
2
σσ
σ
))
)
)
+
−+=
W
W
WkWj
mWmks
(19)
where
j
s
)
is the estimated signal at level j, W is the
received signal, and
W
m
is the mean of W. The
filtering is applied only to the noisy windowed
samples which accounts for the impulse clustering.
The filtering is iterated until the variance of the
filtered samples is equal to or lower than
v
λ
, such
that the impulse noise with short term fluctuations is
smoothed out. The signal-adaptive filter can always
reduce the variance namely the noise level of the
detected noisy samples by adapting its operation in
accordance with local variance characteristics. By
applying “no filtering” to preserve true signals and
filtering to remove impulse noise with a robust
estimator, impulse is detected and mitigated. The
algorithm is straightforward, low in complexity,
achieves high filtering performance and requires no
previous training.
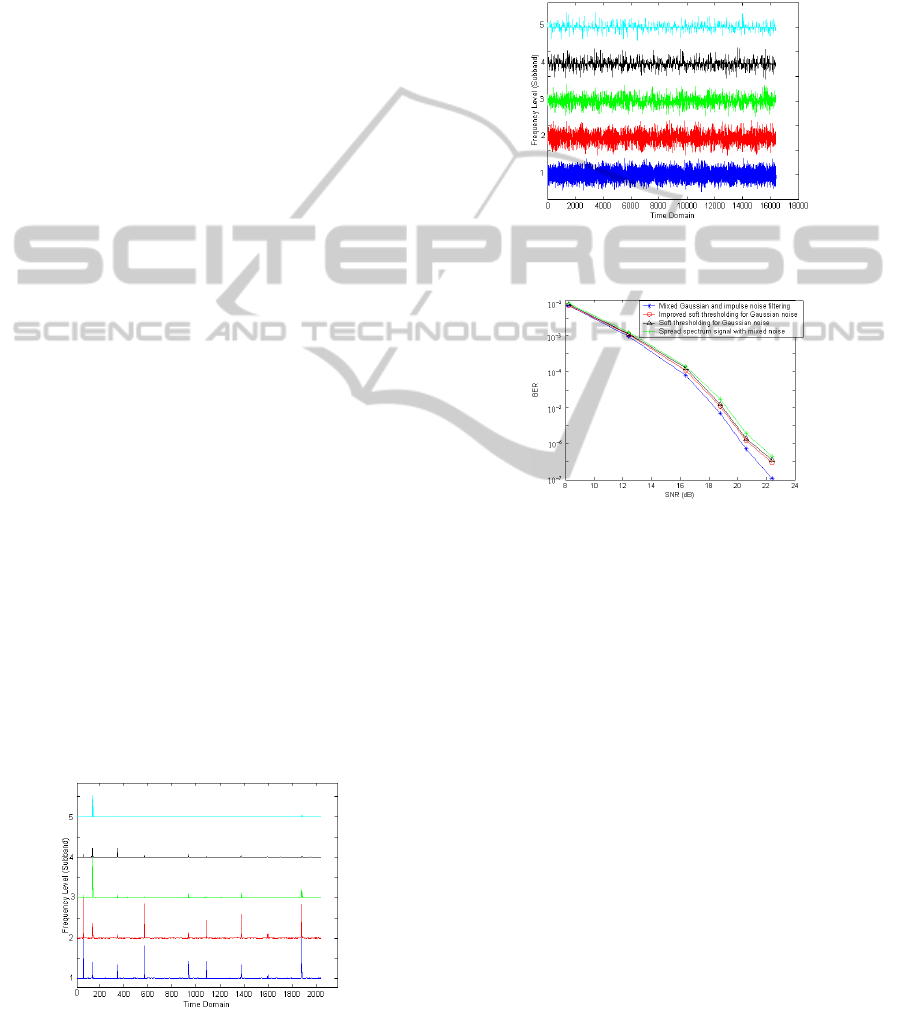
Figure 5: An example of time-frequency decomposition
using the original signal shown in Figure 2.
4 EXPERIMENTAL RESULTS
AND DISCUSSIONS
Background and impulse noise are among principal
impairments in PLC channels. Spread spectrum
power line noise detection and suppression is
performed by fast time-frequency wavelet
decomposition and variance analysis. To evaluate the
noise suppression versus bit error rate (BER), a
spread spectrum system was set up for power line
communication. The system spreading code is a
maximal sequence 511 chips PN code clocked at a 1
MHz chip rate. The data spreading signal is mixed
with a carrier frequency (centred on 5 MHz) by
binary phase shift keying (BPSK) to generate the
transmitted spread spectrum signal. Spreading signal
is transmitted by power line channel with mixed
additive white Gaussian noise (AWGN) with mean
zero and impulse noise. Impulse noise is generated
for power line channel with different variance, length
(decay rate) and spike (amplitude and spectral
content). Different impulse noise (periodic or
nonperiodic, asynchronous or synchronous with the
AC mains) is applied to the channel. BPSK
interfering signal from the output of the channel then
enters the receiver. At the receiver, modulated signal
is demodulated by mixing with 4 MHz to
downconvert to IF (intermediate frequency)
frequency at 1 MHz. The final detection output is
obtained through FFT (fast Fourier transform) based
correlation. Noise detection and suppression is
performed in the wavelet domain on each subband of
decomposed data (8 PN codes with 8 bit symbols for
one frame, an example of time-frequency
decomposition for 5 subbands is shown in Figure 5
SIGMAP2012-InternationalConferenceonSignalProcessingandMultimediaApplications
16
using the original signal shown in Figure 2) and the
final results are measured by conducting bit error
rates (BER) performance comparison against signal
to noise ratio (SNR) at one noise level set. The noise
impulses are characterised with high energy levels
and the SNR of symbols affected by impulse noise is
typically very low. In the process of noise detection
and suppression, Gaussian noise is first detected and
removed by the proposed improved soft thresholding
technique. Impulse noise detection is done by local
variance analysis through a sliding window of 16
samples with subsequent overlapping sections of 8
samples. Figure 6 shows the resultant variances by
the sliding window using corrupted signal shown in
Figure 2 and the corresponding time-frequency
decomposition shown in Figure 5. The designed
time-frequency filter only applies to the windowed
samples marked as impulse, and the corresponding
wavelet coefficients are then smoothed out. Figure 7
shows the filtering results by mixed Gaussian and
impulse noise suppression in the wavelet domain.
Finally inverse wavelet transform is performed to
transform the signal back to the time domain for
symbol detection. The corresponding bit error rates
(BER) are calculated by summing 10000 runs of the
demodulated signals (10000 blocks of data) when
transmitted over a noisy power line channel
producing impulse noise (with different variances) in
accordance with different Gaussian noise level. The
measurement results are summarized and shown in
Figure 8 by illustrating BER measured versus SNR in
dB. A comparison is performed by measuring BER
of spread spectrum signal with mixed Gaussian and
impulse noise, signal after soft thresholding for
Gaussian noise reduction, signal after improved soft
thresholding for Gaussian noise reduction, and signal
after mixed Gaussian and impulse noise detection
and suppression respectively. It can be seen that the
proposed method of mixed noise suppression
significantly reduces impulse noise thus improves
BER for better data communication over power lines.
Figure 6: Variance estimation through sliding window in
the time-frequency domain.
Experimental results show that the proposed
method is able to significantly reduce impulse noise
without degrading the quality of the signal or
introducing distortion. It is noted that the filtering of
both Gaussian and impulse noise is highly
computationally efficient by fast implementation of
lifting wavelet transform.
Figure 7: Mixed Gaussian and impulse noise suppression
in the wavelet domain.
Figure 8: Comparison of BER measured versus SNR.
5 CONCLUSIONS
The proposed method of mixed Gaussian and
impulse noise detection and mitigation by local
variance analysis in the wavelet domain, applies
iterative, selective and adaptive filtering on the
corrupted spread spectrum signal over power lines.
The filtering is applied only to the detected noisy
samples with others unchanged in an effort to reduce
the noise level by adapting its operation in
accordance with variance characteristics.
Experimental results demonstrate that this method
removes impulse and Gaussian noise, also
simultaneously preserves signal features and
improves bit error rate (BER) for better quality of
service provided by spread spectrum power line
communication. The developed lifting wavelet
transform results in a fast implementation of the
time-frequency filtering operation, and makes it
highly computationally efficient and suitable for
real-time applications.
Time-frequencyFilteringofGaussianandImpulseNoiseforSpreadSpectrumPowerLineCommunication
17

ACKNOWLEDGEMENTS
Research support from the Natural Science
Foundation of China (No. 60971093) is gratefully
acknowledged.
REFERENCES
Al-Mawali, K. S. and Z. M. Hussain, Z. M., (2009).
Adaptive-threshold Clipping for Impulsive Noise
Reduction in OFDM-Based Power Line
Communications.
Proceedings of 2009 International
Conference on Advanced Technologies for
Communications, pp 43-48, Hai Phong, Vietnam.
Barmada, S., Musolino, A. and Raugi, M., (2006).
Innovative Model for Time-varying Power Line
Communication Channel Response Evaluation.
IEEE
Journal on Selected Areas in Communications
, Vol.
24, No. 7, pp. 1317–1326.
Barmada, S., Musolino, A., Raugi, M., Rizzo, R. and
Tucci, M., (2011). A Wavelet Based Method for the
Analysis of Impulsive Noise due to Switch
Commutations in Power Line Communication (PLC)
Systems.
IEEE Transactions on Smart Grid,Volume:2,
Issue:1 pp 92–101.
Biglieri, E., (2003). Coding and Modulation for a Horrible
Channel.
IEEE Communications Magazine, Vol. 41,
No. 5, pp. 92–98.
Daubechies, I. and Sweldens, W., (1998). Factoring
Wavelet Transforms into Lifting Steps
. J. Fourier
Anal. Appl
. 4(3), 247-269.
Degardin, V., Lienard, M., Zeddam, A., Gauthier, F. and
Degauque, P., (2002). Classification and
Characterization of Impulsive Noise on Indoor Power
Line Used for Data Communications.
IEEE
Transactions on Consumer Electronics
, Vol. 48, No.
4, pp 913–918.
Donoho, D. L. and Johnstone, I. M., (1994). Ideal Spatial
Adaptation via Wavelet Shrinkage.
Biometrica 81, pp
425-455.
Gotz, M., Rapp, M. and Dostert, K., (2004). “Power Line
Channel Characteristics and Their Effect on
Communication System Design.
IEEE
Communications Magazine
, Vol. 42, No. 4, pp 78–86.
Guillet, V., Lamarque, G., Ravier, P. and Leger, C.,
(2009). Improving the Power Line Communication
Signal-to-noise Ratio during a Resistive Load
Commutation.
Journal of Communications, Vol. 4,
No. 2, pp 126-132.
Guo, J., (2005). Transmission Characteristics of Low-
voltage Distribution Network in China and Its Model.
IEEE Transaction on Power Delivery, Vol.20, No.2,
pp. 1341-1348.
Hossain, E., Khan, S. and Ali, A., (2008). Modeling Low
Voltage Power Line as a Data Communication
Channel.
World Academy of Science, Engineering and
Technology
, 45:148-152.
Katayama, M., Yamazato, T. and Okada
, H., (2006). A
Mathematical Model of Noise in Narrowband Power
Line Communication Systems.
IEEE Journal on
Selected Areas in Communications
, Vol. 24, No. 7, pp
1267-1276.
Khangosstar, J., Li, Z. and Mehboob, A., (2011). An
Experimental Analysis in Time and Frequency
Domain of Impulse Noise over Power Lines.
Proceedings of 2011 IEEE International Symposium
on Power Line Communications and Its Applications
(ISPLC),
pp 218 - 224, Udine, Italy.
Kim, Y. C., Bae, J. N. and Kim, J. Y., (2011). Novel Noise
Reduction Scheme for Power Line Communication
Systems with Smart Grid Applications.
Proceedings of
2011 IEEE International Conference on Consumer
Electronics (ICCE), pp791 – 792, Las Vegas, NV.
Kuzume, K., Shigeru, T. and Niijima, K. (2000). Impulse
Noise Reduction Based on Lifting Wavelet Transform.
Proceedings of European Signal Processing
conference
, pp 1937-1940, Tampere, Finland.
Lampe, L., (2011). Bursty Impulse Noise Detection by
Compressed Sensing.
Proceedings of 2011 IEEE
International Symposium on Power Line
Communications and Its Applications (ISPLC), pp 29
- 34, Udine,Italy.
Luo, G. Y., (2010). On Denoising of Spread Spectrum
Communication for Wireless Location.
Proceedings of
2010 International Conference on Communications
and Mobile Computing, pp 56-62, Shenzhen, China.
Mlynek, P., Koutny, M. and Misurec, J., (2010). Power
Line Modelling for Creating PLC Communication
System.
International Journal of Communications,
Issue 1, Volume 4, pp13-21.
Pighi, R. and Raheli, R., (2007). Linear Predictive
Detection for Power Line Communications Impaired
by Colored Noise. EURASIP Journal on Advances in
Signal Processing, Volume 2007, ID 32818, pp 1-12.
Proakis, J. G., (2001).
Digital Communications, 4th
edition, Electrical Engineering Series. McGraw-Hill
International Editions, New York, NY, USA.
Sweldens, W., (1998). The Lifting Scheme: A
Construction of Second Generation Wavelets.
SIAM J.
Math. Anal.
29(2), 511-546.
Tiru, B. and Boruah, P. K., (2010). Multipath Effects and
Adaptive Transmission in Presence of Indoor Power
Line Background Noise.
International Journal of
Communication Systems
, 23:63-76.
Zhou
,S., Giannakis, G. B. and Swami, A., (2002). Digital
Multi-carrier Spread Spectrum versus Direct Sequence
Spread Spectrum for Resistance to Jamming and
Multipath.
IEEE Transactions on Communications,
Vol. 50, No. 4, pp 643-655.
SIGMAP2012-InternationalConferenceonSignalProcessingandMultimediaApplications
18
