
Investigation of a Radio Propagation Model for Vegetation Scatter
Dynamic Channels at BFWA Frequencies
Sérgio Morgadinho
1,3
, Juergen Richter
3
,
Rafael F. S. Caldeirinha
1,2,3
and Telmo R. Fernandes
1,2
1
Instituto de Telecomunicações, Leiria, Portugal
2
Polytechnic Institute of Leiria, Departament of Electrical and Electronic Engineering, Leiria, Portugal
3
University of Glamorgan, Faculty of Advanced Technology, Pontypridd, U.K.
Keywords: Radio Propagation Model, Radiative Energy Transfer (RET), Time-variant Channel, Vegetation Scatter,
Dynamic Effects, BWA Frequency.
Abstract: The successful deployment of wireless technologies in the micro- and millimetre frequencies relies on the
understanding of radio channel propagation and accurate radio propagation models. To this extent, the
dynamic effects of vegetation on radio signals are investigated, as a function of wind direction, receiver
location and vegetation depth. Furthermore, a radio propagation model, based on the RET, is investigated as
an approach to predict the channel dynamic effects of vegetation scatter at 20 GHz. The model is evaluated
for a structured forest medium, and its performance is assessed through the use of primary, secondary and
error quantification statistics.
1 INTRODUCTION
Growing demand for bit stream access to provide
multimedia services, at fixed and mobile locations,
have led the industry to continue to develop new
technological solutions capable of surmounting the
technical hurdles involved. Broadband Wireless
Access (BWA) systems envisage the use of the
frequency band from 2 to 60 GHz (IEEE 802.16,
2011); (Mehmet et al., 2006). The IEEE Standards
Association has standardized a suite of 802.16
standards to cover LOS and non-LOS connectivity
covering the 2 to 10 GHz and 10 to 60 GHz
frequency bands, respectively (IEEE 802.16, 2011).
The 20 to 40 GHz frequency band is to be used for
BFWA (Broadband Fixed Wireless Access) systems.
The successful deployment of technologies in the
micro- and millimetre frequency bands relies,
amongst other factors, on the precise planning,
design and successful implementation of the
communication systems. In order to achieve this, in
depth understanding of the radio channel
propagation phenomena and consequent accurate
radio propagation models are essential.
Within the many obstacles, that may be present
in the propagation path in rural, sub-urban and urban
scenarios, several studies have shown that vegetation
can critically affect the received radio signal (Meng
et al., 2009); (Violette et al., 1985); (Schwering et
al., 1988); (Caldeirinha, 2011); (Al-Nuaimi and
Hammoudeh, 1993). The effects of absorption and
scattering of static vegetation have been considered,
while relatively few studies have considered the
effects of wind induced vegetation movement. These
studies show that wind causes the foliage medium to
move to an extent that results in significant temporal
variations of the received signal (Naz and Falconer,
2000); (Kajiwara, 2000); (Perras and Bouchard,
2002); (Hashim and Stavrou, 2006); Crosby et al.,
2005). The recommended model for vegetation
attenuation is the ITU-R P833 (ITU), of which the
latest version has been updated to include results of
measurements made in the UK and Norway for both
attenuations and to include the dynamic effects
caused by wind induced foliage movement.
The work presented in this paper aims to
contribute to the modelling of the dynamic effects
covering the micro- and millimetre frequency bands.
A model is proposed as a reasonable approach to
predict the time-variant scattered signal from
vegetation. The proposed model is based on the
Radiative Energy Transfer (RET) theory.
This paper is structured as follows. In section 2
the results from an investigation on the dynamic
effects of vegetation on radio signals, are presented.
Two sets of measurements were performed at 20
329
Morgadinho S., Richter J., F. S. Caldeirinha R. and R. Fernandes T..
Investigation of a Radio Propagation Model for Vegetation Scatter Dynamic Channels at BFWA Frequencies.
DOI: 10.5220/0004069203290339
In Proceedings of the International Conference on Signal Processing and Multimedia Applications and Wireless Information Networks and Systems
(WINSYS-2012), pages 329-339
ISBN: 978-989-8565-25-9
Copyright
c
2012 SCITEPRESS (Science and Technology Publications, Lda.)

GHz. One set of measurement on single trees, and
the other on a structured formation of trees. The
results are analysed as to the impact of wind
incidence on single trees, and the interrelated impact
of wind direction, vegetation depth and location of
radio receiver on received signals inside a forest
medium. Section 3 describes the proposed model
rationale and formulation. A brief description of the
RET and dRET theories is provided as well as the
reasons leading to consider the dRET model to
predict time-varying estimates of received radio
signals inside forest media. The proposed modelling
methodology makes use of the dRET input
parameters to extend the dRET to consider channel
dynamics. Both the model input parameters and
intensity equations, used to calculate the received
scatter signal, are expressed in equations. Section 4
presents the model assessment results. A simulation
structured tree formation scenario is used to validate
the proposed modelling approach against measured
data. The model is assessed against various receiver
positions and wind directions. Primary and
secondary statistics are used to evaluate the model
performance. In addition, ERMS errors are
calculated for a number of scenarios to quantify the
performance of the model. The model is shown to be
a reasonable approach to model the dynamic effects
in foliage channels. Section 5 concludes the paper. A
summary of the findings is presented as well as
suggestions for further model improvements and
validation processes.
2 STATISTICAL
CHARACTERISATION OF THE
DYNAMIC EFFECTS IN
FOLIAGE MEDIA
The investigation of the dynamic effects of
vegetation on propagating radio signals in single
trees and groups of trees is essential to understand
the behaviour of scattered signals from foliage under
wind induced movement. The propagation of radio
signals through and scattered from foliage is
expected to vary according to the change of wind
speed, wind incidence in reference to the point of
illumination of the air-to-vegetation interface and
position of the receiver inside a forest medium, i.e.
vegetation depth.
Specific measurements were performed to
investigate these matters, and to enable the
assessment of the proposed model performance.
2.1 Measurement Geometry
Radio measurements were performed on two distinct
scenarios, inside an anechoic chamber. The
measurements were executed using a Continuous
Wave (CW) measurement system operating at a
fixed frequency of 20 GHz.
The single tree scenario measurements were
performed on one downscaled tree, of the Ficus
species, where the time-varying re-radiation pattern
of the tree was recorded. The experiment geometry
is depicted in Figure 1 a). The re-radiation pattern
was recorded over an angular range of 240º, with an
angular resolution of 2º. Both the transmitter and
receiver were placed in far field region of the
antennas, illuminating around 90% of the centre
canopy. This guarantees the received signal
originates either from scattered signals from the
foliage or signals propagating through the foliage
medium. In these experiments a horn antenna of 10
dBi gain was used on the transmitter side, and a 20
dBi Gaussian antenna, with a 4º beam width, was
used at the receiver. The dynamic signal envelope
was recorded over a period of 10s at a sampling rate
of 1 kHz, per scatter angle. The wind induced effects
were simulated with a household fan, placed in four
distinct locations around the tree, as depicted in
Figure 1 a). The fan produced wind at a constant
speed of 4.7 m/s, and illuminated the full extent of
the canopy.
(a)
(b)
Figure 1: Measurement geometry of the: a) single tree and
b) tree formation scenarios.
WINSYS2012-InternationalConferenceonWirelessInformationNetworksandSystems
330

The tree formation measurements were
performed on trees of the Ficus species, where the
directional spectrum was recorded at four specific
positions inside the forest medium. The experiment
geometry is depicted in Figure 1 b). The directional
spectrum was recorded by rotating the receiver
around its own axis, in the azimuth plane, over a
range of 360º with an angular resolution of 2º. The
transmitter was placed conveniently to guarantee the
illumination of 90º of the air-to-vegetation interface.
The 10 and 20 dBi antennas used in the single trees
measurements, were also used in these
measurements, on the transmitter and receiver side,
respectively. The received time-series were recorded
over a period of 10s, per angle, with a sampling rate
of 1 kHz. Once again the wind induced effects were
simulated with a household fan, placed in four
distinct locations around the tree, as seen in Figure 1
b). The fan produces a wind front at the air-to-
vegetation interface with relative narrow width
illumination (around 2 trees), in comparison to wide
uniform wind illumination observed in outdoor
forest geometries. However, given the small
dimensions of the indoor measurement geometries,
the employed method to generate artificial wind is
found to be suitable.
2.2 Statistical Analysis
A statistical analysis was performed on the single
tree and tree formation measurements. The ensuing
results are presented. The single tree results focus on
the effects of different wind incidences on the
scattered radio signals. The tree formation results
aim to investigate the effect of vegetation depth on
the received signal, as wind induced vegetation
movement causes channel dynamics across the
foliage medium, from different incidences.
The analysis of the single tree results is done
through the appreciation of the re-radiation pattern
through a skewed box plot based on a Lognormal
distribution, and second order statistics Average
Fade Duration (AFD) and Level Crossing Rate
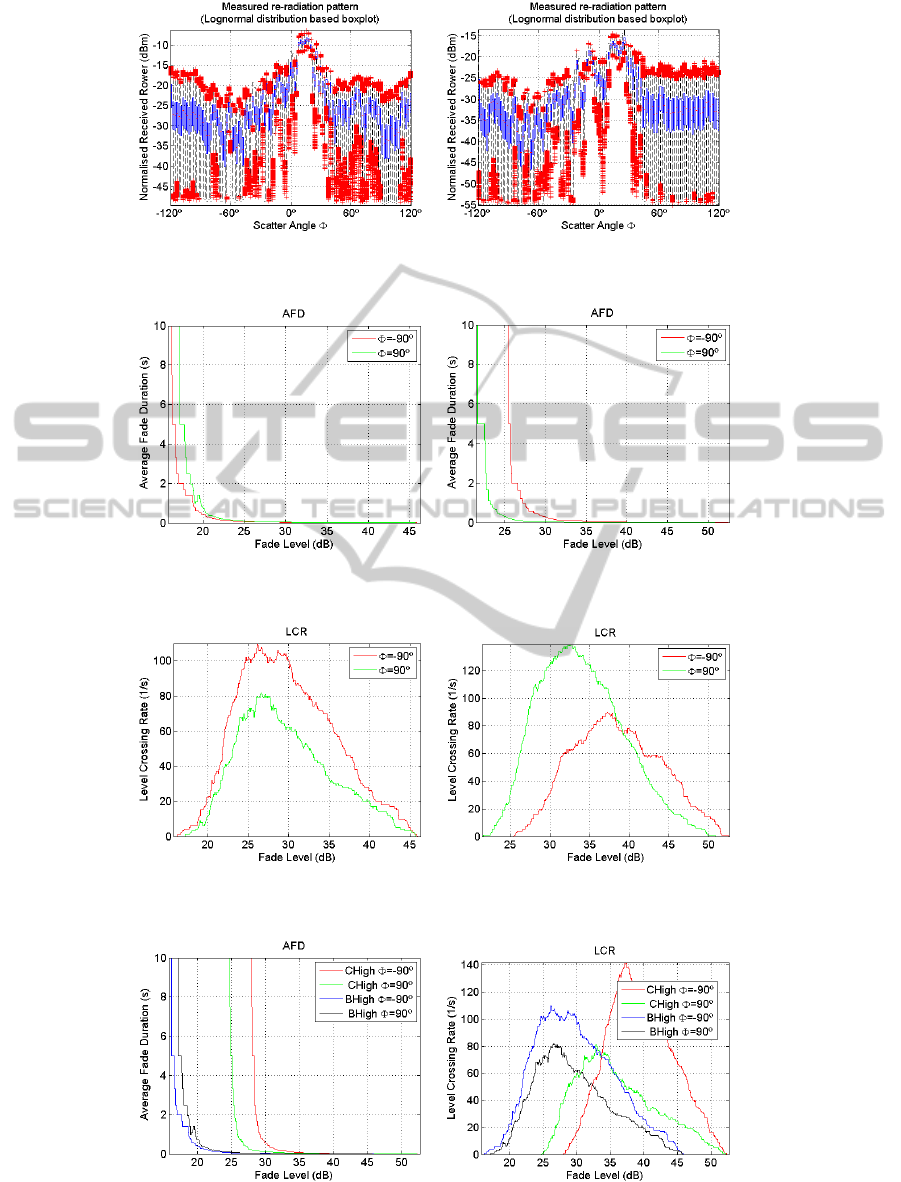
(LCR). Concerning the box plot depictions, on each
blue box the central mark is the median, the edges of
the box are the 25
th
and 75
th
percentiles, the whiskers
(dotted line) extend to the most extreme data points,
and the outliers (red dots) are plotted individually.
The box plot enables the analysis of the following
information about the data: position, spread,
skewness and tails. The measured radio signal
scattered from the vegetation volume is shown to be
influenced by the direction of the artificially
generated wind. As wind is blown on to a single tree
from a specific direction, two areas of vegetation
motion need to be considered. One area of the tree,
where the wind incises directly on the foliage (active
area), and another area opposite to the first (quiet
area). The foliage dynamics in the quiet area are
observed to be reduced in comparison to the active
area, as a result of wind speed decay through the
vegetation media. A comparison between measured
re-radiation patterns obtained with opposite wind
directions is depicted in Figure 2. The active area is
considered to be from Φ=-120º to Φ=-50º and
Φ=50º to Φ=120º, for wind directions B and F,
respectively. The quiet area may be defined as the
opposite, in reference to the wind direction. For both
wind incidences in analysis, the received signal in
the active area presents an increased standard
deviation in comparison to the quiet area. This is
indicated by the lack of outliers in the active area
below the mean level. The increased number of
outliers in the quiet area below the mean level shows
that the received signal seldom falls into signal
levels as low as the ones observed in the active area.
In addition, analysis of the AFD and LCR statistics,
depicted in Figure 3 and Figure 4, show that the
deep fades in the active area as well as the fast-
fading signal variation are greater compared to the
quiet area results. Furthermore, analysis of the
results in Figure 5, show that a distinct
differentiation can be made on whether the wind
incidence is on the transmitter or receiver side. The
depicted results relate to AFD and LCR statistics,
obtained at Φ=-90º and Φ=90º, for wind incidences
of B and C. These show lower signal fades and
signal crossing rates observed in results from wind
direction B, against wind direction C. When the
direction of wind illuminates the tree canopy in the
same direction of the propagating radio wave, the
received signal presents smaller signal fades and
lower signal variation compared to wind
illumination from the receiver (opposite) side.
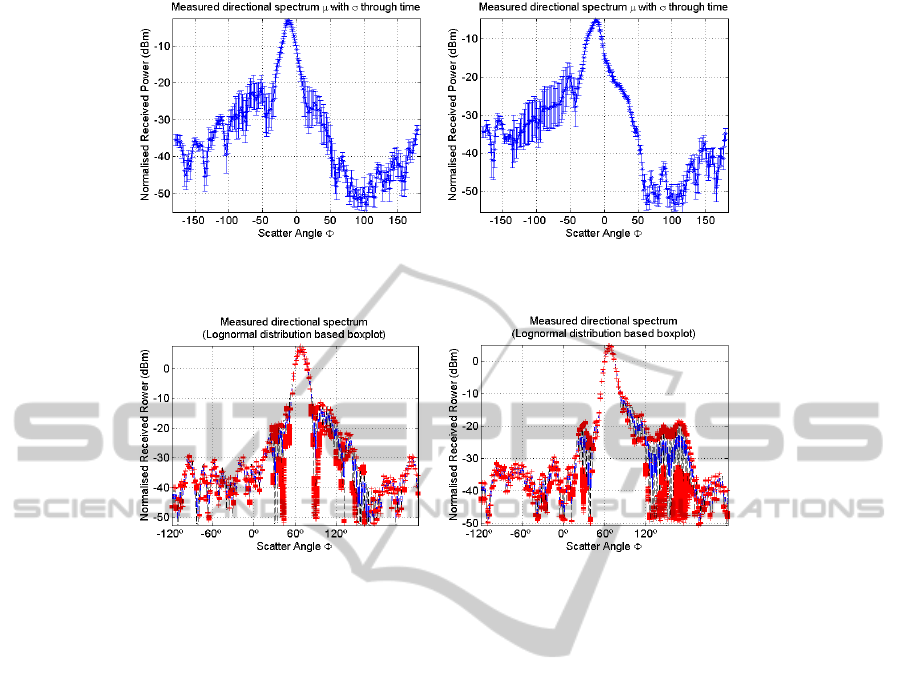
The investigation of the tree formation results is
done through the analysis of the re-radiation pattern
and its corresponding boxplot. The measured
directional spectrum inside a forest medium is
shown to be influenced not only by the direction of
wind illumination, but also the amount of vegetation
between the source of wind and position of the
receiver. Analysis of the results depicted in Figure 6,
show that the origin of measured scatter dynamics
varies according to the wind source of illumination.
For instance, Figure 6 a) shows the re-radiation
pattern relative to wind direction B. In this case the
measured dynamics observed from Φ=-100º to
Φ=50º (except in the main lobe region where the
InvestigationofaRadioPropagationModelforVegetationScatterDynamicChannelsatBFWAFrequencies
331
(a) (b)
Figure 2: Measured re-radiation boxplot patterns for wind incidences from: a) B and b) F.
(a) (b)
Figure 3: Measured AFD statistics at Φ=-90º and Φ=90º, for wind incidences from: a) B and b) F.
(a) (b)
Figure 4: Measured LCR statistics at Φ=-90º and Φ=90º, for wind incidences from: a) B and b) F.
(a) (b)
Figure 5: Measured statistics at Φ=-90º and Φ=90º, for wind incidences from B and C, concerning: a) AFD and b) LCR.
WINSYS2012-InternationalConferenceonWirelessInformationNetworksandSystems
332
(a) (b)
Figure 6: Measured directional spectrum from position Rx2, with wind incidence from: a) B and b) F.
(a) (b)
Figure 7: Measured directional spectrum from position Rx3, with wind incidence from: a) B and b) C.
received signal is coherent and presents little or no
variation at all) are relative to the time-varying
scatter originating from trees 1, 2 and 3 (as signalled
in Figure 1 b)). Given this geometry, these are the
trees most affected by the incidence of wind, and
more prone to generate dynamic scattering of
propagating signals. On the other hand, through
analysis of Figure 6b), the change of wind source
from B to F, results in increased dynamic scatter
from trees 2, 3 and 4, indicated by the standard
deviation observed around -125º≤Φ≤50º. These
results show that the change of wind direction does
not have a significant impact on the averaged
directional spectra. However change of wind
incidence does account for a change in measured
dynamics in specific angular regions, depending on
the wind direction.
Vegetation depth is expected to play a significant
role on the effect of wind on foliage and its effect on
propagating radio signals. As wind propagates
through vegetation its force decreases as a result of
wind decay and dispersion. As a consequence, wind
induced vegetation movement will decrease
resulting in lower channel dynamics. Results shown
in Figure 7 allow the observation of this. The
standard deviation observed in the measured
directional spectrum at Rx3 with wind from position
B, is close to neglectible. The depth of 2 to 3 trees is
too great for wind to have a noteworthy impact on
trees 3 and 4, and cause significant channel
dynamics. The change of wind direction from B to
C, results in high scatter dynamics from tree number
5 (region 50º≤Φ≤90º) and mild effects from trees 3
and 4 (region -50º≤Φ≤-10º). These results show that
the wind point of source, forest geometry and
position of radio receiver are all intrinsically
interrelated. These variables need to be considered
collectively when investigating the modelling
methodology and developing the propagation model
rationale.
3 MODEL RATIONALE AND
FORMULATION
The channel characterisation discussed in the
previous section, has shown that the propagation
phenomena of radiowaves in forest media, under
time-varying conditions, depends extensively on the
geometry of forest, location of receiver and source
of wind variation in reference to the receiver
position. The considered modelling approach must
take into account these deciding factors and provide
InvestigationofaRadioPropagationModelforVegetationScatterDynamicChannelsatBFWAFrequencies
333

not only insight into radio propagation physical
phenomena in forested scenarios but also enable
geometrical consideration of the scenario variables.
To this extent the model is based on the RET theory,
more specifically one of its derivatives, the dRET.
The RET theory, or energy transport theory,
models vegetation as a random homogeneous
medium comprised of small discrete scatterers. The
RET has been shown to be a good solution to predict
the complex phenomena of radio propagation
through vegetation, as it provides accurate
evaluation of the through vegetation attenuation with
both horizontal and slant foliage paths (Johnson and
Schwering, 1985); (Meng and Lee, 2010); Rogers et
al., 2002). In spite of this, the RET has a crucial
shortcoming. It assumes the forest as a
homogeneous medium, and that it extends to
infinity. In order to overcome these limitations, an
improved version named the discrete RET (dRET)
was proposed by Didascalou (Didascalou et al.,
2000) and further enhanced by Fernandes
(Fernandes et al., 2007).
In the dRET the vegetation volume is divided
into non-overlapping cubic cells. This is particularly
beneficial in dealing with inhomogeneous media.
The process of splitting a forest formation into
discrete elementary volumes allows the assignment
of different scattering parameters to each cell. Each
cell may be represented by four input parameters
(Didascalou et al., 2000); (Fernandes et al., 2007):
the absorption coefficient (σ
A
, in Np/m), the
scattering cross section per unit volume (σ
S
, in m
-1
),
and the phase function parameters α and β. The
phase function may be understood as the cell
radiation pattern, with a pronounced forward lobe in
the direction of signal propagation, and an isotropic
background (Johnson and Schwering, 1985). The
input parameters of each cell are used to calculate
the incident intensity (the RET uses intensity as a
fundamental quantity). An iterative algorithm is used
to gather all the interactions between the cells, to
perform the computation of intensity across the
forest formation. The total specific incident
intensity, in each cell, can be decomposed into the
reduced intensity I
ri
and diffuse intensity I
d
. While
both the input and output coherent intensities I
ri
exhibit the same definite direction, each input
diffuse intensity component
IN
d
I
generates several
output components due to the scattering process
(Johnson and Schwering, 1985); (Fernandes et al.,
2007), as depicted in Figure 8.
The reduced and diffuse intensity were originally
expressed in (Johnson and Schwering, 1985), and
further discretised by (Didascalou et al., 2000);
(Fernandes et al., 2007), to allow discrete
formulations for losses due to absorption, scattering ,
increase of intensity resulting from scattering
contributions from surrounding cells.
Figure 8: Representation of a single cell with size ∆s.
The dRET enables insight into the complex
propagation phenomena in scatter media, based on
physical attributes of the vegetation (e.g. phase
function). Furthermore, due to its discretised
formulation it allows the enhanced resolving of the
various directional intensities originating from
individual vegetation cells. For these reasons, the
proposed modelling methodology will be based on
the dRET to provide time-varying estimates of
received signal inside forest medium.
Since the dRET, in its current rationale, is only
applicable to static conditions, the extension of the
dRET to consider channel dynamics will be done
through the time-variation of its input parameters.
Analysis of the dRET input parameters time-varying
properties, and its impact on the dRET predicted
directional spectra, has been conducted (Morgadinho
et al., 2011); (Sergio et al., 2011). The published
results have shown that the dRET parameters vary
over time with wind induced foliage movement, as
the branches, twigs and leaves move and sway to the
wind (Sergio et al., 2011). In addition, variations of
the dRET input parameters are directly correlated to
variations observed on the directional spectrum
(Sergio et al., 2011). The extraction of the dRET
input parameters for a single tree is done from its
measured re-radiation pattern. The re-radiation
pattern is the convolution of the tree scatter profile
(phase function) and the receiver antenna pattern.
Although the measured re-radiation pattern differs
from the tree real radiation pattern, due to the
receiver antenna distortion effect, it is considered a
valid approximation of the tree scatter pattern. For
time-invariant conditions, a single averaged re-
radiation pattern is obtained, and an optimum
Gaussian function is fitted against it (Johnson and
Schwering, 1985). However, to ensure the
parameters may be retrieved as a function of time,
I
N
ri
I
I
N
d
I
OUT
ri
I
OUT
d
I
s
Δ
WINSYS2012-InternationalConferenceonWirelessInformationNetworksandSystems
334

multiple re-radiation patterns are recorded over a
period of time, each one corresponding to a specific
time instant. Single Gaussian curves are estimated
for each instant, from which the input parameters are
retrieved, Figure 9. dRET parameters α and σ
S
are
estimated according to the backscatter level; β is
calculated from the Gaussian function HPBW; σ
A
is
estimated from the difference between the phase
function main lobe signal level and the
corresponding line-of-sight level. These parameters
may be expressed as:
)()()( ttt
SAE
σσσ
+=
(1)
()
)(1
)(
2
)(),(
2
)(
2
te
t
ttP
t
α
β
αψ
β
ψ
−+
⎟
⎟
⎠
⎞
⎜
⎜
⎝
⎛
=
⎟
⎟
⎠
⎞
⎜
⎜
⎝
⎛
−
,
(2)
where Ψ is the angle subtended by the input and
output directions, and σ
E
is the extinction
coefficient.
Figure 9: Gaussian phase function.
These parameters may be extracted under
different wind conditions, i.e. wind speeds and
incidences, to be later used in tree formation
simulations under corresponding wind conditions.
Parameters α and σ
S
are particularly sensitive to
any changes in the side scatter level as they are
estimated accordingly from the backscatter level.
Under time-static conditions these parameters are
extracted from an averaged backscatter level.
However, under time-varying conditions, averaging
the backscatter level will decrease both angular and
time variations. Therefore, both parameters are
extracted from a backscatter level estimated for a
single angle of Φ=|90º|, where the recorded signal is
expected to originate from tree scattering alone
(Sergio et al., 2011).
In addition, the discretised intensities, depicted in
Figure 8, expressed in (Didascalou et al., 2000),
used to estimate the output radiation of each cell
may be re-written as a function of time:
00 0
(, ) (, ) () (, )
OUT IN IN
ri ri E ri
It It tIt s
γγσγ
=
−Δ
,
(3)
26
00
'1
(, ) (, ) () (, )
() (,,')(,') (,,)(,)
OUT IN IN
dd Ed
IN IN
SdSri
It It tIt s
tPt It Pt It s
γ
γγσγ
σγγγσγγγ
=
=+− Δ+
+
Δ
⎡⎤
⎣⎦
⎡
⎤
⎢
⎥
⎣
⎦
∑
(4)
where
IN
ri
I
and
OUT
ri
I
are the input, and output
reduced intensities,
IN
d
I
and
OUT
d
I
are the input and
output diffuse intensities, and P represents a discrete
version of the phase function. Thus, the total output
intensity is defined as:
),()(),(),(
00
γγγδγγ
tItItI
OUT
d
OUT
ri
OUT
T
+−=
,
(5)
4 ASSESSMENT OF THE
DYNAMIC MODEL
PERFORMANCE
The tree formation measurement scenario, depicted
in Figure 1 b), was used as a reference for the
assessment of the proposed modelling approach
performance. To this extent, the simulation scenario,
depicted in Figure 10
, enabled a comparison
between resulting modelled data and acquired data,
for different wind incidences. This assessment aims
to investigate the model performance as a function
of: wind incidence and receiver position inside the
forest media.
Figure 10: Simulation geometry of the tree formation
depicted in Figure 1 b).
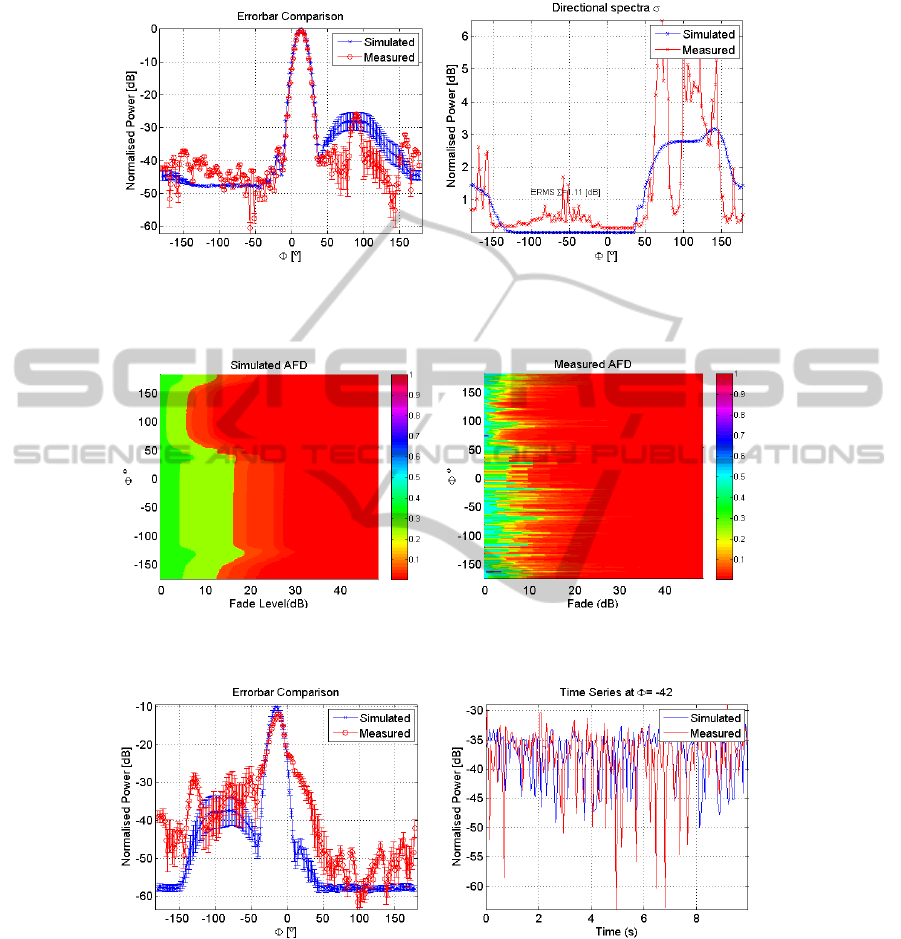
The evaluation between modelled and measured
InvestigationofaRadioPropagationModelforVegetationScatterDynamicChannelsatBFWAFrequencies
335

data is done through the consideration of the
averaged directional spectra and its corresponding
standard deviation. The averaged directional
spectrum depicts the standard deviation information
through the use of an errorbar. Furthermore,
secondary statistic AFD is used to evaluate the
ability of the model to predict deep fades throughout
the bi-static scatter angle. The performance of the
proposed model is quantified by the calculation of
the ERMS (Root-Mean-Square) error, between
simulated and measured data. The ERMS errors are
provided in two ways: ERMS D-S is the averaged
error from directional spectra through time, and
ERMS T-S is the averaged error from time series as
a function of the receiver scatter angle Φ.
The time-varying model input parameters, for the
Ficus tree, were extracted from the measurement set
depicted in Figure 1 a). The parameters were
extracted for a period of 10 seconds, consequently
resulting in a simulation time frame of 10 seconds.
Table 1: Averaged ERMS error statistics.
Rx1
Wind incidence ERMS D-S (dB) ERMS T-S (dB)
B 1.3 4.3
C 2.6 5.3
E 1.6 4.4
F 1.1 4.2
Rx2
B 6.5 8.8
C 4.0 7.3
E 5.7 8.0
F 5.5 8.9
Rx3
B 3.1 7
C 2.9 6.1
E 2.3 6.8
F 2.5 4.8
Rx4
B 7.0 16
C 1.2 8.4
E 1.8 9.1
F 2.8 9.9
The presented results indicate that the model is
able to predict the directional spectra envelope and
its variation with time, with relative agreement. The
simulation results obtained from receiver positions
Rx1 and Rx2 are assessed with more detail. A
comparison between measured and simulated
directional spectra and AFD statistic from Rx1 is
provided in Figure 11 and Figure 12. These results
show that the model is able to provide estimates of
the signal averaged directional spectra standard
deviation, where the envelopes of the measured and
simulated fit accordingly, as observed in Figure 11
a) and b), respectively. In addition, given the wind
incidence from C, the model accurately estimates the
resulting signal variation from trees 2, 3 and 4,
although it tends to underestimate the occurring
magnitude of signal variation (see Figure 11 b)). The
AFD statistics, depicted in Figure 12, show that the
model underestimates the duration of fades in the
order of 1 to 2 seconds, but is able to predict the fade
level magnitude with satisfactory agreement. Similar
behaviour is observed in simulated results obtained
from Rx3, with wind incidence from E, depicted in
Figure 13 and Figure 14. The model estimates the
signal variation originating from trees 3 and 4 with
relative accuracy, in both envelope and magnitude.
Although the duration of simulated fades
underestimate the deep fades observed in measured
data, a comparison between measured and simulated
time series (Figure 13 b)) shows the model is able to
predict, with relative accuracy, time series with
significant variation through time (in the order of
15-20 dB).
A set of averaged ERMS are presented in Table
1, for all wind directions and receiver positions.
Relatively low ERMS D-S and ERMS T-S errors are
observed for all wind incidences and receiver
positions. These results suggest the model performs
with relative agreement when estimating both the
envelope of the directional spectra as well as its time
variation due to wind induced vegetation scatter.
5 CONCLUSIONS
A radio propagation model for dynamic channel
vegetation scatter effects has been investigated as to
its feasibility. In order to understand the foliage
channel behaviour under wind induced effects, a
study has been conducted on single trees and
structured forest medium measurements. Results for
single tree measurements showed that as wind is
blown on to a single tree from a specific direction,
two areas of vegetation motion need to be
considered. One area of the tree, where the wind
incises directly on the foliage (active area), and
another area opposite to the first (quiet area). The
foliage dynamics in the quiet area are observed to be
reduced in comparison to the active area, as a result
of wind speed decay through the vegetation media.
Additionally, when the direction of wind illuminates
the tree canopy in the same direction of the
propagating radio wave, the received signal presents
smaller signal fades and lower signal variation
compared to wind illumination from the receiver
(opposite) side. Furthermore, tree formation results
indicate that change of wind incidence results in a
WINSYS2012-InternationalConferenceonWirelessInformationNetworksandSystems
336

change in measured dynamics in specific angular
regions, depending on the wind direction. The wind
point of source, forest geometry and position of
radio receiver are all intrinsically interrelated and
need to be considered collectively when considering
the modelling methodology.
For this reason the investigated modelling
approach must provide not only insight into radio
propagation physical phenomena in forested
scenarios but also enable geometrical consideration
of the scenario variables. To this extent, modelling
of the dynamic effects in vegetation is done through
the use of the dRET theory because of its ability to
resolve various directional intensities originating
from different directions. The proposed dynamic
model makes use of the dRET time-variant input
parameters properties to predict time-varying scatter
from wind induced vegetation movement. Model
assessment results show that the model tends to
underestimate the time-variation and duration of
signal fades. In spite of this, the presented model is
able to perform with relative agreement when
estimating the directional spectra and time-variation
envelopes, as well as the fade level magnitude.
Further work is expected to encompass the
validation of the investigated model against
measurement data collected in outdoor environment.
REFERENCES
IEEE 802.16 Working Group. [Online] [Cited: May 5,
2011.] http://WirelessMAN.org.
Mehmet, S., Kuran, T. T. and Alagoz, F. 2006. A survey
on emerging broadband wireless access technologies.,
Science Direct.
Meng, Y. S, Lee, Y. H and Ng, B. C. 2009. Study of
propagation loss prediction in forest environment.
Progress in Electromagnetics Research B, Vol. 17.
Violette, E, Espeland, R and Schwering, F. 1985.
Vegetation loss measurements at 9.6, 28.8 and 57.6
GHz through pecan orchard in Texas, Multiple
Scattering of Waves in Random Media and Random
Rough Surfaces.
Schwering, F, Violette, E and Espeland, R. 1988.
Millimeter-wave propagation in vegetation:
Experiments and theory., IEEE Trans. Geoscience and
Remote Sensing, Vol. 26.
Caldeirinha, R. F. S. Radio characterisation of single trees
at micro-and millimetre wave frequencies. s.l. :
University of Glamorgan, 2001. PhD thesis.
Al-Nuaimi, M. O and Hammoudeh, A. M. 14, 1993.
Attenuation functions of microwave signals
propagated through trees. IEE Electronic Letters, Vol.
29.
Naz, N and Falconer, D. D. 2000. Temporal variations
characterisation for fixed wireless at 29.5 GHz. Proc.
IEEE 51st Veh. Technol. Conf.
Kajiwara, A. 9, 2000. Foliage attenuation characteristics
for LMDS radio channel. IEICE Trans. Commun.,
Vols. E83-B.
Perras, S and Bouchard, L. 2002. Fading characteristics of
RF signals due to foliage in frequency bands from 2 to
60 GHz. Proc. 5th Int. Symp. Wireless Personal
Multimedia Commun.
Hashim, M. H and Stavrou, S. 5, 2006. Measurements and
modelling of wind influence on radio wave
propagation through vegetation., IEEE Trans. Wireless
Commun., Vol. 5.
Crosby, D. et al. 2005. Time variability of the foliated
fixed wireless access channel at 3.5 GHz. Proc. IEEE
61st Veh. Technol. Conf.
ITU. Attenuation in Vegetation. ITU-R Recommendation
ITU-R P.833.
Johnson, R. A and Schwering, F.: A transport theory of
millimeter wave propagation in woods and forest.
1985. Tech. Rep. CECOM-TR-85-1.
Meng, Y. S and Lee, Y. H. 2010. Investigation of foliage
effect on modern wireless communication systems: a
review., Progress in Electromagnetics Research, Vol.
105.
Rogers, N. C, et al. A generic model of 1-60 GHz radio
propagation through vegetation - Final report.
Radiocommunications Agency. 2002. Tech. Rep.
Didascalou, D, Yuonis, M and Wiesbeck, W. 2000.
Millimeter-wave scattering and penetration in isolated
vegetation structures., IEEE Transactions on
Geioscience and Remote Sensing, Vol. 38.
Fernandes, T. R. et al. A discrete RET model for micro-
and millimetre wave propagationthrough vegetation.
University of Glamorgan. 2007. PhD thesis.
Morgadinho et al., 2011. Analysis of the dRET input
parameters under varying wind conditions at 20 GHz.
Conftele.
Morgadinho, Sergio, et al. 2011. Investigation of a time-
variant dRET model in vegetation. URSIGASS.
InvestigationofaRadioPropagationModelforVegetationScatterDynamicChannelsatBFWAFrequencies
337
APPENDIX
(a) (b)
Figure 11: Comparison between measured and simulated data from position Rx1, with wind incidence C, considering: a)
directional spectra errorbar and b) directional spectra standard deviation.
(a) (b)
Figure 12: Comparison of data from position Rx1, with wind incidence C, between: a) simulated and b) measured data sets.
(a) (b)
Figure 13: Comparison between measured and simulated data from position Rx2, with wind incidence E, considering: a)
directional spectra errorbar and b) time series at Φ=.
WINSYS2012-InternationalConferenceonWirelessInformationNetworksandSystems
338
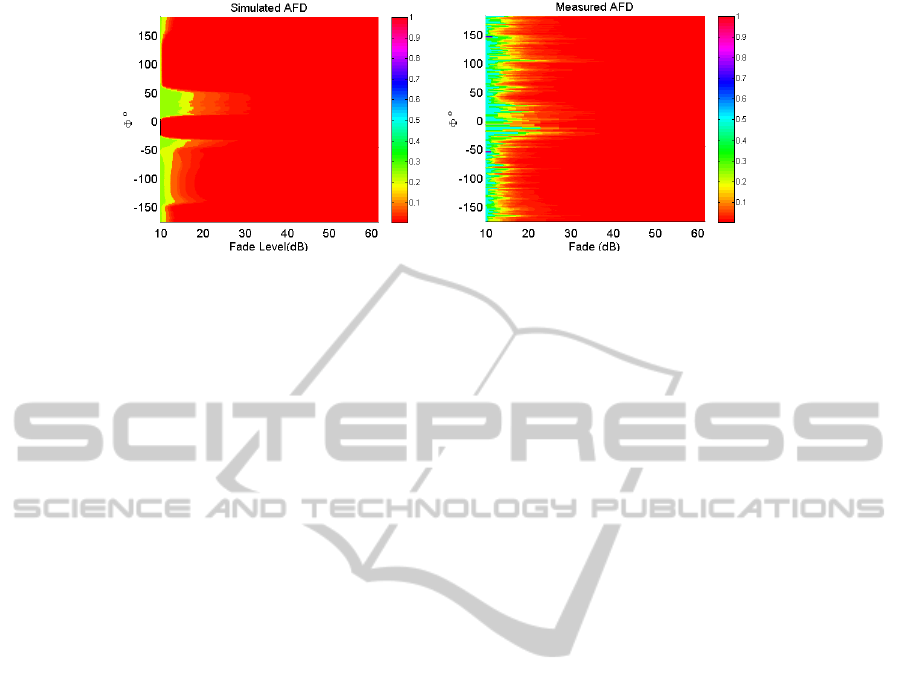
(a) (b)
Figure 14: Comparison of data from position Rx2, with wind incidence E, between: a) simulated and b) measured data sets.
InvestigationofaRadioPropagationModelforVegetationScatterDynamicChannelsatBFWAFrequencies
339
