
IMPROVING COURSE SUCCESS PREDICTION USING ABET
COURSE OUTCOMES AND GRADES
Muzaffer Ege Alper and Zehra C¸ ataltepe
Computer Engineering Department, Istanbul Technical University, Maslak, Istanbul, Turkey
Keywords:
Educational Data Mining, Bayesian Logistic Regression, Feature Selection, Course Grades, ABET Outcomes,
Computer Engineering Education, mRMR (Minimum Redundancy Maximum Relevance), Feature Selection.
Abstract:
Modeling and prediction of student success is a critical task in education. In this paper, we employ machine
learning methods to predict course grade performance of Computer Engineering students. As features, in addi-
tion to the conventional course grades we use fine grained student performance measurements corresponding
to different goals (ABET outcomes) of a course. We observe that, compared to using only previous course
grades, addition of outcome grades can significantly improve the prediction results. Using the trained model
enables interpretation of how different courses affect performance on a specific course in the future. We
think that even more detailed and systematically produced course outcome measurements can be beneficial in
modeling students university performance.
1 INTRODUCTION
A key concept in designing and improving systems is
evaluation. This is even more crucial in the educa-
tional domain, considering the delicacy and “value”
of the subject matter: reproduction of a society’s best
intellectual properties in younger individuals. A pro-
duction error in any typical commodity would have a
finite and foreseeable effect on the society. The con-
sequences of problems in the educational processes,
however, are much harder to predict and may possibly
have much longer lasting effects in the society. De-
spite this, the research on the evaluation of a pipeline
in a car factory is a lot more advanced than the re-
search on the evaluation of educational processes.
Previous research on using machine learning
methodologies for student success modeling and pre-
diction are mostly centered around two tasks. The
first task is the prediction of first grade students’ per-
formances using the student’s available past record
(Rubin, 1980; Butcher and Muth, 1985; Campbell
and McCabe, 1984) . Student performance predic-
tion is important, because correct assessment of a stu-
dent’s capabilities is essential for selecting the right
students for the right university programs. Addition-
ally, this task can also help in early detection of stu-
dents with adaptation problems to University level
education. The second line of research focuses on
web based tutoring systems. Various machine learn-
ing methods (Romero and Ventura, 2010) have been
successfully employed for this task. However, the na-
ture of the problem in online educational services is
quite different than that of formal educational institu-
tions. Most importantly, web based educational ser-
vices store a great variety and amount of data regard-
ing students’ learning activities, such as page visit
logs, interaction logs, forum activities, etc. These fea-
tures can then be “mined” for various goals, leading
to the field called Educational Data Mining. Although
the records of students stored in conventional univer-
sities are much less detailed than web based systems,
accreditation systems for engineering education, such
as ABET, have enabled collection of a lot more data
on both course grades and contents than before.
In this paper, we propose using additional mea-
surements on students to better model students’
course success results. The measurements include
various outcomes defined by course designers. Istan-
bul Technical University, Computer Engineering De-
partment commenced outcome based measurements
of students’ performances in addition to conventional
course grades in 2005. These grades are only infor-
mative and are not used as formal grades, but they
contain valuable information regarding students’ skill
progression.
In this work, we predict student success (uncon-
ditional pass/fail) results in different courses of the
Computer Engineering program of ITU. The course
222
Alper M. and Çataltepe Z..
IMPROVING COURSE SUCCESS PREDICTION USING ABET COURSE OUTCOMES AND GRADES.
DOI: 10.5220/0003922602220229
In Proceedings of the 4th International Conference on Computer Supported Education (CSEDU-2012), pages 222-229
ISBN: 978-989-8565-07-5
Copyright
c
2012 SCITEPRESS (Science and Technology Publications, Lda.)

and outcome grades are used as inputs to our system.
Our method employs Bayesian Logistic Regression
(Genkin et al., 2007) together with minimum Redun-
dancy Maximum Relevance (mRMR) feature selec-
tion algorithm (Peng et al., 2005).
This paper is organized as follows: In Section 2,
previous work on student modeling and performance
prediction are discussed. Section 3 explains the nota-
tion used in this paper and briefly discusses the related
machine learning methods. Section 4 introduces the
proposed method. Various case studies using this ap-
proach are discussed in Section 5. Finally, Section 6
concludes the paper.
2 RELATED WORK
An early paper on student success prediction em-
ployed Bayesian linear regression method (Rubin,
1980). They predicted the success of first grade
law school students based on average high school
grade and LSAT score using a linear regression
model. The Bayesian approach included regularity
constraints that other methods such as least squares
regression lacked. Since then, the goal of predicting
first grade student success using pre-university data
continued to be an attractive subject for various re-
searchers (Butcher and Muth, 1985; Campbell and
McCabe, 1984). In this vein, Felder et. al (Felder
et al., 1993) discussed the important features that cor-
relates strongly with the student grades at first year
courses in Chemical Engineering. Features include
questionaries on learning and studying styles, psycho-
logical profiles, ethnical, economic and educational
background. The paper indicated several features that
significantly correlated with the first year grades.
Another trend of research is the prediction of stu-
dent performances in a single learning task such as
a question in a test (Cetintas et al., 2010; Thai-Nghe
et al., 2010). One important task here is to predict
student success at the first attempt to solve a prob-
lem. There have been considerable advances in this
area, especially after the announcement of the KDD-
10 contest and the associated prize (Pardos and Hef-
fernan, 2011; Yu et al., 2010). Note that the feature
set used in solving this problem is very rich, includ-
ing results from various sub-tasks, related previous
problems, etc. Cetintas et. al. proposed using a tem-
poral collaborative filtering approach to predict stu-
dents’ success on solving specific problems in Intel-
ligent Tutoring Systems (ITS) and showed that this
approach performed better than traditional collabora-
tive filtering methods (Cetintas et al., 2010). Several
top performing methods employed complex features
to predict problem solving results in ITSs, but the re-
sulting systems can be quite complicated, with signif-
icant manual labor involved. Matrix factorization is
another method that is successfully employed in this
problem (Thai-Nghe et al., 2010), which performs on
par with the best methods and is fully automatic so
that it does not depend on manual feature engineer-
ing.
More related to the goal of this work, several pa-
pers focus on predicting student performance, such
as university course drop-outs (Dekker et al., 2009)
and mid-school success/failure (Marquez-Vera et al.,
2011) in formal education. Dekker at.al. used pre-
university and university grades as features to predict
student drop-outs, with accuracies ranging from 70%
to 80%. The problem of predicting middle-school
failure was considered in (Marquez-Vera et al., 2011),
where several different machine learning methods
were discussed with accuracies up to 96%. The data
set for this problem includes features from national
and local questionnaires and previous course grades
of 670 middle-school students from Zacatecas, Mex-
ico.
An important problem in this task is the class
imbalance problem, where the number of succeed-
ing students might be very different than the num-
ber of failing students, which adversely effects the
prediction performance of one class. Previous work
employed data rebalancing schemes (Chawla et al.,
2002; Thai-Nghe et al., 2009) or used unequal costs
for errors of different classes (Thai-Nghe et al., 2009)
to remedy this effect. These schemes result in more
balanced error distributions and confusion matrices,
but no significant increase in overall accuracy has
been reported.
3 BACKGROUND
In this section, we introduce the dataset, notation, the
classifier and the feature selection method used in this
paper.
3.1 Program Evaluation using
Outcomes
Outcome based education is a new paradigm, which
has become a standard for ABET accredited univer-
sities. The complete list of outcomes suggested by
ABET includes 13 outcomes. We collected data on
three of them:
a: an ability to apply knowledge of mathematics,
science, and engineering,
IMPROVINGCOURSESUCCESSPREDICTIONUSINGABETCOURSEOUTCOMESANDGRADES
223

c: an ability to design a system, component, or
process to meet desired needs,
h: an ability to communicate effectively.
Computer Engineering Department of Istanbul
Technical University significantly modified its ap-
proach for the assessment of program outcomes in
Spring 2005. First, the specific outcomes related to
each course were determined. Three of these out-
comes were selected for more comprehensive eval-
uation, these are outcomes a, c and h given above.
The faculty were asked to assign specific problems,
projects and exam questions that were designed to di-
rectly measure the abilities of individual students with
regard to a specific outcome. For six years, at the
end of each term, the faculty submitted the normal-
ized grades obtained from the related items contribut-
ing to an outcome together with the definition of these
items. To assist in the evaluation and storage of these
data, a program called POMAS was developed (Ok-
tug, 2007). Results from these evaluations allow as-
sessment of the performance of each student with re-
spect to not only overall course performance, but also
with respect to particular skills. In this paper, we use
the POMAS data and overall course grades to predict
student course success.
3.2 Notation
In this work, we assume that we are given both
course grades and ABET outcomes for a group of
students and our task is to predict student success on
courses. This success corresponds to whether the stu-
dent passed a course unconditionally, having a grade
“CC” or better.
Assume that we have M courses, (c
1
,c
2
,...,c
M
),
in the dataset. Each course c
i
is offered in
a semester, t(c
i
) ∈ [1,8]. Features correspond-
ing to a student s in a course c
i
are g
o
(s,c
i
) ∈
{1,0}, o ∈ {a,c,h}, corresponding to the outcomes
of the courses and g
c
(s,c
i
) ∈ {1,0}. 1 denotes
pass and 0 denotes fail. The condition for pass
or fail for courses is to have an overall grade
greater than “CC” (the set of original grades is
{AA,BA,BB,CB,CC,DC,DD,FF,V F}). The condi-
tion for pass/fail in outcome grades is to have an out-
come grade greater than the average outcome grade
of the course. It has been noticed that these bin-
ning schemes improve the prediction accuracy signif-
icantly when compared to using the unbinned [0,100]
range or using a finer binning strategy.
The problem, then, is to estimate g
c
(.,.) for a
given course and all students taking (or are about to
take) that course. Formally, we would like to estimate
the g
c
(s,c
i
) with the distribution:
g
c
(s,c
i
) ∼ p(x|g
c
(s,c
i
),g
o
(s,c
i
))
where
g
c
(s,c
i
) = (g
c
(s,c
i
1
),g
c
(s,c
i
2
),...,g
c
(s,c
i
N
),...)
T
g
o
(s,c
i
) = (g
o
(s,c
i
1
),g
o
(s,c
i
2
),...,g
o
(s,c
i
N
),...)
T
for all j ∈ [1, M] such that,
t(c
i
j
) < t(c
i
)
3.3 Logistic Regression
Logistic regression is a very popular and successful
method used both in statistics and machine learning
(Hosmer and Lemeshow, 2000). In this method, we
use a model of the form:
p(g
c
(s,c
i
)|β,g
c
(s,c
i
)) = Ψ(β
T
g
c
(s,c
i
))
to model binary class values p(g
c
(s,c
i
)) of s. Here
Ψ(.) is the logistic link function:
Ψ(x) =
exp(x)
1 + exp(x)
The simplest form of logistic regression employs
Least Squares method to minimize the square error:
∑
s
(g
c
(s,c
i
) − ˆg
c
(s,c
i
))
2
Where ˆg
c
(s,c
i
) is the estimated and g
c
(s,c
i
) is the ac-
tual success variable. However, such an approach suf-
fers from several problems. The first and the most
crucial is the overfitting behaviour, which is most
visible in sparse datasets. Another problem is the
“Bouncing β” problem, where the estimated param-
eters change significantly with slight modifications in
the dataset (Hosmer and Lemeshow, 2000). Finally,
if some of the feature vectors are (almost) linearly
dependent, the least squares solution may be numer-
ically unstable. Thus, regularization methods, such
as ridge regression or Bayesian Logistic Regression
are neccessary. Ridge regression solves the aforemen-
tioned problems by minimizing the regularized error
function:
∑
s
(g
c
(s,c
i
) − ˆg
c
(s,c
i
))
2
+ λ(||β||
2
)
The problem in this approach is to select the right
λ, a since too small λ would not regularize the sys-
tem, while a too large value would negatively effect
the classification performance. Conventionally, λ is
heuristically chosen to satisfy both criteria.
On the other hand, Bayesian Logistic Regression
(Genkin et al., 2007) tackles this issue in a more prin-
cipled way, where prior distributions on model param-
eters β are used to regularize these variables and avoid
CSEDU2012-4thInternationalConferenceonComputerSupportedEducation
224

overfitting. The model parameters are MAP (Maxi-
mum A-Posteriori) estimated.
In this work, we have chosen Gaussian priors for
the model parameters. Using these priors, the log pos-
terior density of model parameters β becomes (ignor-
ing normalizing constant and constant terms):
L(β|D) = −
∑
s
ln(1 + exp(g
c
(s,c
i
)β
T
g
c
(s,c
i
))) −
∑
j
β
2
j
2σ
In the above expression, σ is the standard devia-
tion for the Gaussian prior and D is the dataset. This
variance is selected using the norm-based heuristic
(Genkin et al., 2007):
σ
2
=
d
∑
i
||x
i
||
2
where, d is the number of features (after feature se-
lection) and x
i
is the ith feature vector. The MAP esti-
mation proceeds by using a type of Newton-Raphson
method as described in (Genkin et al., 2007). In this
paper, we use Bayesian Logistic Regression and com-
pare it to simple Logistic Regression and other classi-
fication methods.
3.4 Feature Selection Method
Another method to improve a classifier’s general-
ization is to select a subset of informative features
(Guyon and Elisseeff, 2003). The minimum Re-
dundancy Maximum Relevance (mRMR (Peng et al.,
2005)) method relies on the intuitive criteria for fea-
ture selection which states that the best feature set
should give as much information regarding the class
variable as possible while at the same time minimize
inter-variable dependency as much as possible (i.e.
avoid redundancy). The natural measure of relevance
and redundancy in the language of information the-
ory is the mutual information function. However,
real data observed in various problems are usually too
sparse to correctly estimate the joint probability distri-
bution and consequently the full mutual information
function. The solution proposed in (Peng et al., 2005),
employs two different measures for redundancy (Red)
and relevance (Rel):
Red = 1/|S|
2
∑
F
i
,F
j
∈S
MI(F
i
,F
j
)
Rel = 1/|S|
∑
F
i
∈S
MI(F
i
,R)
In the expressions above, S is the (sub-)set of fea-
tures of interest, MI(.,.) is the mutual information
function, R is the class variable and F
i
is the random
variable corresponding to the ith feature. Then the
goal of mRMR is to select a feature set S that is as rel-
evant (max(Rel)) and as non redundant (min(Red)) as
possible. In the original work (Peng et al., 2005), two
criteria to combine Rel and Red were proposed. In
this work, the criterion of Mutual Information Differ-
ence (MID = Rel − Red) is used, because it is known
to be more stable than the other proposed criterion
(MIQ = Rel/Red) (Gulgezen et al., 2009).
4 METHOD
In this work, the final grades and the outcome grades
(for a, c and h) of students during years 2005 to 2011
were collected. The courses for which the final grades
were collected are shown in Table 1. The courses
considered in POMAS evaluation and the related out-
comes are listed in Table 2. Some of the courses given
in the program were left out due to the sparseness of
the associated data. There were some courses with
outcome grades available but with no course grade
data, thus some of the courses in Table 2 were not
included in this work. Table 3 shows information on
the three fourth year courses, namely, Software En-
gineering (SE), Ethics of Informatics (EI) and Intro.
to Expert Systems (ES) for which we predict student
success. We chose fourth year courses, because the
number of courses prior to them, and hence the num-
ber of available features are more for these courses.
Software Engineering is offered in 7th semester while
Expert Systems and Ethics of Informatics courses are
offered in the 8th semester, so the number of previous
outcome and course grades are fewer for Software En-
gineering prediction.
The data are passed to the classifier only after a
feature selection process. This feature selection pro-
cess can be seen both as a step to improve general-
ization capability of the particular classifier and also
a step to decrease the computational complexity. The
output of the feature selection method employed in
this paper, mRMR, consists of an ordered list of fea-
tures together with the feature scores. These scores
are the Rel − Red values (see Section 3.4). The se-
lected features of the available data are then used to
train the classifier parameters.
A number of different classifiers, namely, Naive
Bayes, Multilayer Perceptron, SVM with Radial Ba-
sis Function kernel and Logistic Regression can be
employed for classification.
5 RESULTS
In this section, we report results on different aspects
IMPROVINGCOURSESUCCESSPREDICTIONUSINGABETCOURSEOUTCOMESANDGRADES
225

Table 1: The courses of ITU Computer Engineering considered in this work.
Year 1 Year 2 Year 3 Year 4
Discrete Mathematics Microprocessor Systems Operating Systems Software Engineering
Data Structures Computer Architecture Ethics of Informatics
Computer Organization Real Time Systems Intro. to Expert Systems
Digital Circuits Microcomputer Laboratory Graduation Thesis
Logic Circuits Laboratory Database Management Systems Advanced Programming
Analysis of Algorithms Digital Signal Proc. Lab.
Advanced Data Structures Discrete Event Simulation
Table 2: Related outcomes for courses in POMAS system.
Outcome a Outcome c Outcome h
Data Structures Microprocessor Systems Software Engineering
Analysis of Algorithms Computer Organization Ethics of Informatics
Formal Languages and Automata Computer Architecture English
Artificial Intelligence Database Systems Turkish
Discrete Event Simulation Software Engineering Data Structures
Signals and Systems Computer Projects - I Computer Projects - I
Graduation Project Graduation Project Graduation Project
Analysis of Algorithms Microprocessor Lab.
Advanced Data Structures Advanced Data Structures
Table 3: The datasets used in the experiments.
Course Previous Course Grades Previous Outcome Grades num. of instances
Software Engineering 13 9 307
Ethics of Informatics 17 13 481
Intro. to Expert Systems 17 13 298
of the proposed model using three different courses as
test cases. We predict whether students have satisfac-
torily passed (overall grade being greater than CC )
the course. The courses considered are Software En-
gineering (SE), Introduction to Expert Systems (ES)
and Ethics of Informatics (EI). In all of the cases,
only the course and outcome grades given for courses
taught before the predicted course are used. Some of
the methods used in this paper are employed using
Weka Java libraries (Hall et al., 2009) using default
set of parmeters. The results reported in this section
are the 10-fold cross validation accuracies using the
set of mRMR selected features with the best classifi-
cation accuracy. The folds in all of the tests are the
same. In addition to this, 95% significance intervals
are also reported.
5.1 Evaluation of Different Machine
Learning Methods
Table 4 shows the accuracies obtained using dif-
ferent machine learning methods for the three dif-
ferent fourth year courses. These experiments use
mRMR selected features including course and out-
come grades.
It should be noted that some methods perform bet-
ter in specific tasks, but poorly in others (Naive Bayes,
SVM). It is also observed that both Logistic Regres-
sion methods provide satisfactory and homogenous
prediction accuracy accross the different prediction
tasks and the classical logistic regression is very close
to Bayesian Logistic Regression in accuracy. How-
ever, as mentioned in Section 3.3, Bayesian Logis-
tic Regression has various desirable properties other
than having a good classification accuracy. The main
advantage is due the constraint on the norm of the β
parameters, effectively eliminating the “bouncing β”
problem and enabling better comparison of these pa-
rameters among different courses. This property is
important, since one of our goals is to employ these
coefficients to better understand course dependencies.
5.2 Prediction with and without
Outcomes
In this section, we perform a detailed analysis of
classification using grades with/without outcomes and
with/without employing mRMR feature selection.
Table 5 summarizes the main findings for the
three different courses we examine in this paper us-
CSEDU2012-4thInternationalConferenceonComputerSupportedEducation
226
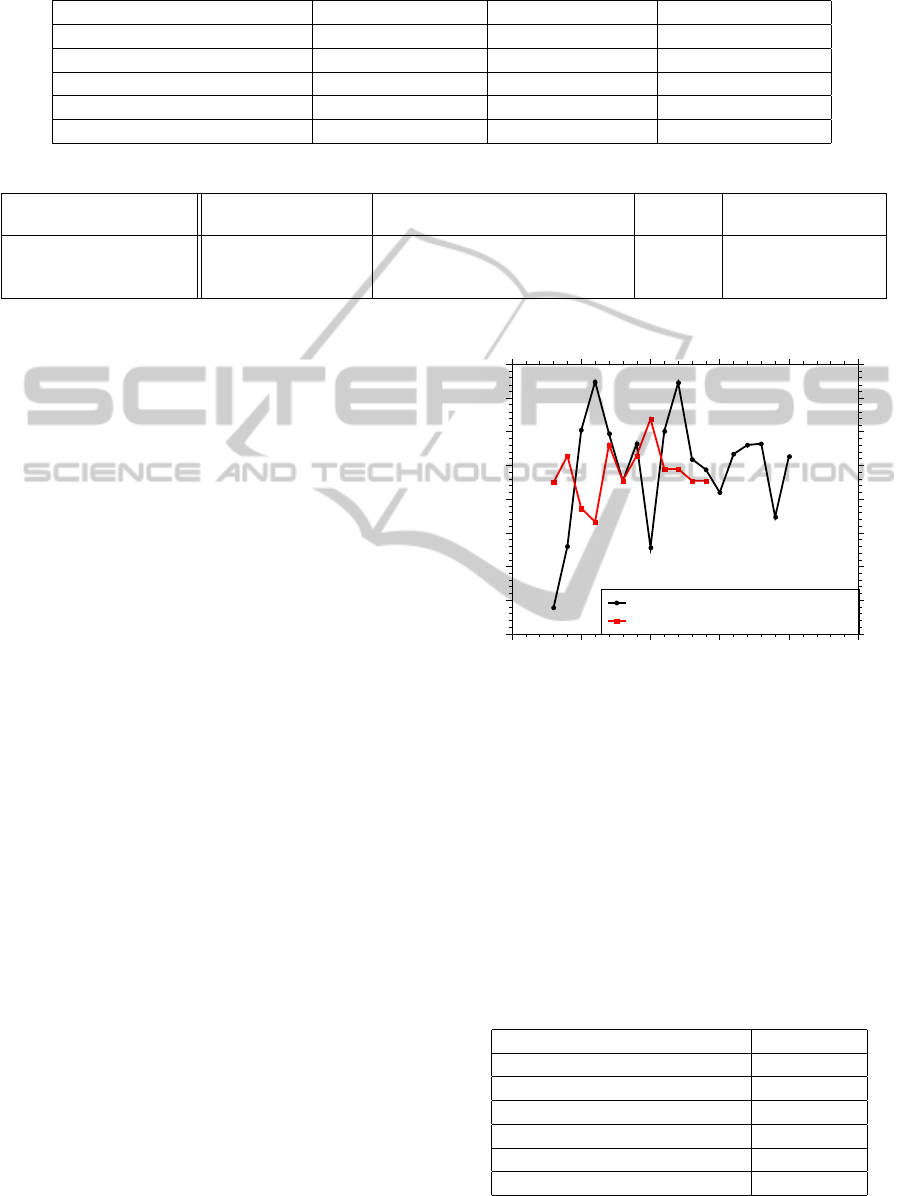
Table 4: Accuracy of different machine learning methods on three sample problems.
Methods Test Accuracy(SE) Test Accuracy(EI) Test Accuracy(ES)
Naive Bayes 79.03 ± 5.62 73.18 ± 4.32 80.56 ± 3.35
Multilayer Perceptron 72.66 ± 5.71 71.62 ± 3.88 79.23 ± 3.00
SVM (RBF kernel) 78.67 ± 3.73 74.27 ± 5.95 74.14 ± 0.91
Logistic Regression 77.49 ± 3.74 75.60 ± 4.49 81.39 ± 6.49
Bayesian Logistic Regression 77.49 ± 4.06 75.34 ± 5.00 82.57 ± 5.75
Table 5: Accuracy results.
Course Grades + mRMR (1) Grades + Outcomes + mRMR (2) p-value Grades + Outcomes
(1) vs (2)
Software Engineering 76.38 ± 4.60 77.49 ± 4.06 0.5451 76.76 ± 3.97
Ethics of Informatics 69.52 ± 4.87 75.34 ± 5.00 0.1248 72.44 ± 5.13
Intro. to Expert Systems 75.43 ± 2.31 82.57 ± 5.75 0.0171 80.39 ± 6.46
ing Bayesian Logistic Regression classifier. First of
all in all of the cases, addition of outcome grades im-
proves the results. The statistical significance of this
improvement varies, but the improvement in accuracy
is consistent. The significance of the differences in
performances using only grades to using both grades
and outcomes as features are also indicated using p-
value from the pairwise t-test on folds of cross vali-
dation. An important observation is that the addition
of outcome features also increase variance in some
cases as seen from the wider confidence intervals.
This is mainly due to the non-stationary nature of the
outcome grading process, which may not always be
consistent in time and accross different lecturers for
the same courses. This result is also important, since
it expresses the importance of a methodological ap-
proach in grading outcomes.
Furthermore, using mRMR consistently improves
the prediction accuracy. The effect of different num-
ber of features on the grade prediction accuracy can
be seen in Figures 1, 2 and 3. These figures show
the average accuracies over 10 folds obtained using
the mRMR selected features for different number of
features. Bayesian Logistic Regression was used for
all three figures. As shown in the figures, using out-
comes in addition to the courses results in an accuracy
increase for all three courses. For EI and ES, the accu-
racy improvement is significant. For courses SE and
EI, the number of features needed for the best classi-
fication accuracy is very small (6 and 7 respectively).
On the other hand, more features are required for ES
(14).
Another nice benefit of feature selection is the
consequent ease of interpreting the results. Logis-
tic regression model enables inspection of contribu-
tion of each feature on classification results based on
weights (β
i
) corresponding to each feature. In Tables
6, 7 and 8, we show the average Bayesian Logistic
Regression classifier weights for the some of the most
Software Engineering Prediction Accuracy
Accuracy
70
71
72
73
74
75
76
77
78
70
71
72
73
74
75
76
77
78
Number of Features Selected
0 5 10 15 20 25
0 5 10 15 20 25
Course and Outcome Grades
Only Course Grades
Figure 1: The impact of the number of features selected on
system’s performance for course Software Engineering.
significant weights. For each fold, for the number of
features that resulted in the best average test accuracy
(SE: 6, EI: 7, ES: 14), we noted the features and the
corresponding weights of the Bayesian Logistic Re-
gression classifier. We then reported the average of
the associated weights for each feature together with
95% confidence interval. Notice that if course predic-
tion was performed for all the courses, these weights
could be used to come up with a pre-requisites graph.
Table 6: Related Course and Outcome Grades to uncondi-
tional pass/fail prediction of Software Engineering.
Grades Coefficient
Computer Architecture 1.16 ± 0.05
Analysis of Algorithms 0.80 ± 0.21
Formal Lang. and Auto. 0.72 ± 0.30
Computer Organization 0.70 ± 0.08
Computer Operating Systems 0.67 ± 0.27
Logic Circuits Lab. 0.61 ± 0.38
IMPROVINGCOURSESUCCESSPREDICTIONUSINGABETCOURSEOUTCOMESANDGRADES
227
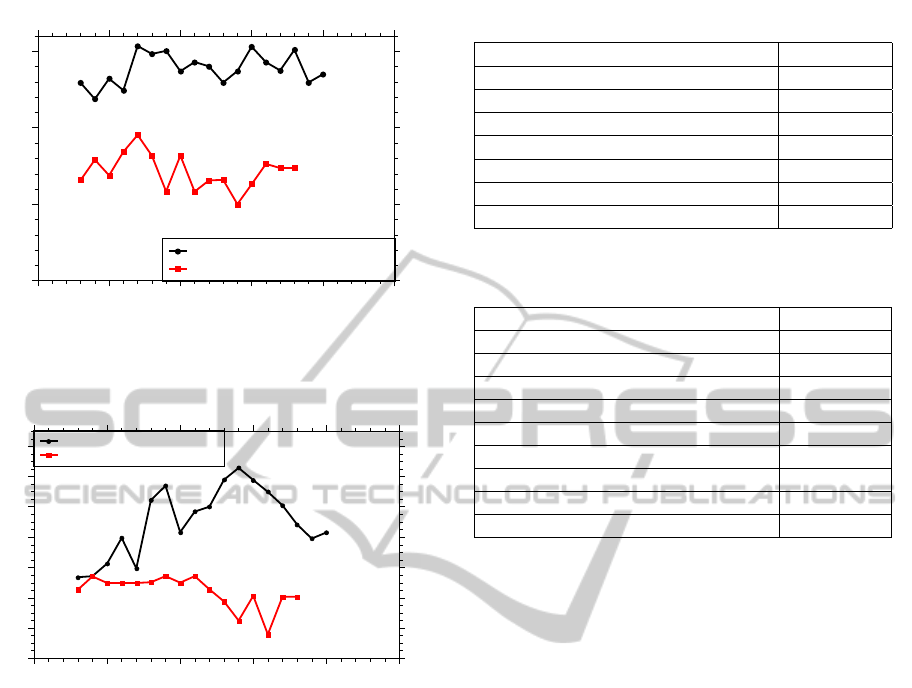
Ethics of Informatics Prediction Accuracy
Accuracy
60
65
70
75
60
65
70
75
Number of Features Selected
0 5 10 15 20 25
0 5 10 15 20 25
Course and Outcome Grades
Only Course Grades
Figure 2: The impact of the number of features selected on
system’s performance for course Ethics of Informatics.
Expert Systems Prediction Accuracy
Accuracy
70
72
74
76
78
80
82
84
70
72
74
76
78
80
82
84
Number of Features Selected
0 5 10 15 20 25
0 5 10 15 20 25
Course and Outcome Grades
Only Course Grades
Figure 3: The impact of the number of features selected
on system’s performance for course Introduction to Expert
Systems.
6 CONCLUSIONS AND FUTURE
WORK
The idea of outcome based assessment has been em-
ployed in Computer Engineering program of Istanbul
Technical University since 2005. The first results of
this undertaking have been the enriched descriptive
statistics regarding the education in the program (Ok-
tug, 2007), consequently the faculty were able to see
detailed reports on the overall distribution of students
skills. In this work, we take the second step, where the
students’ success in courses are modeled using these
data. In this work we have clearly shown the util-
ity of these measurements in improving student suc-
cess modeling. We have also discussed the descrip-
tive value of related findings, such as discovering cor-
relations among different skills measured in courses.
These findings should be encouraging for universities
Table 7: Related Course and Outcome Grades to uncondi-
tional pass/fail prediction of Ethics of Informatics.
Grades Coefficient
Computer Project -I 2.35 ± 0.11
Computer Architecture / Outcome c 1.20 ± 0.31
Microprocessor Systems 0.99 ± 0.06
Software Engineering 0.62 ± 0.05
Artificial Intelligence / Outcome a 0.52 ± 0.53
Computer Operating Systems 0.40 ± 0.09
Discrete Event Sim. 0.21 ± 0.33
Table 8: Related Course and Outcome Grades to uncondi-
tional pass/fail prediction of Intro. to Expert Systems.
Grades Coefficient
Analysis of Algorithms / Outcome a 2.18 ± 0.07
Logic Circuits Lab. 1.24 ± 0.48
Database Management Systems 1.23 ± 0.15
Software Engineering 1.06 ± 0.14
Computer Architecture / Outcome c 0.95 ± 0.10
Real Time Systems / Outcome c 0.95 ± 0.13
Discrete Event Sim. 0.88 ± 0.08
Microprocessor Systems 0.71 ± 0.11
Computer Organization 0.70 ± 0.18
to devise new ways to measure the students’ skill pro-
gression. Computer Science and technologies can be
beneficial not only for e-learning domain but also con-
ventional education domain.
The proposed method would be helpful in cur-
riculum design, by providing an objective measure
for course grade interdependencies. Determination
of course prerequisites is one task that would benefit
from the proposed method. It would also be interest-
ing to see whether the prediction results would also be
useful to the lecturers in better assisting the “critical”
students early.
The outcomes as described by ABET provide an
overall picture of related skills for an engineering stu-
dent. However, tracking students’ performance in
a more detailed way would certainly give better re-
sults. This problem has been handled in the e-learning
community by methods called “Knowledge Tracing”
(Corbett and Anderson, 1994). We believe that a simi-
lar approach in conventional education domain is also
possible and as hinted in this work, would be most
beneficial. Therefore, as part of our future work, we
plan to devise methods of finding “critical learning
activities” or concepts and the associated grades using
available data such as curriculum information, course
resources, homeworks, etc.
CSEDU2012-4thInternationalConferenceonComputerSupportedEducation
228

ACKNOWLEDGEMENTS
The authors would like to thank current and previous
members of the Program Improvement Commitee S.
Oktug, M. Gokmen, S. S. Talay N. Erdogan and B.
Kantarci for their support.
REFERENCES
Butcher, D. F. and Muth, W. A. (1985). Predicting per-
formance in an introductory computer science course.
Commun. ACM, 28:263–268.
Campbell, P. F. and McCabe, G. P. (1984). Predicting
the success of freshmen in a computer science major.
Commun. ACM, 27:1108–1113.
Cetintas, S., Si, L., Xin, Y. P., and Hord, C. (2010). Pre-
dicting correctness of problem solving in its with a
temporal collaborative filtering approach. Intelligent
Tutoring Systems, 6094:15–24.
Chawla, N. V., Bowyer, K. W., Hall, L. O., and Kegelmeyer,
W. P. (2002). Smote: Synthetic minority over-
sampling technique. Journal of Artificial Intelligence
Research, 16:321–357.
Corbett, A. T. and Anderson, J. R. (1994). Knowledge trac-
ing: Modeling the acquisition of procedural knowl-
edge. User Modeling and User-Adapted Interaction,
4:253–278. 10.1007/BF01099821.
Dekker, G., Pechenizkiy, M., and Vleeshouwers, J. (2009).
Predicting students drop out: A case study. In
EDM’09, pages 41–50.
Felder, R. M., Engineering, D. O. C., Mohr, P. H., Engi-
neering, C. O., and Dietz, E. J. (1993). A longitudinal
study of engineering student performance and reten-
tion. i. success and failure in the introductory course.
J. Engr. Education, pages 15–21.
Genkin, A., Lewis, D. D., and Madigan, D. (2007). Large-
scale bayesian logistic regression for text categoriza-
tion. Technometrics, 49(3):291–304.
Gulgezen, G., Cataltepe, Z., and Yu, L. (2009). Stable
and Accurate Feature Selection. In Buntine, W., Gro-
belnik, M., Mladeni
´
c, D., and Shawe-Taylor, J., edi-
tors, Machine Learning and Knowledge Discovery in
Databases, volume 5781, chapter 47, pages 455–468.
Springer Berlin Heidelberg, Berlin, Heidelberg.
Guyon, I. and Elisseeff, A. (2003). An introduction to
variable and feature selection. J. Mach. Learn. Res.,
3:1157–1182.
Hall, M., Frank, E., Holmes, G., Pfahringer, B., Reutemann,
P., and Witten, I. (2009). The weka data mining soft-
ware: An update. SIGKDD Explorations, 11(1).
Hosmer, D. and Lemeshow, S. (2000). Applied logistic re-
gression. Wiley series in probability and statistics:
Texts and references section. Wiley.
Marquez-Vera, C., Romero, C., and Ventura, S. (2011). Pre-
dicting school failure using data mining. In Pech-
enizkiy, M., Calders, T., Conati, C., Ventura, S.,
Romero, C., and Stamper, J. C., editors, EDM, pages
271–276. www.educationaldatamining.org.
Oktug, S. (2007). Assessment of program outcomes by us-
ing pomas. In Proc. of International Conference on
Engineering Education2007, Coimbra, Portugal.
Pardos, Z. A. and Heffernan, N. T. (2011). Using hmms and
bagged decision trees to leverage rich features of user
and skill from an intelligent tutoring system dataset.
Science, (2010).
Peng, H., Long, F., and Ding, C. (2005). Feature se-
lection based on mutual information criteria of max-
dependency, max-relevance, and min-redundancy.
Pattern Analysis and Machine Intelligence, IEEE
Transactions on, 27(8):1226 –1238.
Romero, C. and Ventura, S. (2010). Educational data min-
ing: A review of the state of the art. Systems, Man,
and Cybernetics, Part C: Applications and Reviews,
IEEE Transactions on, 40(6):601 –618.
Rubin, D. B. (1980). Using empirical bayes techniques in
the law school validity studies. Journal of the Ameri-
can Statistical Association, 75(372):pp. 801–816.
Thai-Nghe, N., Busche, A., and Schmidt-Thieme, L.
(2009). Improving academic performance prediction
by dealing with class imbalance. In Intelligent Sys-
tems Design and Applications, 2009. ISDA ’09. Ninth
International Conference on, pages 878 –883.
Thai-Nghe, N., Drumond, L., Krohn-Grimberghe, A., and
Schmidt-Thieme, L. (2010). Recommender system
for predicting student performance. Procedia Com-
puter Science, 1(2):2811–2819.
Vapnik, V. (2000). The nature of statistical learning the-
ory. Statistics for engineering and information sci-
ence. Springer.
Yu, H.-F., Lo, H.-Y., Hsieh, H.-P., Lou, J.-K., Mckenzie,
T. G., Chang, P. T., Po, C., Wang, C.-Y., Huang, Y.-H.,
Ruan, Y.-X., and et al. (2010). Feature engineering
and classifier ensemble for kdd cup 2010. Science,
pages 1–12.
IMPROVINGCOURSESUCCESSPREDICTIONUSINGABETCOURSEOUTCOMESANDGRADES
229
