
Localized Electroencephalography Sensor
and Detection of Evoked Potentials
Tiago Ara
´
ujo
1
, Neuza Nunes
2
, Carla Quint
˜
ao
1
and Hugo Gamboa
1
1
CEFITEC, Physics Department, New University of Lisbon, 2829-516, Caparica, Portugal
2
PLUX - Wireless Biosignals, S.A., Av. 5 de Outubro nr.70 6th, 1050-059, Lisbon, Portugal
Abstract. The limitations of current electroencephalographs are unanimous and
relate primarily to its low spatial density and assembly complexity for certain
applications. In this paper, we introduce an innovative technique, capable to an-
swer to some challenges created by those limitations. A localized, miniaturized
and user-friendly electroencephalography (EEG) sensor was developed for signal
acquisition in a bipolar montage, to be placed anywhere on the scalp. The low
consumption, small size and high spatial resolution, compared with the standard
systems, are the main features of the EEG sensor presented. With this sensor we
acquired and analyzed spontaneous EEG activity and auditory evoked potentials
which are relevant for the cognitive activity analysis. The developed sensor is an
important unobtrusive tool for applications of mental health evaluation.
1 Introduction
Electroencephalography (EEG) is a clinical tool with high functional relevance in the
diagnosis of various diseases. Despite its wide use and good temporal resolution, the
EEG has some clinical and research limitations comparing to other techniques. Its lim-
itations are unanimous and relate often to low density spatial records and the sheer
assembly complexity for certain applications (typically 19 electrodes over the scalp),
which causes a lengthly experiment preparation and a discomfort to the subject.
Various solutions in order to overcome those technical limitations have been ex-
plored, like the study of high density EEG [1][2] and the EEG integration with different
acquisition techniques, such as the EEG-fRMN [3], however non of those solutions an-
swer to the lack of ergonomics in current systems and there are vast applications for
which a smaller and localized tool would be useful.
The EEG is typically described in terms of rhythmic or spontaneous activity, which
is composed by rhythms which refer to the subject’s condition, and transients or evoked
potentials that reflects the brain response to a stimulus.
An evoked potential is an electrical potential recorded from the nervous system af-
ter a stimulus. After the application of a stimulus, a specific neuron population activates
simultaneously or sequentially, creating evoked potentials that can be measured at the
scalp. Evoked potentials amplitudes tend to be low comparing to spontaneous poten-
tials, ranging from less than a microvolt to a few microvolts [4][5]. To resolve these
Araújo T., Nunes N., Quintão C. and Gamboa H..
Localized Electroencephalography Sensor and Detection of Evoked Potentials.
DOI: 10.5220/0003891300410046
In Proceedings of the 2nd International Workshop on Computing Paradigms for Mental Health (MindCare-2012), pages 41-46
ISBN: 978-989-8425-92-8
Copyright
c
2012 SCITEPRESS (Science and Technology Publications, Lda.)

low-amplitude potentials, the stimulus should be repeated 50 to 200 times and a sig-
nal averaging should be performed. This procedure distinguishes the evoked potentials
from the noise provoked by the spontaneous potentials which are stimulus independent
[6].
The depolarization of a stimuli response can be positive (e.g. P300) or negative
(e.g. N200) and with varied latency. The potentials are gradually more complex with
the increasing latency from stimulus to response. Therefore, the potentials with small
latency rely on the physiological perception of stimuli while components with bigger
latency essentially depend on cognitive mechanisms like attention or expectation. The
P300 wave, for example, links mainly to the stimulus classification, while the N200
wave associates with perception and discrimination of a stimulus [7].
In this paper we introduce an innovative technique, capable to answer to some chal-
lenges created by the limitations of current electroencephalographs. A localized, minia-
turized and user-friendly EEG sensor was developed for signal acquisition in a bipolar
montage anywhere on the scalp. The developed sensor was used to collect and ana-
lyze EEG auditory evoked potentials. The acquisition of evoked potentials allowed us
to visualize and study stimuli such as N100, N200 and P300, relevant markers for the
analysis of cognitive activity.
The low consumption, small size and higher spatial resolution, compared with the
standard systems, represents a solution of high applicability in unobtrusive long-term
cognitive activity monitoring.
2 Localized EEG Development
In this section we describe the steps of the EEG sensor design and development, point-
ing its main characteristics.
2.1 Electronics
The EEG sensor has three channels of acquisition and the signal of each channel is
acquired by two electrodes assembled in a differential configuration which measure the
electrical activity at two nearby points of the cortex. As the signal variation between two
points tend to zero with the proximity, a high amplification is needed for this sensor. Our
sensor has a total gain of 40000, which is four times superior to the gain of common
electroencephalographs, leading to a high sensitivity in the signal acquisition. This high
sensitivity requires an efficient filter chain.
The EEG sensor circuit has three amplification and two filter levels as shown in
Figure 1.
The first amplification stage has a small filtering step to remove the high frequency
noise at the acquisition entrance. This is a radio frequency interference filter (RFI) with
a cut frequency superior to the remainder circuit’s bandwidth. The low-pass and high-
pass filters cancel the high frequency noise and emphasize the frequency band of inter-
est. The cut frequencies of each filter are 0,79Hz (high-pass) and 48,22Hz (low-pass),
which are the standard values for the EEG signal’s bandwidth. Each filter has a real
pole in the cut frequency which gives an attenuation of -3dB for decade. As we have
42
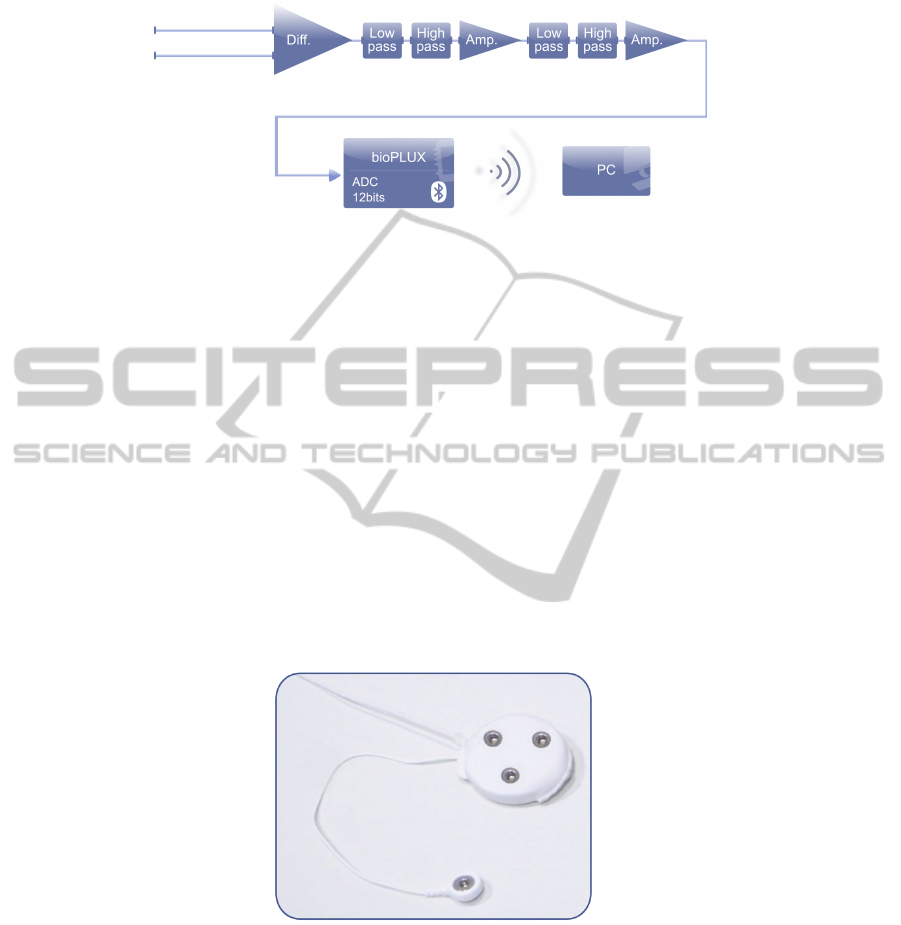
Fig. 1. Circuit of one channels of the EEG sensor.
two high-pass and two low-pass filters, the poles are duple, so the real attenuation is
-6dB in relation to the maximum for the two cut frequencies.
The final version of the EEG sensor is a closed loop of three acquisition channels,
in which each channel is the circuit described above (and presented in Figure 1).
2.2 Characteristics of the Sensor
The EEG analog to digital conversion and Bluetooth transmission to the computer was
performed using a bioPLUX research [8] signal acquisition system, which has a 12 bit
ADC and a sampling frequency of 1000 Hz.
The circuit was encapsulated in a structure designed to support all the electronic and
enable the contact of the scalp, containing three conductive electrodes. The developed
sensor is portable and miniaturized, with 43mm of diameter and 50g of weight. An
illustrative photograph of the developed sensor is presented in Figure 2.
The standard procedure for this sensor is to use Ag/AgCl pre-gelled electrodes and
a band strap over the sensor to enable an appropriate setting and contact with the scalp.
The ground electrode sticked to a bone surface, behing the ear.
Fig. 2. Photograph of the localized EEG sensor.
3 Acquisition of Evoked Potentials
This section describes the procedure used to induce the evoked potentials and the pro-
cessing tools needed to visualize those potentials.
43

3.1 Firmware
The auditory stimuli was generated by a microcontroller which synchronized the sig-
nal acquisition with the stimuli application (through headphones), marking the stimuli
occurrence in the collected EEG signal. Those markers were different to each stimulus.
The infrequent stimulus had a sound frequency of 1900Hz and the frequent stimulus
900Hz. Both stimuli had an intensity of 81dB and last for 50ms. The stimulus type and
frequency are based on a distribution of pseudo-random numbers. The infrequent stim-
uli occur with 15 % of probability, following an uniform distribution of 100 numbers,
and the time between stimuli also follows an uniform distribution between 1100ms and
1400ms, to raise the expectation level of the subject.
3.2 Methods
EEG data was recorded from a healthy volunteer with no history of hearing, neurolog-
ical, learning or stress problems. The subject was sitting in a relaxed state in a quiet
environment with minimum distracting elements. The subject was equipped with head-
phones in mono configuration which received auditory stimuli from the microcontroller
and was asked to count the rare sounds that appeared in a series of frequent sounds.
The EEG sensor was positioned at the left occipital region of the head, located
near the F3 electrode of the 10-20 EEG standard system [9]. We used AgCl pre-gelled
disposable dry detection surfaces fixed with an elastic band strap.
3.3 Signal Processing
After the acquisition procedure, we used Python to visualize and process the EEG data.
As the evoked potentials amplitudes tend to be low, a signal processing code was devel-
oped to enhance the evoked potentials over the other EEG tracings. The first step was to
go through the signal and find the markers left by the microcontroller after a stimulus.
The 800ms following the position defined by the marker were saved as infrequent or
frequent values, depending on the marker left by the microcontroller.
This process was repeated to each stimulus and the average of each frequent and
infrequent vectors was computed.
4 Results
Figure 3 presents the results obtained for 3 tests performed on the subject, who remained
with his eyes closed.
In figure 3 a) (first test) we can identify the N200/P300 complex in the infrequent
stimuli graphic. This complex begins with a negative depolarization near 200ms, fol-
lowed by a positive component near 300ms. The noise present in the infrequent stim-
uli is due to the low repetition rate (19 times). In figure 3 b) is also noticeable the
N200/P300 complex in the infrequent records, with a noise level smaller due to the
higher number of stimuli. In the third test (figure 3 c) ) the component P300 appears
with much less intensity. The N200 component is still visible in the infrequent waves
graphic.
44
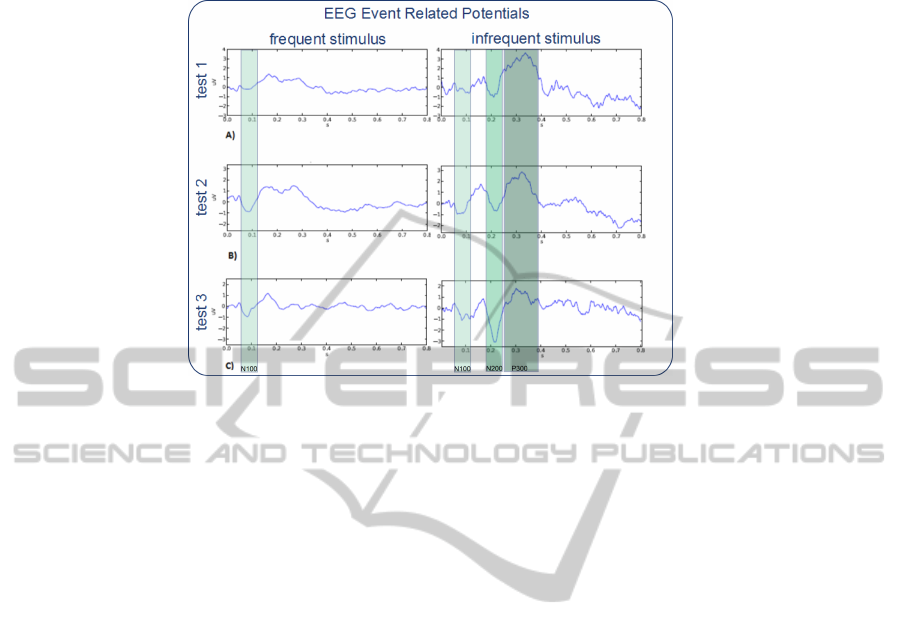
Fig. 3. Subject’s Evoked Potentials: a) first test with 19 infrequent and 751 frequent stimuli; b)
second test with 51 infrequent and 1187 frequent stimuli; c) third test with 25 infrequent and
1132 frequent stimuli.
The N100 complex is also noticeable specially in the frequent responses, although
with less definition.
5 Discussion and Conclusions
The N100 potential appears with low definition in all tests, which can be explained for
the position where the sensor was placed. The F3 site favors the acquisition of N200
and P300 potentials and attenuates the N100 components. The N200/P300 complex
emerges in all tests, but in the third the N200 component is much more pronounced than
the P300. That happens because in the third test the subject was already accustomed to
the task and was performing the test with less expectation than the first times - hence
the distinctness of N200 which associates with sound perception over the P300 which
mingle with attention and expectations. The habituation factor decreases the impact of
the test than when done for the first time.
A prototype version of this sensor was previously presented with the detection of
EEG alpha rhythm and processment of its latency [10]. The acquisition of evoked po-
tentials, because of its low amplitude values, represents a more effective valitation to
evaluate the high sensibility of the sensor. The development procedure denoted a high
efficiency level for this sensor, in accordance with the user-friendly, signal quality and
ergonomics requirements, taking into account that the results were achieved directly
with the raw signals without any filtering process.
A sensor with this specifications has high applicability in various scenarios, since it
could allow to record huge amounts of data related to everyday and ambient assisted liv-
ing activities. This sensor could also be meaningful for analysis of sleep disorders, as a
45

sensor like this has minimum influence to the patients sleep given its ergonomics char-
acteristics. Another possible application is the monitoring of epileptic seizures, since
these appear uniformly through the brain and its signal can be acquired in any point of
the scalp. In a more futuristic view, we can affirm that a localized sensor like the one we
present can contribute in areas like brain computer interfaces (BCI). In this field is con-
venient to monitor a specific brain structure and associate it to an interface control, so
our sensor represents a big contribution through its localized acquisition characteristics.
Future Work
In future steps of this project we intend explore and validate the sensor’s capacity to
map the cerebral activity.
In order to further reduce external noise, we intend to eliminate the cables that
connect the conditioning circuit to the scan and transmission circuit, integrating both
components inside the same physical packaging.
We also intend to raise the channels number in the same area of the sensor.
References
1. Lantz, G. (2003): Epileptic source localization with high density EEG: how many electrodes
are needed? Official Journal of the International Federation of Clinical Neurophysiology,
Vol. 114(1), 63–69.
2. Reynolds, G., Richards, J. (2009): Cortical source localization of infant cognition. Develop-
mental Neuropsychology, Vol. 34(3), 312–329.
3. Mulert, C., Lemieux, L. (2010): EEG - fMRI: Physiological Basis, Technique and Applica-
tions. Springer-Verlag, 1st edition.
4. Sanei,S., Chambers, J. (2007): EEG Signal Processing. Wiley-Blackwell, 1st edition.
5. Blinowska, K., Durka, P. (2006): Electroencephalography (EEG). Wiley Encyclopedia of
Biomedical Engineering, 1st edition.
6. Quintao, C. (2006): Apontamentos de Fisica Medica. Faculdade de Ciencias e Tecnologia da
Universidade do Algarve, 91–106.
7. Rugg, M., Coles, M. (1995): Electrophysiology of mind: event related brain potentials and
cognition. Oxford Psychology Series, 1st edition.
8. PLUX (2011): PLUX - Wireless Biosignals, S.A. Online: www.plux.info
9. Teplan, M. (2002): Fundamentals of EEG measurement. In measurement Science Review,
Vol. 2, Sec. 2.
10. Araujo, T. (2010): Alpha rhythm onset detector based on localized EEG sensor. In Proceed-
ings of 7th ESBME - European Symposium on Biomedical Engineering, Chalkidiki, Greece.
46
