
Cough Sound Acoustics and Environmental Agents in
Modern Swine Farming
S. Ferrari
1
, A. Costa
1
, C. Gusmara
2
, V. Sala
2
and M. Guarino
1
1
University of Milan, VSA, Faculty of Veterinary Medicine
Via Celoria, 10-20133 Milano, Italy
2
University of Milan, DIPAV, Faculty of Veterinary Medicine
Via Celoria, 10-20133 Milano, Italy
Abstract. Cough sound analysis has been performed in this research for fat-
tening swine respiratory disease assessments. In particular, here are investigat-
ed the abiotic environmental factors predisposing animals to diseases. From
cough sound recording during 4 fattening cycles it has been possible to evaluate
the dynamics both of respiratory diseases and of cough sounds. The bioacoustic
analysis investigated features like sound duration, amplitude and frequency and
it has been combined with environmental recordings of temperature, relative
humidity, gaseous ammonia and particulate matter concentrations. A serologi-
cal screening has been also performed to evaluate the animal’s non specific
immunity, useful to evaluate how farming conditions may affect animals wel-
fare and health. The correlations of all parameters allowed estimation of the
weight of every factor on the type of respiratory disease and estimation of
which are useful acoustics parameters to be monitored for early diagnosis of
respiratory hazards.
1 Introduction
In intensive swine farming conditions respiratory disease outbreaks are often linked
to housing conditions, environmental predisposing factors and etiologic agents. All
these actors make it a multifactor diseases that require punctual observation both on
the sanitary and environmental levels. The extremely high number of animals in
farms is associated to an increase of diffusible pathologies and to a more difficult
controlled environment. Temperature, relative humidity, air ventilation, airborne dust
and gaseous pollutants severely affect the respiratory systems of animals. Epidemio-
logic studies, in the past, had underlined how gaseous ammonia and airborn dust act
as a irritative agents and may accumulate in the mucus of respiratory mucosa increas-
ing nasal mucosa lesions and pneumonia incidence which allows insediation of sec-
ondary opportunists agents [1], [2].
Other studies about climate influences shows a higher respiratory diseases inci-
dence in wintertime confirmed by slaughterhouse lung scoring. the animals reared in
such season suffer ventilation deficiency and show major lung lesions. On the other
side a too high ventilation rate generates cold air flows at animal’s level affecting
Ferrari S., Costa A., Gusmara C., Sala V. and Guarino M..
Cough Sound Acoustics and Environmental Agents in Modern Swine Farming.
DOI: 10.5220/0003886400300039
In Proceedings of the International Workshop on Veterinary Biosignals and Biodevices (VBB-2012), pages 30-39
ISBN: 978-989-8425-94-2
Copyright
c
2012 SCITEPRESS (Science and Technology Publications, Lda.)

their immune system. Humans can’t quantify a continuous observation of animal’s
health and its relation with environment and abiotic disease causes, and respiratory
disease control and prevention are largely realized by drugs administration.
This work aims to show a different integrated approach for respiratory disease di-
agnosis using bioacoustics as a precision livestock farming continuous monitoring
tool together with environmental and sanitary control. Sound analysis has been wide-
ly researched and applied in swine and dairy calves farms showing how different
cough sounds can be associated to certain type of diseases [3], [4], [5], how cough
sounds have different acoustic features compared to other environmental or animal
vocalizations and how, for this reasons, they may be used as diagnostic tool [6], [7],
[8]. We propose in this paper how cough sound recordings and analysis might allow
detection of respiratory disease linked with climate parameters, particulate matter,
ammonia concentrations and non-specific immunity parameters [9], [10]. The integra-
tion between the studied parameters is useful to understand the environmental causes
of respiratory diseases and the acoustics of coughs they generate. This knowledge is
important for a better approach to the disease improving management and avoiding
unuseful drug approach to diseases and to understand how better environment leads
to healthier animals.
2 Materials and Methods
Acoustic and environmental data were collected in Italians swine farming along the
seven months of 4 fattening cycles (30-175 kg). All farms showed similar building
structures for fattening pigs which were reared on fully slatted concrete floor in mul-
tiple boxes 3,5x7m. Two of the cycles (a and b) were breed in mechanically ventilat-
ed compartments while the other two (c and d) in naturally ventilated piggeries.
2.1 Sound Recordings
Sounds were collected once a week during the whole period (6/7 months) of each
fattening cycle. Directional microphones were hanged 1.5 m over the pens to cover
the surface of two adjacent boxes. Microphones were connected to a laptop and re-
cordings were supported by Adobe Audition®. The sampling rate was 44.1 KHz,
suitable for vocal sounds recordings, and the signals were converted in digital formats
(.Wav). Each recording was run for 30 minutes a week and the data were stored on an
external hard disk via the pc unit.
2.2 Sound Labeling and Analysis
The audio file playbacks were run in a specifically home designed labeling tool to
extract and classify individual sounds on the basis of the amplitude of the sound sig-
nal. The system recognizes the sound’s energy envelopes, which are indicators of the
place where the signals energies are concentrated. When the energy envelope exceeds
31
an automatically selected, environment specific threshold, the corresponding sound is
selected. After having completed the sound extraction, the individual sounds were
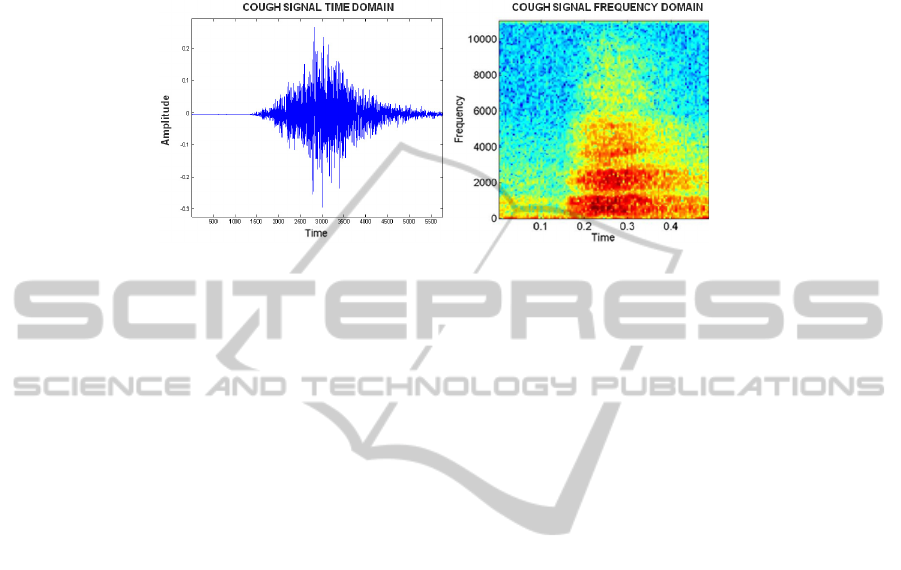
manually labelled to select only cough sounds (figure 1) that will be further analyzed.
Fig. 1. Pig cough sound wave in time and frequency domain.
The subsequent sound analysis aimed to investigate coughs acoustics features like
duration, fundamental frequency, peak frequency and amplitude (Ferrari et al.,
2008b). The duration of a sound is defined by an analysis of signal time-series start-
ing from the point in which the sound wave suddenly increases in amplitude until it
decreases back to the silence state. The frequency of a sound signal has been studied
in terms of its Fundamental Frequency (f0), which is the lowest frequency, or har-
monics produced by any particular sound source (Gerhard, 2003) and in terms of
peak frequency to keep higher values of energy in within frequency levels.
For the amplitude analysis the Root Mean Square (RMS) is applied. This parame-
ter reflects the fraction of the time in which the signal amplitude is near to its maxi-
mum. The ratio between coughs number and minutes of recordings has been also
calculated (C/min where C=coughs). For the signal processing we used a homemade
program based on Matlab 7.1® to extract sounds characteristics and draw a fast de-
scriptive statistics about the trends of the analyzed sounds.
2.3 Environmental Measures and Air Quality
Temperature and relative humidity were recorded inside the fattening compartments,
simultaneously with recordings periods, by air probes portable datalogger. The pa-
rameters were collected spot at animal’s level to have a more correct recording of the
animals feelings and the marked temperature was based on a four spots measurements
average. Air quality was assesses by measuring airborn dust in terms of Particulate
matter concentrations (PM
10
) and gaseous ammonia concentrations. PM
10
were moni-
tored 30 minutes a week by a dust sampler based on combined light scattering
nephelometer and filter gravimetric air sampler (Haz Dust-Epam 5000) that allows
dust measurements in (mg/m³). For the ammonia sampling the portable Dräger Chip
Measurement System was used for spot gas measurements in the pens at floor and
animal’s level. The device combines an electronic based analyzer with substance
specific chips capillaries filled with a specific reagent for ammonia. All the environ-
mental samplings both microclimate and air quality data, were collected once a week.
32

2.4 Sanitary Measurements: Non-specific Immune Response
In this research we monitored non-specific factors associated to animal’s adaptations
to intensive farming conditions as indicators of stress.
The complement system is a group of proteins that when activated lead to target cell
lysis and facilitates phagocytosis through opsonisation. The CH50 is a screening
assay for the activation of the classical complement pathway. If a complement com-
ponent is absent, the CH50 level will be zero; if one or more components of the clas-
sical pathway are decreased, the CH50 will be decreased and this happens in cases of
stress or diseases. Serum Lysozyme (LYS) is part of the innate system that damage
bacterial cell walls by catalyzing hydrolysis over peptidoglycans (found in the cell
walls of bacteria, especially Gram-positive bacteria). Its concentrations has been
assessed by Fluorimetric assays which is capable of detecting enzyme activity in
concentrations down to 1 μg/ml. Serum bactericidal activity (SBA) has been also
tested by traditional microtiter assay.
2.5 Statistic Analysis
All data collected were submitted to Variance Analysis and to Pearson correlation
(SAS 9.2, 2011) to estimate the effects of environmental conditions on respiratory
disease in pigs. Analysis of Variance was done to analyze relations of number and
acoustics characteristics of coughs with environmental parameters and air quality
(T°C, RH, ventilation rates, NH
3
e PM
10
). The results of this analysis were discrimi-
nated according to period of the cycle, season, cycle and typology of farm and the
number of coughs per minute were transformed in classes (tab.1).
Table 1. Class grouping of number of coughs recorded per minute.
From (C/min) To (C/min) Class
0 0.5 1
0.5 1 2
1 1.5 3
1.5 2 4
… … …
A further variance analysis was performed by dividing data coming from different
piggery buildings (mechanical ventilation in cycles a and b and natural ventilation
for cycles c and d). Further data correlation was assessed by performing a Pearson
correlation procedure over the whole dataset to weight the effect of environment on
cough acoustics and animal health.
3 Results
3.1 Sound Analysis
2500 minutes of audio tracks have been collected during the 4 followed fattening
33
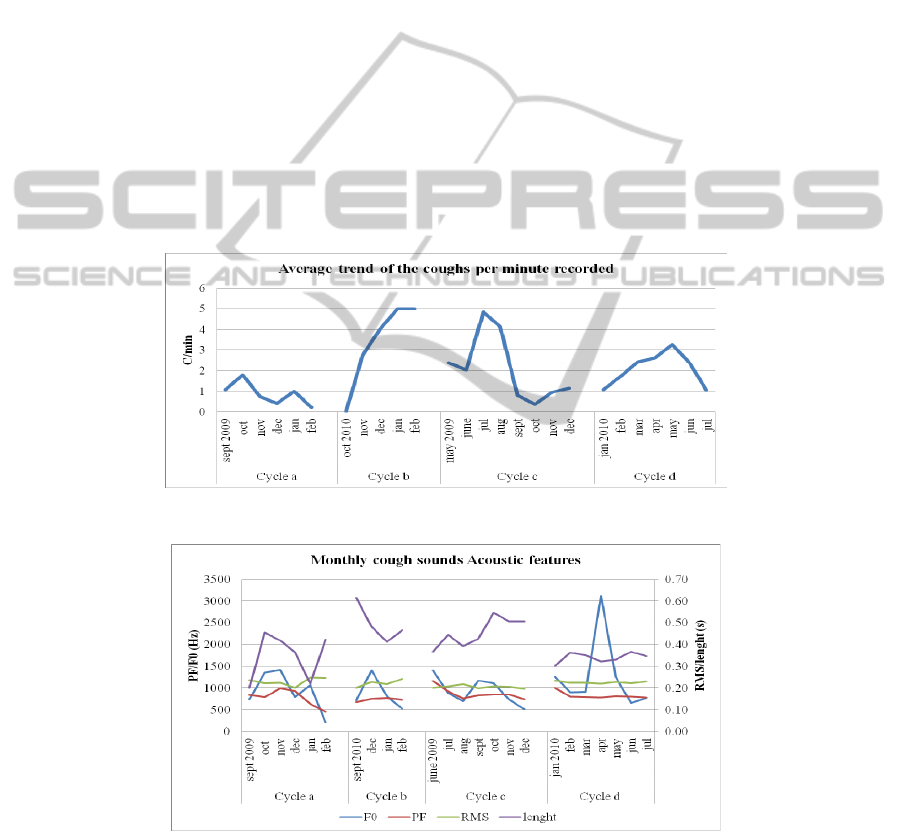
cycles. The labeling procedure allowed the extraction of more than 1800 coughs (av-
erage of 450 coughs per cycle with min 180 coughs in cycle a and max 570 in cycle
b) (figure 2). The analysis of the acoustic features has been performed over the entire
database and the results were grouped per months of the fattening cycles. The results
were used in a comparative way from the statistic analysis nevertheless the qualitative
analysis of the cough sounds showed some very clear distinction regarding each of
the acoustic characteristics (figure 3)
Sound duration showed higher values in cycle b (0,49s) and cycle c (0,46s) while
the lower trend were measured in cycle d (0.31s); large length variations were meas-
ured in cycle a (0,35s± 0,11).
Sound RMS showed no variations among the cycles and among the months in
each cycle. On average this features measured 0,21± 0,011. For Peak Frequency
higher values were recorded in cycle c (1445Hz ±79) and lower values in cycle a
(776Hz ±200). In each of the four cycles the peak frequency decreased according to
the increase of age and weight of the animal. Fundamental Frequency recorded outlier
peaks in cycle d (3000Hz over an average of 1000 Hz). Large variation was measured
for this parameter in all the cycles investigated demonstrated also by the high SD
from the average (a: 931Hz ±454; b: 866Hz± 378; c: 1003Hz±276; d: 1354Hz± 898).
Fig. 2. Average trend of the coughs recorded for the four fattening cycles.
Fig. 3. Trend of the acoustics characteristics studied over the coughs database.
34
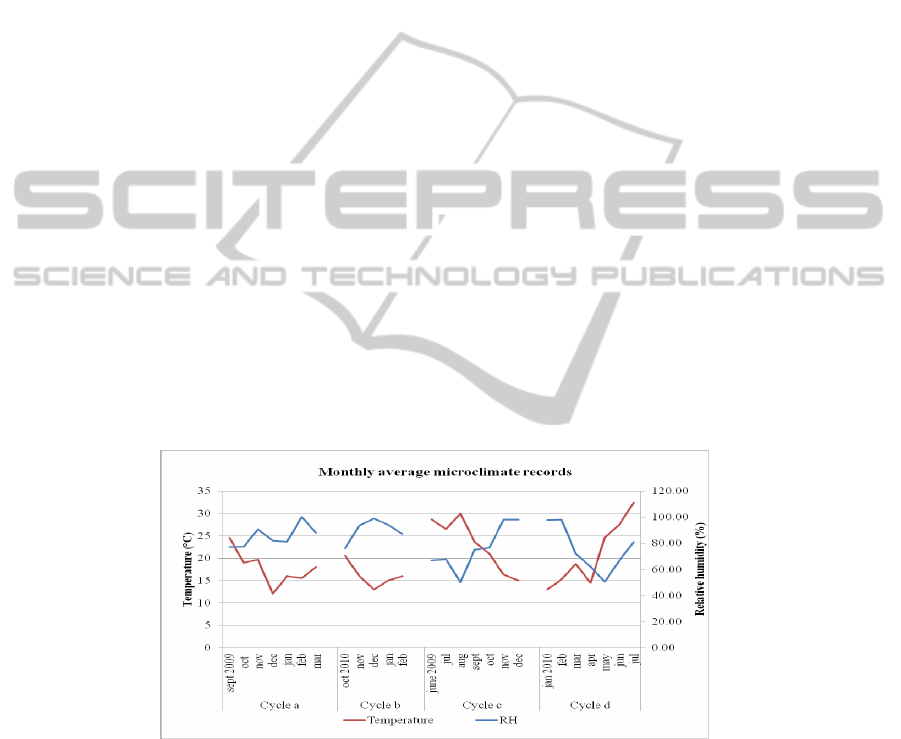
3.2 Environmental Measures and Air Quality (Figure 4 and 5).
Cycle a: this cycle was performed from September 2009 to March 2010. The average
monthly temperature recorded ranged from 18 to 25 °C with minimum peaks of 12 °
C recorded in December. Relative humidity ranged between 60 and 80% and the
average ventilation rate was 17.907 m
3
/h, min. 5.027 and max 30.692. Particulate
matter concentrations (PM
10
mg/m
3
) and ammonia concentrations (NH
3
, ppm) meas-
ured at animal’s level showed values included between 0,06 and 1,19 mg/m
3
and
between 6 e 15 ppm respectively.
Cycle b: this cycle was performed from October 2010 to February 2011. The records
showed typical season trends except for a relative humidity outlier that measured
98%. The average ventilation rate was 21.000 m
3
/h, min. 16.800 m
3
/h and max.
25.200. In the beginning of the cycle monthly ammonia concentrations averaged
9ppm but reached 27 ppm in February 2011. PM
10
concentrations were always inferi-
or to 0,6 mg/m
3
, showing higher peaks in November.
Cycle c: in this naturally ventilated building microclimate recordings showed similar
trends as of external climate. August temperatures reached 30 °C while decreased in
winter seasons to a minimum of 15 °C in December. Make up air values were on average
2,6 m/s, min 0,2 m/s and max 5 m/s. Particulate matter concentrations (PM
10
, mg/m
3
) and
ammonia concentrations (NH
3
, ppm) measured at animal’s level showed values included
between 0,21 and 0,49 mg/m
3
and between 5.25 and 20 ppm respectively.
Cycle d: from January to July 2010. During the month of May 2010 relative humidity
showed a critical trend by decreasing until 40%. Make up air values were on average
1,26 m/s, min 0,2 m/s and max 2,7 m/s. Particulate matter concentrations (PM
10
,
mg/m
3
) showed maximum records in March 0,44 mg/m
3
. Ammonia concentrations
(NH
3
, ppm) measured at animal’s level showed values included between 4 and 23
ppm with higher values recorded during the first two months of the cycle.
Fig. 4. Trends of the microclimate parameters studied during the four cycles.
3.3 Non-specific Immunity (Tab. 2)
Cycle a: the CH50 level was found to be low from the beginning of the trial and to
further decrease along the months of fattening cycle. This shows animal’s stress to-
35

wards livestock conditions. On the other side the higher values of SBA showed posi-
tive effective reaction of pigs’ immune systems to infections even thought continually
exposed to respiratory pathogens, as confirmed by the increase of serum lysozyme
concentration.
Cycle b: lower CH50 and SBA levels have also been found in this cycle showing
how the intensive swine farming environment is stressful and adversely affects their
immune system. The severe animal’s exposition to pathogens is also confirmed, espe-
cially for the 1
st
phase of the fattening cycle, by higher values of serum lysozyme.
Cycle c: the CH50 values were low. SBA were constant along the 2/3 of the cycle
except for an increasing trend in the last phase. Also the lysozyme concentration was
very high along the whole period showing how stress may interfere with local im-
mune reactivity.
Cycle d: this cycle showed the best sanitary and environmental status of animals.
CH50 values increased along the screening period showing animal adaptation and
comfort in relation to the better environment. In this farm animals had also lower
serum lysozyme values and higher SBA showing a minor stress from pathogens ex-
position.
Table 2. Serum non specific immunity assessment among the four cycles.
Cycle sampling CH 50/100 mcl SBA LYS (u/ml)
a
T1 38,17 67,40 % 84,27
T 2 35,38 75,46% 123,87
T 3 28,96 69,32 % N.D.
b
T 2 35,40 64,42% 124,69
T 3 17,69 59,25% 85,84
c
T1 25,17 63,63% 196,81
T2 32,80 67,42% 117,55
T3 26,14 80,20% 167,41
d
T1 30,62 62,47% 147,83
T2 73,06 27,58% 102,35
T3 72,28 31,60% 138,71
3.4 Statistical Analysis
From the statistic analysis, over 10000 datasets were collected during the 4 cycles.
The number of coughs every 30 minute, expressed in C/min classes, was positively
influenced by the grouping of relatively acceptable environmental parameters.
Variance analysis performed over the dataset collected in all the swine cycle
showed:
- Fundamental frequency (F0) seasonal variation (P < 0.01) being averagely
higher in summer periods.
- Fundamental frequency (F0) positive variation among increased C/min (P < 0.05).
- Peak frequency (PF) does not show significant differences nor variations
among seasons and cycles (P = 0.68).
36

- Single cough sounds length is influenced by seasonal changes (P < 0.05) be-
ing shorter in wintertime.
- The number of C/min is strictly linked to ammonia concentrations (P <
0.05).
- Higher number of C/min when PM
10
< 59 mg/m
3
- Higher number of C/min when
NH
3
ranged from 7 to 20 ppm.
Considering the two main typologies of buildings and the different environment:
a) In mechanically ventilated buildings:
- Higher serum lysozyme concentrations at lower temperatures (P < 0.05).
- Higher serum lysozyme concentrations at higher ammonia concentrations (P
< 0.01).
- Lower CH50 concentrations at higher ammonia concentrations (P <0.01).
- Higher PM
10
and NH
3
concentration at lower air make ups (P <0.01).
- Higher serum lysozyme concentrations at higher PM
10
(P < 0.01).
- Lower SBA at higher PM
10
and NH
3
concentrations (P < 0.05).
b) In naturally ventilated buildings:
- Higher serum Lysozyme concentrations at lower temperatures (P < 0.001).
- - Lower SBA at lower temperatures (P < 0.01).
- - Higher serum Lysozyme concentrations at higher relative humidity (P < 0.05).
- - Higher length of coughs at lower relative (P < 0.01).
- - Higher serum Lysozyme concentrations at higher PM10 (P < 0.05).
- - PM10 >550 µg/m3 increases C/min(> 4) (P < 0.05).
- - NH3 <7 ppm limited number of coughs (C/min < 2) (P < 0.05).
- - Higher NH3 > 20 ppm increase the number of C/min(P < 0.05).
- - Higher NH3 > 20 ppm inhibit cough mechanism (C/min < 2) (P < 0.01).
The results from Pearson correlation explain:
- Increased C/min in cycle b (+ 63 %, P < 0.01) for higher PM
10
and lower
ventilation rates.
- Increase C/min is positively associated to increase of NH
3
(< 20ppm) (+ 76
%, P < 0.001).
- Increase C/min is positively associated to increase of serum Lysozyme (+ 64
%, P < 0.01).
- Length of cough < 0,41s positively associated with increase of Lysozyme
and decrease of SBA.
- Length of cough <0,31s positively associated to environmental stress (e.g.
NH
3
) (P < 0.05).
- Increase of animals’ age corresponds to increase of sound duration (+ 19 %,
P < 0.001).
- Increase of NH
3
concentrations shorter cough sound length.(-14 %, P <0.01)
- Increase of NH
3
concentrations increases the fundamental frequency (+
16.%, P < 0.05).
- Increase of animals’ age corresponds to decrease of the peak frequency.
- Increase of animals’ age corresponds to decrease of fundamental frequency.
- Increase of animals’ age corresponds to decrease of number of coughs rec-
orded in 30 min.
37

4 Discussion and Conclusions
Cough sounds quantity and quality can be influenced by environmental factors in
different ways: dust, ammonia levels, temperature and HR act on the respiratory sys-
tem modifying the structures involved in cough generation. Interesting finding of this
study is the potential of sound analysis to distinguish, from the length of cough
sounds, abiotic or biotic causes as demonstrated from the statistic analysis which
recognizes in longer cough signals an etiologic involvement. Here also, the conse-
quences of ammonia and dust on the respiratory system are investigated and the effect
of rare lung clearance capacity, due ammonia exposure, is confirmed by the decrease
of the number of coughs per minute over 20ppm and from sounds shorter duration
indicating reaction failure of the respiratory system.
The study confirms with scientific objective signs (like C/min) that environmental
problems and ventilation rates are also very important for animal’s health status since
we observed the increase of coughs in presence of low temperature or bad air quality
and the increase of serum Lysozyme and decrease of CH50 and SBA that show dis-
tress in animals and deficiency in their immune systems. From this evaluation glances
the importance of how good maintenance of healthy environment may prevent and
reduce the amount of respiratory diseases and how sound analysis may give us a
precise instrument to monitor continually health status from the counting and analysis
of cough sounds signals. The results of this study showed that the proved integrated
diagnostic method, could be efficiently used by farmers, as an early warning of the
presence of environmental predisposing factors of respiratory disease. By using a set
of microphones the whole farm area will be easily scanned for respiratory diseases in
a non invasive way, the system will be included of the cough recognition algorithm
and of sound filtering systems e.g. bandstop to avoid ventilation sounds disturbances.
The information collected about the biotic or abiotic nature of coughs will be im-
portant for correct health interpretations, treatment avoiding, reducing expensive
medical costs and improving piggeries environment management. In the same way,
the combination of bioacoustics with sanitary screenings like bacteriology or specific
immunity would complete the diagnosis, identifying the major etiological agents of
disease. Bioacoustics integrated method helped to get more knowledge of the major
factors involved in intensive swine farming respiratory diseases.
Aknowledgements
This work has been founded by the Italian Ministry of University and Research (MIUR)
in the project “Integrazione di Sistemi tecnologici innovatvi per il monitoraggio a
distanza di animali” belonging to National Interest research programs (PRIN 2008).
38

References
1. Urbain, B., Gustin, P., Charlier, G., Coignoul, F., Lambotte, J. L., Grignon, G., Foliguet,
B., Vidic, B., Beerens, D., Prouvost, J. F. and Ansay, M.: A morphometric and functional
study of the toxicity of atmospheric ammonia in the extrathoracic airways in pigs. Vet. Res.
Commun. (1996, a) 20, 381–399.
2. Urbain, B., Provoust, J. F., Beerens, D., Michel, O., Nicks, B., Ansay, M., Gustin, P.:
Chronic exposure of pigs to airborne dust and endotoxins in an environmental chamber:
technical note. Vet. Res. Commun. (1996, b) 27, 569–578.
3. Ferrari S., Silva M., Guarino M., Berckmans D.: Analysis OF Cough Sounds for Diagnosis
of Respiratory infections in Intensive Pig Farming. Transaction of the Asabe. (2008a)
51(3), 1051-1055(6).
4. Van Hirtum, A., Berckmans, D.: Considering the influence of artificial environmental noise
to study cough time-frequency features. Journal of Sound and Vibration. (2003a) 266 (3),
667-675.
5. Van Hirtum, A., Berckmans, D.: Fuzzy approach for improved recognition of citric acid
induced piglet coughing from continuous registration. Journal of Sound and Vibration.
(2003b) 266 (3), 677-686.
6. Guarino M., Costa A., Van Hirtum A., Jans P., Ghesquiere K., Aerts J. M., Berckmans D.:
Field tests of an algorithm to predict infected pig coughing. Annals of Animal Science.
Suppl. (2004) 1, 61-65.
7. Silva M., Ferrari S., Costa A., Aerts J. M., Guarino M., Berckmans D.: Cough localization
for the detection of respiratory diseases in pig houses. Computers and Electronics in Agri-
culture. (2008) 64, 286–292.
8. Exadaktylos V., Silva M., Ferrari S., Guarino M., Aerts JM, Berckmans D.: Time–series
analysis for online recognition and localization of sick pig (Sus scrofa) cough sounds.
J.Acoust. Soc. Am.(2009) 124 (6), 3803-3809.
9. Svensson C., Liberg P., Hultgren J.: Evaluating the efficacy of serum haptoglobin concen-
tration as an indicator of respiratory-tract disease in dairy calves. The Veterinary Journal.
(2007) 174, 288-294.
10. Kelley K.W.: Stress and immune function: a bibliographic review. Ann. Rech. Vet. (1980)
11:445-478.
Kelley, K.
39
