RIGID TEMPLATE REGISTRATION IN MET IMAGES USING CUDA
Lennart Svensson, Johan Nysj¨o, Anders Brun, Ingela Nystr¨om and Ida-Maria Sintorn
Centre for Image Analysis, Swedish University of Agricultural Sciences and Uppsala University, Uppsala, Sweden
Keywords:
Three-dimensional Rigid Registration, Normalized Cross Correlation, Molecular Electron Tomography,
CUDA.
Abstract:
Rigid registration is a base tool in many applications, especially in Molecular Electron Tomography (MET),
and also in, e.g., registration of rigid implants in medical images and as initialization for deformable regis-
tration. As MET volumes have a low signal to noise ratio, a complete search of the six-dimensional (6D)
parameter space is often employed. In this paper, we describe how rigid registration with normalized cross-
correlation can be implemented on the GPU using NVIDIA’s parallel computing architecture CUDA. We
compare the performance to the Colores software and two Matlab implementations, one of which is using the
GPU accelerated JACKET library. With well-aligned padding and using CUDA, the performance increases
by an order of a magnitude, making it feasible to work with three-dimensional fitness landscapes, here de-
noted scoring volumes, that are generated on the fly. This will eventually enable the biologists to interactively
register macromolecule chains in MET volumes piece by piece.
1 INTRODUCTION
The imaging modality Molecular Electron Tomogra-
phy (MET) is used for investigating biological struc-
tures, such as proteins or protein complexes, at the
subcellular level. Tomograms are created either from
in vitro buffer solutions of proteins or in situ tissue
samples. For both kinds of volumes, it is difficult to
draw biological conclusions by just visually analysing
the images, as they are rather cluttered, see Figure 1
for an example. Template matching or registration is
often used for searching and identifying objects of in-
terest in the tomograms. The templates can either be
an extracted object from a segmented electron tomog-
raphy volume or be constructed from atomic maps de-
posited in the protein databank (RCSB PDB) (Berman
et al., 2000), which are most often derived from X-ray
crystallography. The atomic data represents the rigid
conformation of the protein as found in a crystal. In
many cases this is close to the natural conformations
molecules appear in, hence rigid template matching
may in many cases be sufficient for the biologists to
understand the volume.
We believe that a semi-automatic or user guided
registration approach is desirable when working with
these volumes, due to the high complexity of both the
tomograms and the investigated biological processes.
The techniques presented in this paper is to be used in
conjunction with earlier presented visualization meth-
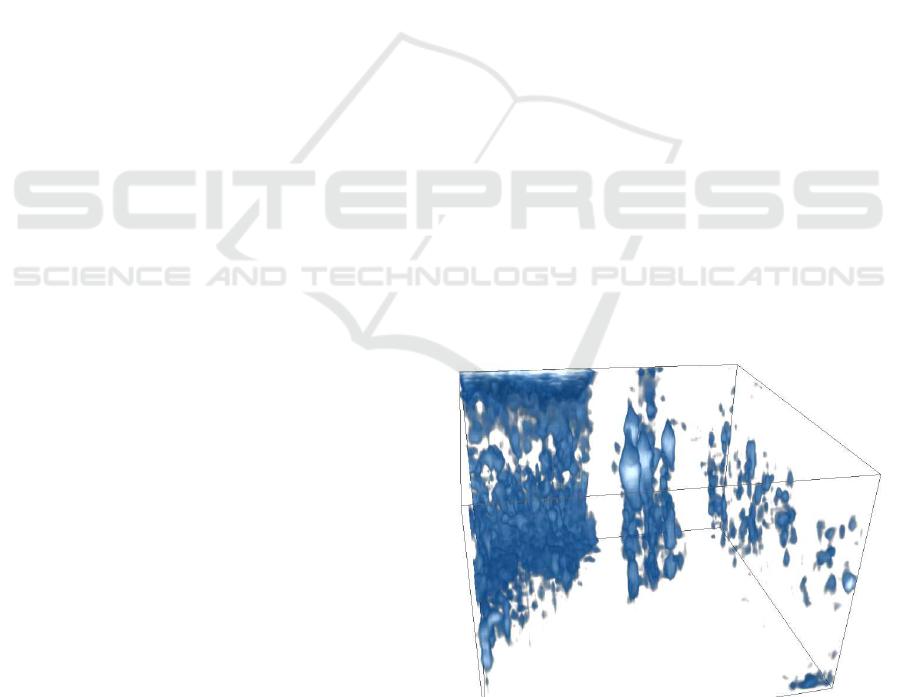
Figure 1: Example of an (in situ) MET volume of a desmo-
some holding two skin cells together. The desmosome is a
complex which contains various proteins extending through
the plasma membranes of the neighboring cells it holds to-
gether. In this image the plasma membranes are the two ver-
tical transparent areas, and the complex seen in the centre
of the image contains the extracellular part of the desmo-
some. Antibodies attached to gold particles have been used
to mark the presence of a certain type of protein in the
desmosome. Four gold particles are seen as bright and large
objects in the top middle of the volume.
ods (Svensson et al., 2011), using different projec-
tions of the complete fitness landscape for the 6D pa-
rameter space of 3D rigid registration. These projec-
418
Svensson L., Nysjö J., Brun A., Nyström I. and Sintorn I..
RIGID TEMPLATE REGISTRATION INMET IMAGES USING CUDA.
DOI: 10.5220/0003844804180422
In Proceedings of the International Conference on Computer Vision Theory and Applications (VISAPP-2012), pages 418-422
ISBN: 978-989-8565-03-7
Copyright
c
2012 SCITEPRESS (Science and Technology Publications, Lda.)

Figure 2: Interactive exploration of an MET volume (left) of the antibody IgG in solution and a score volume showing the
fitness value of the best registration at each position. The user clicks on a point in the right volume and sees the corresponding
registration in the left volume. Iso-surfaces are used to show particular intensity level in both volumes. The middle point in
the right image has the highest intensity. The IgG template is seen in the middle of the MET volume in dark grey.
tions are denoted score volumes. The idea is that the
user will mark a search area in the MET volume and
choose a template where after a complete search will
be performed in this area. The user can then explore
fits by clicking in different score volumes and see the
corresponding registration. This is illustrated in Fig-
ure 2 with a score volume example where each score
represents the best rotational fit of the template at that
position. When the user clicks in the score volume
the template is moved to the corresponding position
and rotated to the best rotation in the search volume.
When a specific position is selected, a new score vol-
ume for rotational registration can also be calculated
and displayed and help the user see if more than one
rotation of the template are possible (Svensson et al.,
2011). The aim of the interactive approach is to al-
low the user to start analysing the MET volume as
soon as it has been reconstructed, exploring different
templates, placements, and template combinations for
chosen interesting regions. This however creates the
need for close to real-time registration, which has lead
us to investigate GPGPU computation for the task.
CUDA and OpenCL have established themselves
as the two main alternatives for performing general-
purpose on the graphical processing unit (GPGPU)
computations. CUDA is developed by Nvidia for their
graphics cards, and OpenCL is an open standard de-
veloped by an industry consortium. The highest per-
formance is this far reported to have been achieved
using CUDA (Weber et al., 2011). Added the avail-
ability of the FFT library in the CUDA software de-
velopment kit (SDK) has led us to choosing CUDA
for the task.
We compare the speed of our CUDA imple-
mentation with that achieved using standard MAT-
LAB, GPU-accelerated MATLAB using the library
JACKET (JAC, ), as well as with the standard MET
registration software Colores
1
, (Chac´on and Wrig-
gers, 2002), and (Wriggers, 2010). All are based on
cross-correlation but differ slightly in methodology.
2 TEST DATA
As test data we have created volumes and templates
of sizes corresponding to typical MET experiments.
We have modelled the volumes after the scenario
in (Sandin et al., 2004) where antibodies (IgG) are
searched for in a MET volume image of a solution
containing antibodies. The volumes have a voxel size
of 5.24
3
A and a resolution of approximately 20A.
Since the computational time for our comparison
of rigid template registration implementations is in-
dependent of image content, we have generated cu-
bic noise images with sizes from 25
3
to 150
3
vox-
els. The independence of image content for computa-
tional time holds for the template as well. However,
since one of the comparisons is to the Colores soft-
ware which takes a PDB entry as well as resolution
and voxel size as input, a template created from the
very same PDB entry and with the same parameters
was used in all calculations.
1
situs.biomachina.org
RIGID TEMPLATE REGISTRATION INMET IMAGES USING CUDA
419
Rotations
Template
Volume
Rotated template
Padded volume Fourier volume
Fourier template Fourier result
Acc. result vol.Norm. vol.
Spatial result
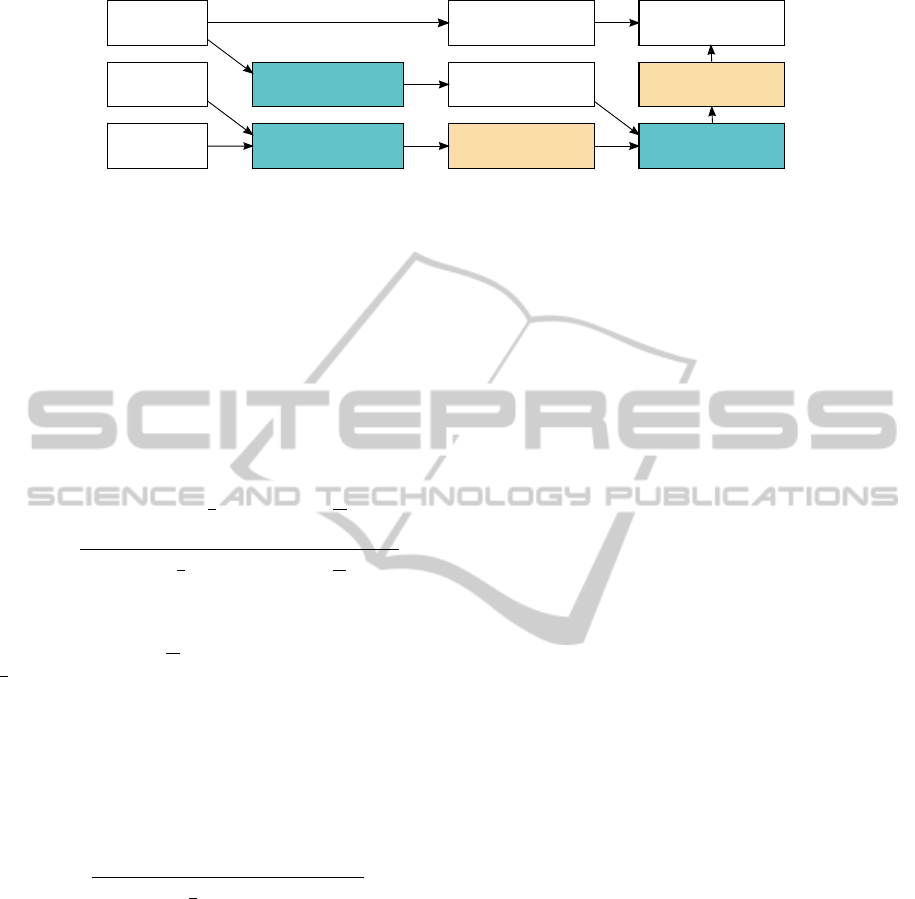
Figure 3: CUDA calculation pipeline. Each box represent one or two buffers in CUDA. Results in boxes with the same color
share memory buffer.
3 CORRELATION METHOD
We have chosen normalized cross-correlation which
is a relatively simple measure that still handles lin-
ear differences between sources well. That is, over-
all differences in intensity mean level and spread be-
tween the template and the search image covered by
the template are compensated for. It is described by
the equation:
s(u) =
∑
x
(I(x) − I
u
)(T(x− u) − T)
∑
x
(I(x) − I
u
)
2
∑
x
(T(x− u) − T)
2
1/2
,
(1)
with template T being one rotated instance of the
molecule to register. T is the mean of the template and
I
u
is the mean of the region under the template. The
computation of normalized correlation is performed
in the Fourier domain for computational efficiency ac-
cording to Lewis (Lewis, 1995).
If the template mean is subtracted from the tem-
plate, then Equation 1 simplifies to
s(u) =
∑
x
I(x)T(x− u)
∑
x
(I(x) − I
u
)
2
∑
x
T(x− u)
2
1/2
. (2)
The numerator corresponds to standard correlation
and is performed for each generated template, i.e.,
each investigated molecule rotation. The denomina-
tor contains the standard deviation for the template
and the volume patch under the template.
4 IMPLEMENTATION
4.1 CUDA
Looking closer at the method, we start with creat-
ing a template using a PDB entry of the specific
molecule to test. For the tests an IgG antibody tem-
plate was constructed from atom positions in PDB
(entry 1IGT (Harris et al., 1997)) following the proce-
dure by Pittet (Pittet et al., 1999). In brief, the inten-
sity value in each voxel is derived as the sum of con-
tributions from all atoms, each represented by a Gauss
kernel with size corresponding to the atom weight as
well as chosen resolution and voxel size. In this case,
a template of an IgG antibody was constructed in a
cubic image with size 24
3
voxels.
Figure 3 illustrates how the correlation is imple-
mented using CUDA. The results in boxes with the
same color are using the same memory buffer. All
data is stored in single precision floating point format.
The mean is first subtracted from the template while
in main memory, then both the template and volume is
transferred to GPU memory, with the template being
loaded into a 3D array bound to a texture. In this way,
rotations of the template can be generated using built-
in 3D point lookup with interpolation in textures.
The first step on the GPU is calculating the Fourier
transform of the zero-padded search volume using the
CUDA FFT library CUFFT from Nvidia. The base
padding is determined by the size of the template,
with the Fourier volume having size (
volume size
+
template size
)
3
. Additional padding is added to
make the Fourier transform fast to compute (well
aligned). The total size of one dimension should be
factorizable into powers of 2 with possible multiplica-
tions of other small prime numbers. The transformed
result is kept during the correlation calculations. The
method then tests one rotation at a time, by rotating
the template and transforming it to the Fourier do-
main. It is multiplied with the transformed search
volume, and the result is transformed back into the
spatial domain. Here, it would be possible to update
the accumulative result in different ways, but for now
we only save the best rotation found at each position.
The normalization is performed on the accumu-
lative result, when all template rotations have been
tested. As Lewis notes (Lewis, 1995), the standard
deviation can be calculated efficiently using running
VISAPP 2012 - International Conference on Computer Vision Theory and Applications
420
sums, which can be calculated when rewriting Var(X)
as E[X
2
] − (E[X])
2
.
4.2 Matlab
The implementation we have used is based on an open
source implemention (Eaton, 2011) adapted from the
built-in ’
normxcorr2
’ in Matlab. The algorithm is the
same as for CUDA. Internally Matlab uses the FFTW
library for Fourier transformation. Single precision
floating point format is used, for fair comparison with
this CUDA implementation. However, the perfor-
mance difference between double and single float pro-
cessing on 64-bit processors is quite small today, with
primarily a difference for division operations. Addi-
tionally, we have tested the implementation using the
GPU accelerator Jacket, version 1.8.0
2
.
4.3 Colores
Colores is a tool in the program suite Situs for molec-
ular fitting into MET density maps. It uses a slightly
different approach than our Matlab and CUDA imple-
mentations, not aiming at generating score volumes
but a list of candidate positions, which are explored
further using a refinement method. The method still
performs a complete search of the search volume,
so the methods are comparable in terms of perfor-
mance. The refinement step is not included in the
time measurements. We have used Colores in Situs
version 2.6.3. Similarly to Matlab, Colores also uses
the FFTW library for Fourier transformation.
Instead of using the normalized cross-correlation,
Colores applies a Laplace filter to both volumes as
pre-processing and then performs a standard correla-
tion. This derivative filter removes low frequencies in
the signal, reducing intensity variation, and increases
the response at edges, which reportedly gives better
results than standard cross-correlation (Chac´on and
Wriggers, 2002) without this additional preprocess-
ing filter step. However, it can still be sensitive to dif-
ferences in linear scaling of high frequency content.
The padding is set up differently in Colores, yield-
ing a different relation between the size of the in-
put volume and the size of the volume being Fourier
transformed. For smaller input volumes, the Colores
padding is smaller and for larger input volumes, it is
larger. Since the Fourier transformations and the mul-
tiplication in Fourier domain accounts for the major
part of the calculation time, the processing time in
Colores varies accordingly.
2
www.accelereyes.com/products/jacket
5 COMPARISON
The performance of the different implementations
have been compared on a computer with compara-
ble CPU and GPU in terms of purchase cost. Specif-
ically, the computer had an Intel Xeon E5439 2.66
GHz CPU, 8 GB RAM and an Nvidia Quadro FX
3700 graphics card with 512 MB memory.
All search volumes were constituted of random
values, which is feasible since normalized cross-
correlation is not an adaptive method. As input to
Colores, the volumes have been set to have a voxel
size of 5
3
nm. The resolution input parameter to Col-
ores was set to 20nm. The Euler angle mode was acti-
vated, with angle distribution according to a spread of
25.8 degrees, giving 994 rotations for each position.
For the CUDA and Matlab versions, 1000 rotations
were used. The CUDA kernels were run using a block
size of 128.
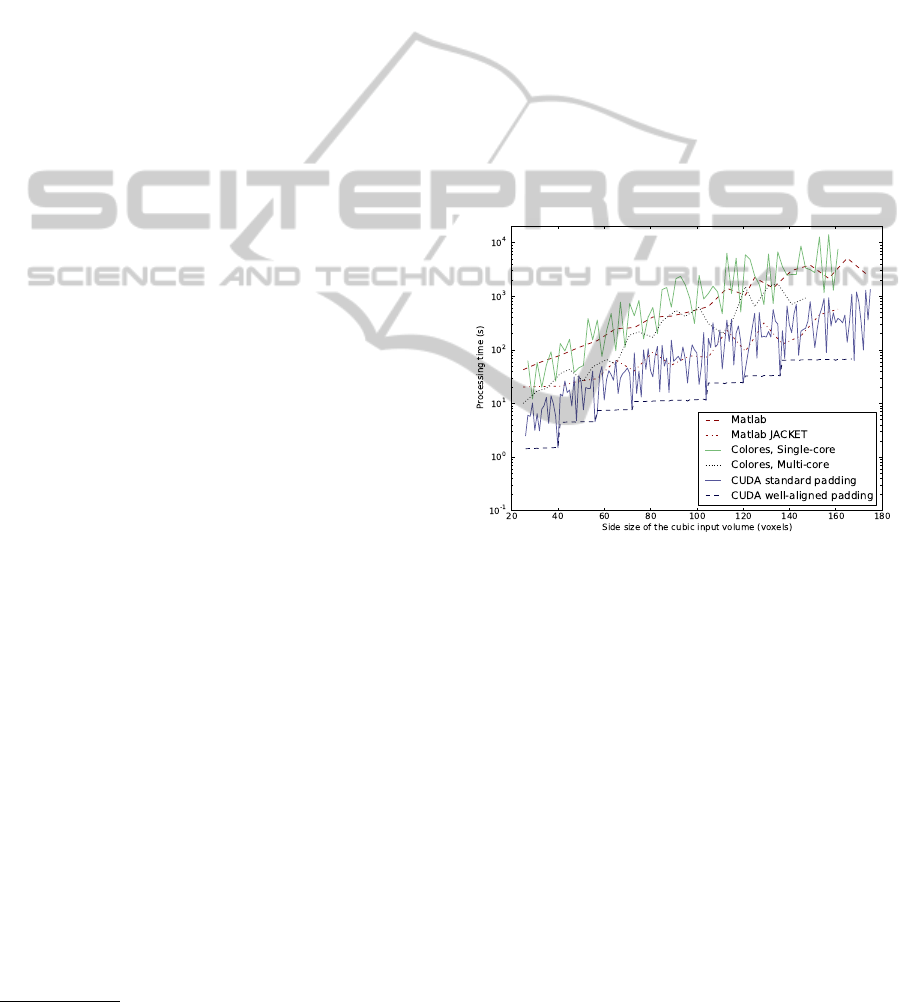
Figure 4: Processing time for different implementations of
rigid registration in relation to size of input volume.
The performance results are shown in Figures 4
and 5, as well as in Table 1. Figure 4 shows a semi
log plot of the processing times for the different im-
plementations for cubic volumes with sizes from 25
3
to 150
3
voxels. For the CUDA implementation, we
show the results both for the well-aligned padding
and the base padding. The well-aligned CUDA im-
plementation is the fastest of all compared methods.
The parallel processing in CUDA results in a speed
increase between 6-50 times compared to multi-core
CPU processing in Colores.
The plot in Figure 4 is shown in log scale. There-
fore, the actual times (in seconds) for three volume
sizes, 50
3
, 100
3
, and 150
3
voxels are given in Table 1.
As can be seen in the figures and the table, the CUDA
implementation using well-aligned padding is faster
than the other methods in the comparison, by around
a factor 10 for larger volumes.
RIGID TEMPLATE REGISTRATION INMET IMAGES USING CUDA
421
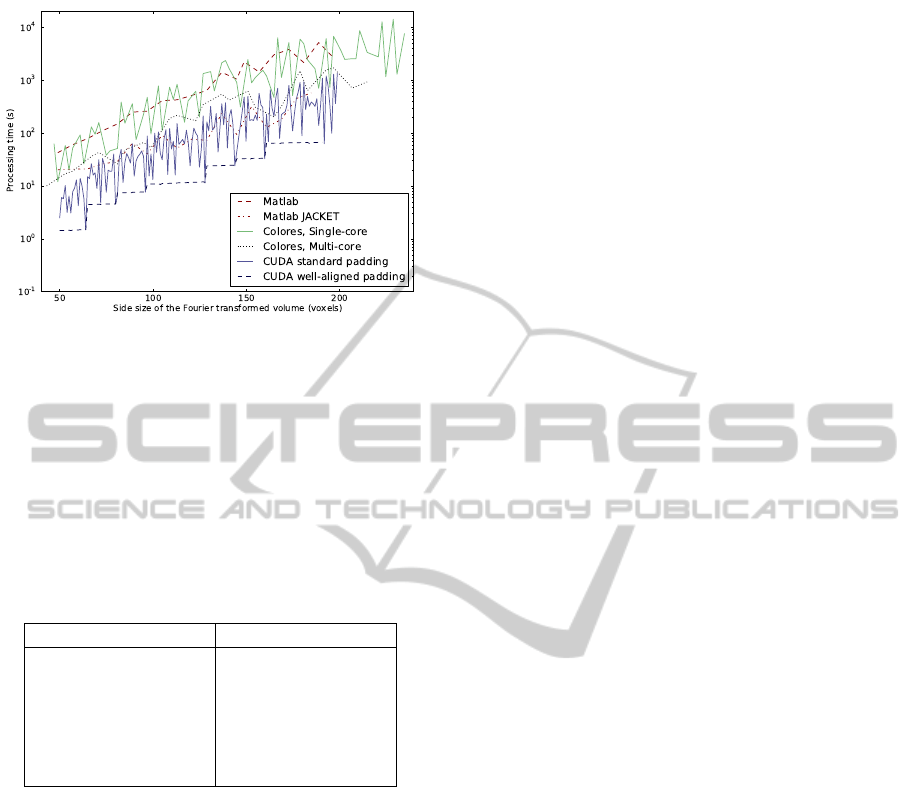
Figure 5: Processing time for different implementations of
rigid registration in relation to size of Fourier transformed
volume.
Additionally, Figure 5 shows the processing time
not for the input size, but for the volume size actually
being Fourier transformed, which differs between the
different methods due to different padding. The well-
aligned CUDA implementation is the fastest in this
comparison as well.
Table 1: Processing time in seconds for different sizes of
the search volume.
Volume size (voxels) 50
3
100
3
150
3
Matlab 273 1354 3577
Matlab JACKET 26 167 513
Colores 1 46 2451 2757
Colores 2 26 623 815
CUDA 1 13 47 156
CUDA 2 4.5 12 65
6 DISCUSSION
We describe an efficient implementation of 3D rigid
template registration based on the normalized cross-
correlation measure using CUDA. This has not, to the
best of our knowledge, been implemented on GPU be-
fore. We compare our implementation with the Col-
ores software and two Matlab implementations, one
of which is using the GPU accelerated JACKET li-
brary. We show the processing times when the same
size of input volume is used as well as when the same
size of the volume actually being Fourier transformed
in the different methods is used. The CUDA im-
plementation with well-aligned padding is the fastest
method in the comparison, with a factor of 10 for
large volumes compared to the Matlab JACKET and
the Colores implementation.
Implementing rigid registration for MET images
on GPU gives a substantial performance increase,
providing a base for advanced interactive image ex-
ploration and analysis of this kind of data in real-time.
The actual registration method requires no input from
the user. In the planned scenarios the user interacts
with the volumes by choosing templates and marks
regions where the registration should be performed.
The rigid search is performed, and within seconds it
will be possible to explore the 3D visualization of the
registration parameter space, the so called score vol-
ume. This is an important step for the interactiveanal-
ysis we have in mind for these volumes. Although the
method and implementation will only be able to han-
dle marked subvolumes due to memory constraints, it
will be possible to subdivide larger volumes and pro-
cess them sequentially, or add another layer of paral-
lelisation using multiple GPU:s.
REFERENCES
Berman, H., Westbrook, J., Feng, Z., Gilliland, G., Bhat, T.,
Weissig, H., Shindyalov, I., and Bournen, P. (2000).
The protein data bank. Nucleic Acids Research,
28:235 – 242.
Chac´on, P. and Wriggers, W. (2002). Multi-resolution
contour-based fitting of macromolecular structures.
Journal of molecular biology, 317(3):375–384.
Eaton, D. (2011). www.cs.ubc.ca/∼deaton/. Accessed on
Oct. 18, 2011.
Harris, L. J., Larson, S. B., Hasel, K. W., and McPherson,
A. (1997). Refined structure of an intact IgG2a mon-
oclonal antibody. Biochemistry, 36(7):1581–1597.
Lewis, J. P. (1995). Fast normalized cross-correlation.
www.scribblethink.org/Work/nvisionInterface/nip.pdf.
Pittet, J.-J., Henn, C., Engel, A., and Heymann, J. B. (1999).
Visualizing 3D data obtained from microscopy on the
internet. Journal of Structural Biology, 125:123–132.
Sandin, S.,
¨
Ofverstedt, L.-G., Wikstr¨om, A.-C., Wrange, O.,
and Skoglund, U. (2004). Structure and flexibility of
individual immunoglobulin G molecules in solution.
Structure, 12:409–415.
Svensson, L., Brun, A., Nystr¨om, I., and Sintorn, I.-M.
(2011). Registration parameter spaces for molecu-
lar electron tomography images. In Image Analysis
and Processing – ICIAP 2011, volume 6978 of LNCS,
pages 403–412.
Weber, R., Gothandaraman, A., Hinde, R., and Peterson, G.
(2011). Comparing hardware accelerators in scientific
applications: A case study. Parallel and Distributed
Systems, IEEE Transactions on, 22(1):58 –68.
Wriggers, W. (2010). Using situs for the integration
of multi-resolution structures. Biophysical Reviews,
2:21–27.
VISAPP 2012 - International Conference on Computer Vision Theory and Applications
422
