
DECISION-TREE BASED ANALYSIS OF SPEAKING MODE
DISCREPANCIES IN EMG-BASED SPEECH RECOGNITION
Michael Wand, Matthias Janke and Tanja Schultz
Karlsruhe Institute of Technology, Karlsruhe, Germany
Keywords:
EMG, EMG-based speech recognition, Silent speech interfaces, Phonetic decision tree.
Abstract:
This study is concerned with the impact of speaking mode variabilities on speech recognition by surface
electromyography (EMG). In EMG-based speech recognition, we capture the electric potentials of the human
articulatory muscles by surface electrodes, so that the resulting signal can be used for speech processing. This
enables the user to communicate silently, without uttering any sound. Previous studies have shown that the
processing of silent speech creates a new challenge, namely that EMG signals of audible and silent speech
are quite distinct. In this study we consider EMG signals of three speaking modes: audibly spoken speech,
whispered speech, and silently mouthed speech. We present an approach to quantify the differences between
these speaking modes by means of phonetic decision trees and show that this measure correlates highly with
differences in the performance of a recognizer on the different speaking modes. We furthermore reinvestigate
the spectral mapping algorithm, which reduces the discrepancy between different speaking modes, and give
an evaluation of its effectiveness.
1 INTRODUCTION
The past decades have seen rapid advancements in
all areas of automatic speech processing, including
speech recognition, spoken language translation, and
speech synthesis. With these developments, the use
of speech and language technologies has become in-
creasingly common in a large variety of applications,
such as information retrieval systems, voice-operated
cell phones, call center services, car navigation sys-
tems, personal dictation and translation assistance, as
well as applications in military and security domains.
Despite these achievements, speech-based inter-
faces working with acoustic speech signals still have
several limitations, i. e. the performance degrades
significantly when environmental noise is present,
and communication in public places is difficult since
bystanders may be disturbed and confidentiality is
breached by the clearly audible speech. Also, speech-
disabled people may be unable to use voice-controlled
systems.
A relatively novel approach to address these chal-
lenges is the application of Silent Speech Interfaces
(SSI), which are electronic systems enabling commu-
nication by speech without the necessity of emitting
an audible acoustic signal (Denby et al., 2010). In this
paper, we report on our most recent results in elec-
tromyographic (EMG) speech recognition, where the
activation potentials of the articulatory muscles are
directly recorded from the subject’s face via surface
electrodes.
Automatic recognition of silent speech by means
of electromygraphy is currently heavily investigated,
and the performance becomes good enough to allow
for communication applications (Wand and Schultz,
2011). The research focus of this study is the variation
of the EMG signal for different speaking modes, in
particular, for audibly spoken versus silently mouthed
speech. A first series of experiments was reported
(Wand et al., 2009; Janke et al., 2010a; Janke et al.,
2010b), where the authors investigated the differences
between audibly and silently spoken speech based on
the Power Spectral Density (PSD) of raw EMG sig-
nals. This quantity is an estimate of the energy an
EMG signal contains. Those experiments showed that
the PSD of EMG signals is lower for silent speech
than for audibly spoken speech, however, for phones
which create a relatively high sensorimotor feedback
when articulated, the PSD of this EMG signal seg-
ment will also be relatively high. It could also be
shown that for talented silent speakers with similar
recognition accuracies across all speaking modes, the
signal energy discrepancy is much smaller than for
less talented silent speakers.
In (Wand et al., 2011), the authors present a
different approach for studying the discrepancy be-
101
Wand M., Janke M. and Schultz T..
DECISION-TREE BASED ANALYSIS OF SPEAKING MODE DISCREPANCIES IN EMG-BASED SPEECH RECOGNITION.
DOI: 10.5220/0003787201010109
In Proceedings of the International Conference on Bio-inspired Systems and Signal Processing (BIOSIGNALS-2012), pages 101-109
ISBN: 978-989-8425-89-8
Copyright
c
2012 SCITEPRESS (Science and Technology Publications, Lda.)

tween audible and silent speech, namely by means of
phonetic decision trees. Phonetic decision trees are
commonly used in almost all state-of-the-art speech
recognition systems to model the effects of coarticu-
lation. We use phonetic decision trees as part of our
Bundled Phonetic Feature modeling (see section 3).
In (Wand et al., 2011), the results of the tree splitting
process are used as a diagnostic tool to explore the im-
pact of speaking mode dependencies on the phonetic
models of the EMG-based speech recognizer.
This study leverages off and improves this
method. In our first experiment, we investigate the
entropy gains which are associated with the decision
tree splitting process. We show that they give a mea-
sure for the discrepancy between audible and silent
EMG, and that this measure remains stable even when
spectral mapping (Janke et al., 2010a) is applied. We
compare the results to previously developed speaking
mode discrepancy measures (Wand et al., 2009; Janke
et al., 2010a) and show that they correspond well with
each other.
As a second experiment, we perform a detailed in-
vestigation on the EMG signals of whispered speech.
We show that whispered speech accords well with au-
dible speech, but also show that the spectral mapping
algorithm gives further improvements.
The remainder of this paper is organized as fol-
lows: Section 2 describes our corpus, and section 3
outlines the structure of the EMG-based speech rec-
ognizer and describes the phonetic feature bundling
algorithm. Sections 4 reviews the state-of-the-art
methods to describe speaking mode variabilities by
means of the EMG signal, and explains our new
method. In sections 5 and 6, we apply our method to
EMG signals of silent speech and whispered speech,
respectively. Finally, section 7 concludes the paper.
2 DATA CORPUS
For this study we used a subset of the EMG-UKA cor-
pus (Janke et al., 2010a), namely the subset of record-
ing sessions which contain EMG signals of audible,
whispered, and silent speech. The following descrip-
tion is based on (Wand et al., 2011).
The corpus of this study consists of eight speak-
ers, each of whom recorded between one and eleven
sessions, resulting in a total amount of 25 sessions
1
.
The recording protocol was as follows: In a quiet
room, the speaker read 50 English sentences for three
times, first audibly, then in whispered speech, and at
1
Note that we added one session which was not present
in the corpus for (Wand et al., 2011)
last silently mouthed. As an abbreviation, we call
the EMG signals from these speaking modes audible
EMG, whispered EMG, and silent EMG, respectively.
Each part consists of a BASE set of 10 sentences
which were identical for all speakers and all ses-
sions, and one SPEC set of 40 sentences, which varied
across sessions. However in each session, these sen-
tence sets were the same for all three parts, so that the
database covers all three speaking modes with paral-
lel utterances. The total of 50 BASE and SPEC utter-
ances in each part were recorded in random order. In
all recognition experiments, the 40 SPEC utterances
are used for training, and the 10 BASE utterances are
used as test set.
Figure 1: Electrode positioning (Wand et al., 2011) (muscle
chart adapted from (Sch
¨
unke et al., 2006)).
The EMG recording was done with a computer-
controlled 6-channel EMG data acquisition system
(Varioport, Becker-Meditec, Germany). All EMG
signals were sampled at 600 Hz. The electrode set-
ting uses six channels and captures signals from the
levator angulis oris (channels 2 and 3), the zygomati-
cus major (channels 2 and 3), the platysma (chan-
nel 4), the anterior belly of the digastric (channel 1)
and the tongue (channels 1 and 6). Channels 2 and
6 use bipolar derivation, whereas channels 3, 4, and
5 were derived unipolarly, with two reference elec-
trodes placed on the mastoid portion of the temporal
bone (see Figure 1). Similarly, channel 1 uses unipo-
lar derivation with the reference electrode attached to
the nose. Channel 5 remains unused since the signal
is unstable and contains too many recording artifacts.
In the audible and whispered parts, the audio
signal was simultaneously recorded with a standard
close-talking microphone connected to a USB sound-
card. The audio sampling rate was 16 kHz.
The total corpus for this study consists of the fol-
lowing amounts of data:
Data length (minutes)
Training Test Total
Audible EMG 69 19 88
Whispered EMG 71 20 91
Silent EMG 70 19 89
All modes 210 58 268
BIOSIGNALS 2012 - International Conference on Bio-inspired Systems and Signal Processing
102

3 RECOGNIZER SETUP
3.1 Feature Extraction
The feature extraction is based on time-domain fea-
tures (Jou et al., 2006). Here, for any given feature f,
¯
f is its frame-based time-domain mean, P
f
is its frame-
based power, and z
f
is its frame-based zero-crossing
rate. S(f, n) is the stacking of adjacent frames of fea-
ture f in the size of 2n + 1 (−n to n) frames.
For an EMG signal with normalized mean x[n], the
nine-point double-averaged signal w[n] is defined as
w[n] =
1
9
4
∑
k=−4
v[n+k], where v[n] =
1
9
4
∑
k=−4
x[n+k].
The high-frequency signal is p[n] = x[n] − w[n], and
the rectified high-frequency signal is r[n] = |p[n]|.
The final feature TD15 is defined as follows:
TD15 = S(f2, 15), where f2 = [
¯
w, P
w
, P
r
, z
p
,
¯
r].
As in (Jou et al., 2006; Wand et al., 2009), frame size
and frame shift were set to 27 ms respective 10 ms. In
all cases, we apply LDA on the TD15 feature to re-
duce it to 32 dimensions. The feature extraction may
be preceded by application of the spectral mapping
algorithm, see section 4.1 for a description of this al-
gorithm.
3.2 Bootstrapping the EMG-based
Speech Recognizer
For training the recognizer, we need precise phonetic
time-alignments of the training data set.
For audible and whispered EMG, these align-
ments can be relatively easily obtained by processing
the parallely recorded acoustic data with a conven-
tional speech recognizer. The setup of this recognizer
is described in (Jou et al., 2006). For silent EMG, this
method is impossible since no acoustic data exists.
Our method to obtain initial time-alignments for the
silent EMG data works by first training a recognizer
with the audible EMG training data of the same ses-
sion, and then applying this recognizer to create time-
alignments for the silent EMG data. This method is
called Cross-Modal Labeling (Wand et al., 2009).
3.3 Phonetic Feature Bundling
The EMG-based speech recognizer is based on three-
state left-to-right fully continuous Hidden Markov
Models (HMMs). In constrast to most state-of-the-art
acoustic speech recognition systems, the HMM states
are modeled not with phonemes, but with binary-
valued phonetic features (PFs) (Kirchhoff, 1999),
which represent articulatory properties of a given
phoneme, such as the place or the manner of artic-
ulation. Note that in earlier works, phonetic features
are also called articulatory features.
The architecture of the PF-based EMG decod-
ing system is a multi-stream architecture (Metze and
Waibel, 2002): the feature vector models draw their
emission probabilities not from one single source, but
from a weighted sum of various sources which corre-
spond to Gaussian mixture models representing sub-
states of PFs.
Figure 2: Structure of a multi-stream recognizer based on
Bundled Phonetic Features (BDPFs). Our system uses the
nine most common phonetic features as root nodes of the
BDPF trees. Note that substates (begin, middle, end) are
not shown.
Phonetic feature bundling (Schultz and Wand,
2010) is the process of pooling dependent features to-
gether, so that in the end one obtains a set of models
which represent bundles of PFs, like “voiced frica-
tive” or “rounded front vowel”. These models are
called Bundled Phonetic Features (BDPF), they play
a central role in our recognition system.
This pooling is performed by phonetic decision
trees, which implement a data-driven approach to
incrementally create specific models from general
ones (Bahl et al., 1991). The basic idea is to go
from general models to specific models by splitting a
model based on a phonetic question. Phonetic feature
bundling starts with seven models for each stream.
The models represent the beginning, middle, and end
states of the present or absent phonetic feature, plus
a silence state. The splitting questions cover both the
current phone and the left and right context phones.
DECISION-TREE BASED ANALYSIS OF SPEAKING MODE DISCREPANCIES IN EMG-BASED SPEECH
RECOGNITION
103
The criterion for the choice of the splitting question
in each step is the information gain or entropy loss
(Finke and Rogina, 1997). The splitting process stops
at a fixed number of 80 leaves for each tree, which on
average is the optimal number of leaves for this cor-
pus. Our system uses nine streams, which are based
on the nine most frequent phonetic features in the
EMG-UKA corpus: Voiced, Consonant, Vowel, Alve-
olar, Unround, Fricative, Unvoiced, Front, Plosive.
Figure 2 shows a graphical overview of the model
structure of this recognizer. (Schultz and Wand, 2010)
reported that a recognizer based on bundled phonetic
features outperforms a context-independent phone-
based system by more than 30% relative. On the
EMG-UKA corpus, the best average word error rate
of this recognizer when trained on audible utterances
is 24.12% (Wand et al., 2011).
The system allows to augment phonemes with ad-
ditional attributes, such as speaker properties or the
speaking mode. Our investigation of silent and whis-
pered speech based on decision tree properties lever-
ages off this method, see section 4.2 for the experi-
ment description and the results.
3.4 Training and Decoding
We trained EMG-based speech recognizers for each
recording session of each speaker (session-dependent
recognizers). The recognizers were trained on EMG
data from two speaking modes, where the training
data consisted of 40 SPEC sentences per speaking
mode (see Section 2).
For decoding we used the trained acoustic model
together with a trigram Broadcast News language
model giving a perplexity on the test set of 24.24. The
decoding vocabulary was restricted to the 108 words
appearing in the test set, which in previous works (see
i. e. (Schultz and Wand, 2010)) is the standard pro-
cedure for small session-dependent systems. We ap-
plied lattice rescoring to obtain the best weighting of
language model and acoustic model parameters.
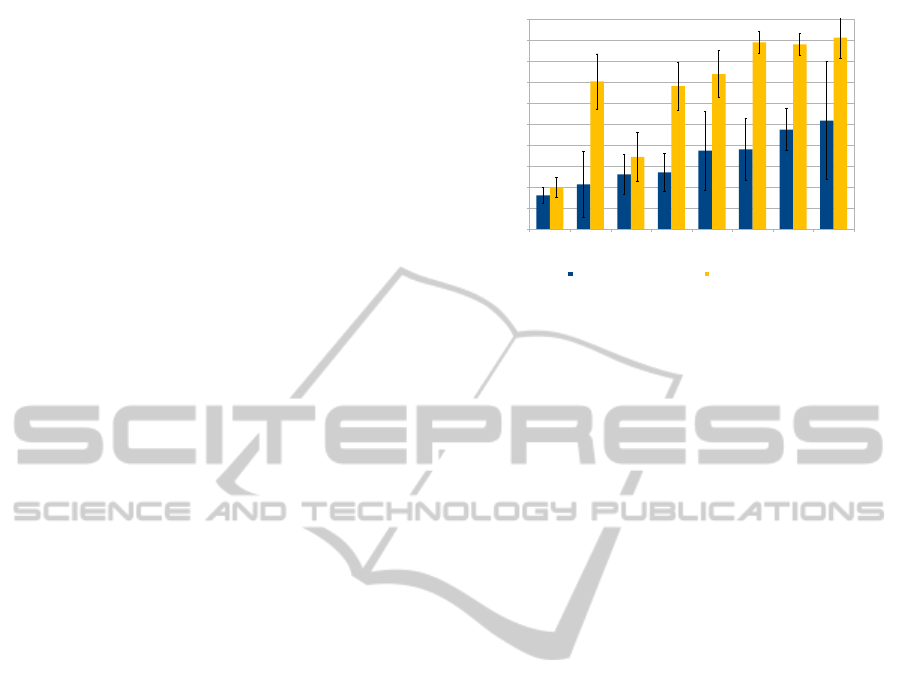
Figure 3 gives a breakdown of the recognition re-
sults of a mode-independent EMG-based speech rec-
ognizer trained on both audible and silent EMG data.
We trained session-dependent recognizers on all 25
sessions of the corpus and then averaged over all ses-
sions of each speaker. The average WER over all 25
sessions on audible EMG is 26.39%, while the aver-
age WER on silent EMG is 48.32%.
From Figure 3 we observe that (1) the perfor-
mance difference between silent and audible mode
is significant and (2) the performance varies greatly
across speakers. We also see that most speakers per-
form consistently across sessions.
0%
10%
20%
30%
40%
50%
60%
70%
80%
90%
100%
2
6
8
4
5
7
1
3
Word Error Rate (WER)
Speaker ID
Mean WER on Audible EMG
Mean WER on Silent EMG
Figure 3: Baseline Word Error Rates for audible and silent
EMG on a mode-independent recognizer. The error bars
give the confidence interval at a 5% confidence level.
4 DESCRIBING THE
VARIABILITY OF SPEAKING
MODES
In this section, we describe in detail how we extend
the BDPF algorithm introduced in section 3.3 to gain
insights into the variability of speaking modes. We
start with a review of previously developed methods
to quantify the discrepancy between audible, silent,
and whispered speech, and then lay out how our
decision-tree based method augments and improves
those results.
As a baseline measure for the discrepancy be-
tween the EMG data of different speaking modes in
a particular session, we use the difference between
the Word Error Rates of an EMG-based recognizer on
these speaking modes. The computation e. g. for au-
dible and silent speech works as follows: For a given
session, we train a mode-independent recognizer on
the training data sets of audible and silent EMG, and
then separately test the recognizer on the audible and
silent EMG test sets. The difference between the two
Word Error Rates is then used as our measure.
The rest of this section proceeds as follows: We
firstly give a review of the Power Spectral Density
Method for evaluating the discrepancy between dif-
ferent speaking modes (Janke et al., 2010a; Janke
et al., 2010b), and outline the spectral mapping algo-
rithm which has been crafted to reduce this discrep-
ancy. We then describe our new method to evaluate
the speaking mode discrepancy. The experiments and
results are given in sections 5 and 6.
BIOSIGNALS 2012 - International Conference on Bio-inspired Systems and Signal Processing
104
4.1 Review of Power Spectral Density
Methods
In a preliminary experiment (Wand et al., 2009),
it was shown that typically, EMG signals of silent
speech have lower power than EMG signals of audi-
ble speech. A more versatile investigation was per-
formed in (Janke et al., 2010a; Janke et al., 2010b),
where the Power Spectral Density (PSD) was used as
a measure for the variation between EMG signals of
different speaking modes. The Power Spectral Den-
sity is a measure of the energy which the EMG signal
contains at different frequency ranges. The compu-
tation follows Welch’s method (Welch, 1967), which
proceeds as follows (Janke et al., 2010a):
• The input signal is divided into windows with a
length of 30 samples, with 67% overlap.
• Each segment is windowed with a Hamming win-
dow to reduce spectral distortion.
• On each segment, a 256-point Fast Fourier Trans-
form is computed, yielding a Fourier representa-
tion of the signal.
• The square magnitude of the FFT is taken and
averaged over all segments, yielding the Power
Spectral Density (PSD) per utterance.
The PSDs are then averaged over all training ut-
terances of a particular session and speaking mode.
The result of this computation is a set of three PSD
curves representing the spectral contents of the audi-
ble, whispered, and silent EMG part of the given ses-
sion.
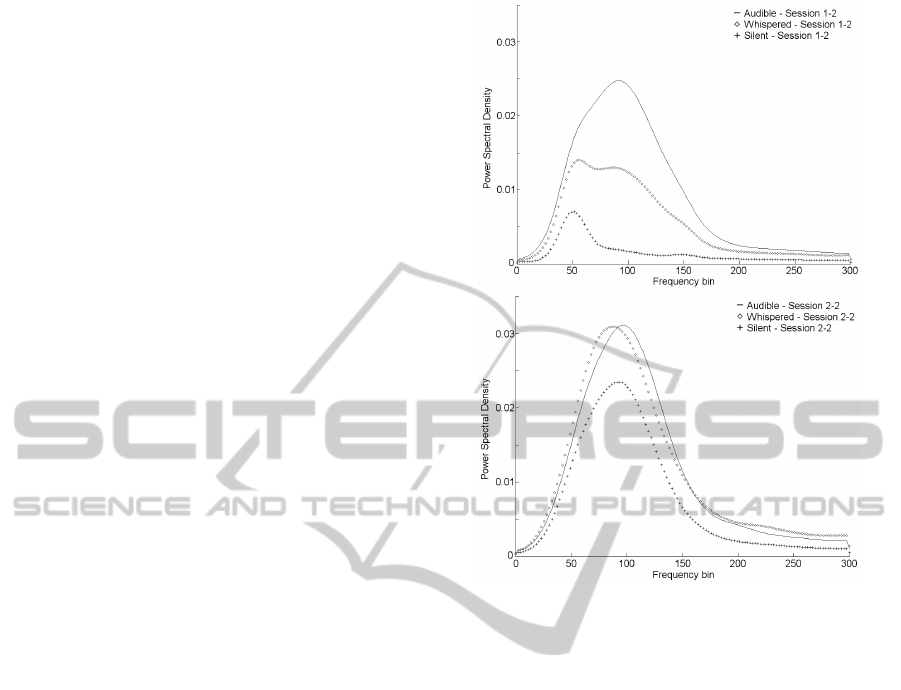
Figure 4 shows two exemplary PSD curves of the
EMG channel 6 for audible, whispered, and silent
speech. The above part shows the PSDs for the first
session of Speaker 1, who has moderate skills in
speaking silently. The curve shapes look similar, but
the amplitudes differ for the speaking modes: In par-
ticular, the PSD of silent EMG is always much lower
than the PSD of audible EMG. The PSD curve for
whispered speech is situated in-between the curves
for audible and silent EMG. Evaluated on separate
recognizers for audible, whispered, and silent EMG,
respectively, this speaker has a Word Error Rate
(WER) of 57.6% on audible EMG, while on silent
EMG the WER is 92.9%. Whispered speech is rec-
ognized with 62.6% WER.
The lower part charts the PSD curves of a well
practiced silent speaker (Speaker 2) with good recog-
nition rates for all speaking modes. The shape of
the PSD curves is somewhat different from those
of speaker 1, but in particular, the curves are much
closer together. Consequently, the WERs for the
Figure 4: PSD of EMG channel 6 of a novice silent speaker
(above) and an experienced silent speaker (below) for audi-
ble, whispered and silent speech.
three speaking modes are much more similar: Audi-
ble EMG is recognized with 17.2% WER, whispered
speech is recognized with 19.2% WER, and silent
speech is recognized with 18.2% WER.
This observation indicates that there is some rela-
tionship between the ratio of the PSD curves for dif-
ferent speaking modes and the WER difference be-
tween different speaking modes. In order to quantify
this statement, one can use the PSD Ratio between
speaking modes, which is determined by computing
the ratio of audible EMG and silent EMG PSD for
each channel and each frequency bin and taking the
maximum of this ratio over the frequency bins. (Janke
et al., 2010a) reports a correlation between PSD ra-
tio and WER difference of 0.72. In this study, we
find correlations of about 0.5, depending on the EMG
channel the PSD ratio is computed on. This dispar-
ity may be due to our slightly different recognizer
setup: (Janke et al., 2010a) train independent recog-
nizers for audible and silent EMG, whereas we train
mode-independent recognizers on training data from
both audible and silent EMG.
Based on the PSD ratio measure, (Janke et al.,
2010a) develops the spectral mapping algorithm
which reduces the discrepancy between audible and
DECISION-TREE BASED ANALYSIS OF SPEAKING MODE DISCREPANCIES IN EMG-BASED SPEECH
RECOGNITION
105
silent EMG. The spectral mapping algorithm is ap-
plied to raw EMG signals of silent speech and works
as follows:
1. One computes the channel-wise Power Spectral
Density (PSD) ratio of the silent EMG signals and
audible EMG signals, as a function of the fre-
quency. The result is averaged over all utterances
of one session. This frequency-dependent ratio is
called the mapping factor.
2. Each silent EMG utterance is transformed into the
frequency domain by the Fast Fourier Transform
(FFT), then every frequency component is multi-
plied with the corresponding mapping factor, and
the resulting transformed frequency representa-
tion of the signal is transformed back into the time
domain by the inverse FFT.
3. After this procedure, features are extracted from
the transformed signal as usual.
In (Janke et al., 2010a), it is shown that the spectral
mapping algorithm reduces the WER of a silent EMG
recognizer trained by the Cross-Modal Labeling ap-
proach by about 7% relative. When a recognizer is
trained on audible EMG and tested on silent EMG
without an intermediate training on Silent EMG data
(Cross-Modal Training), the improvement is much
higher, at about 12% relative.
4.2 Evaluating the Speaking Mode
Discrepancy based on a Polyphone
Decision Tree
In this paper we propose a new method to evalu-
ate speaking mode discrepancies between different
speaking modes. This method is based on our BDPF
framework (see section 3.3) and draws its validity
from the fact that BDPF bundling splits Gaussian
mixture models in a data-driven manner without re-
sorting to any kind of prior knowledge or assumption.
Our approach is to tag each phone of the training data
set with its speaking mode (audible or silent). We then
let the decision tree splitting algorithm ask questions
about these attributes.
While we do use the resulting models for our
EMG-based speech recognizer, our main target is a
different one: We follow the approach from (Schultz
and Waibel, 2001) and examine the entropy gains as-
sociated with the model splitting process.
The details are as follows: For each phonetic fea-
ture, the tree splitting process starts out with six root
nodes (plus a silence node, which is not considered
for splitting). In each step, one question is asked, and
one existing node is split, creating two new nodes.
This process is repeated until a stopping criterion is
met.
Each node split is associated to one question and
one entropy gain, which is the maximum entropy gain
possible at this step. When this algorithm has termi-
nated, there appear two kinds of questions:
• Questions about phonetic features (see section
3.3)
• Questions about the speaking mode.
Clearly, questions about the speaking mode may ap-
pear in several places across the tree, but the algo-
rithm forbids a question which has alredy been asked
to be repeated in any descendant node.
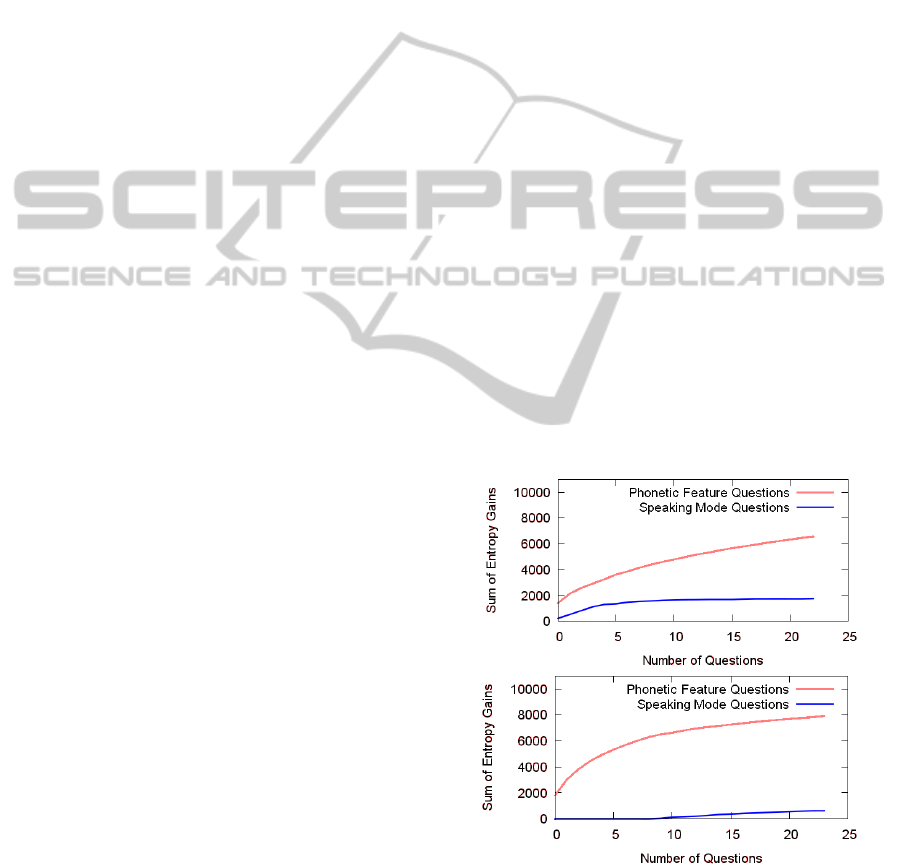
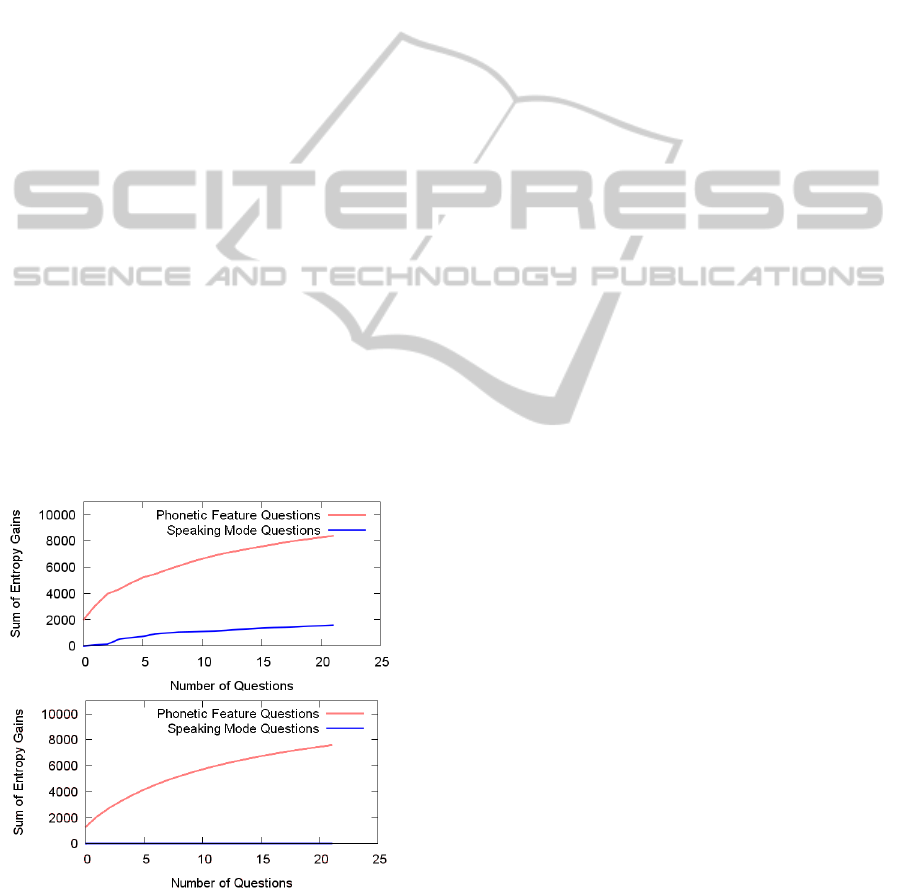
We now calculate the total entropy gain when
traversing the model tree. Figure 5 plots the en-
tropy gain for speaking mode questions and phonetic
feature questions over the total number of questions
asked, for a speaker where the discrepancy between
audible and silent speech is relatively large (above)
respectively relatively small (below). The values are
averaged over all nine PF trees. It can be seen that
in the latter case, the speaking mode questions do not
contribute much to the entropy gain at all, while in the
first case, the speaking mode questions are respon-
sible for a large amount of the entropy gain. How-
ever when more and more questions are asked, there
is hardly any further gain associated to speaking mode
questions. Note that we never normalize the entropy
gain.
Figure 5: Entropy gains for a speaker with high discrepancy
(top)/low discrepancy (bottom) between audible and silent
EMG, plotted over the number of splitting questions asked.
Based on this observation, we now consider all
PF trees and look at the one question which yields
the highest entropy gain of all questions about the
BIOSIGNALS 2012 - International Conference on Bio-inspired Systems and Signal Processing
106
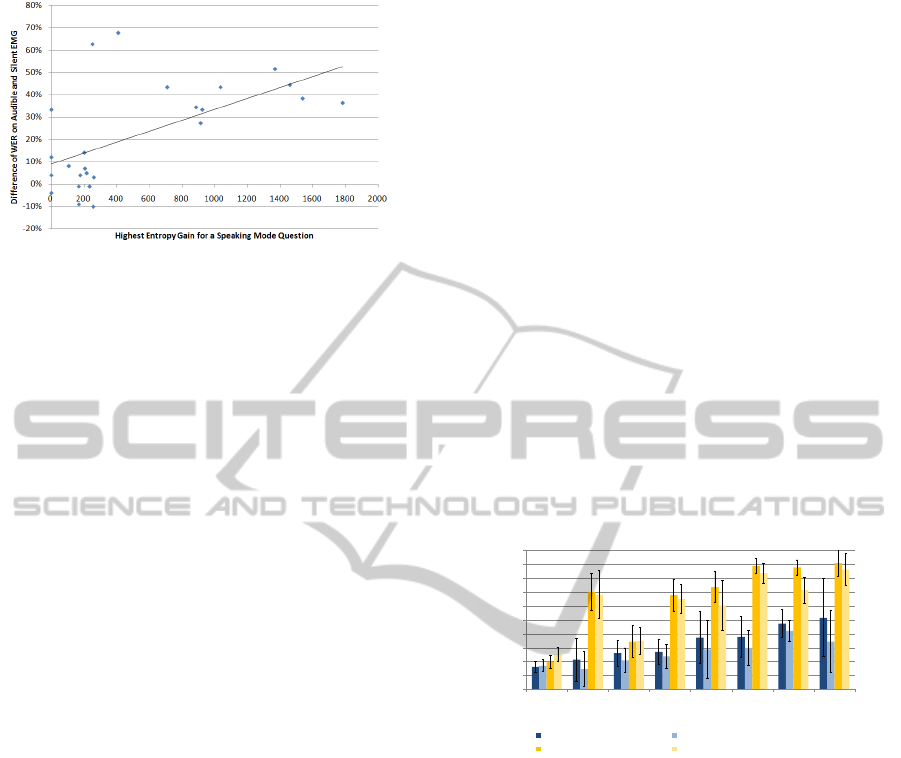
Figure 6: Scatter plot of the Maximum Entropy Gain and
the WER difference between silent and audible EMG, with
regression line.
speaking mode. We use this maximum entropy gain
as a measure for the discrepancy between speaking
modes: If there is hardly any difference between
speaking modes, the maximum entropy gain should
be small, possibly even zero if no speaking mode
question at all has been asked. If the EMG signals
of different speaking modes differ a lot, there should
be a high entropy gain associated to a speaking mode
question.
In (Wand et al., 2011), the authors present another
measure for the discrepancy between speaking modes
based on phonetic decision trees: In the final deci-
sion tree, the number of tree leaves dependent on the
speaking mode is counted. The fraction of “mode-
dependent tree nodes” (MDN) out of the set of all
nodes is then used as a measure for the speaking mode
discrepancy.
In sections 5 and 6, we will compare our entropy-
based method to the MDN method and show that they
yield similar results. One advantage of the entropy
gain measure is a local property of the decision trees:
When the decision tree gets larger and larger, the max-
imum entropy gain does not change any more. In
contrast to this, the fraction of mode-dependent nodes
may still change when the decision tree gets larger, so
in order to get a stable measure here, one must fix a
stopping criterion for the tree splitting.
5 EVALUATION ON SILENT EMG
As a first experiment, we take the baseline system
from section 3. We train session-dependent systems
on all sessions of our corpus, using both the audible
and the silent EMG training data set. The average
WER over all sessions is 26.39% for audible EMG
and 48.32% for silent EMG.
Figure 5 depicts typical entropy gain curves for
two different speakers: In the upper plot, we have a
speaker with a high discrepancy between audible and
silent EMG, in the lower plot, there is a speaker with
a low discrepancy. One can see that the entropy gains
are much larger in the first case than in the second
case, and that after a relatively small number of ques-
tions, the entropy gain does not change a lot any more
since the differences between modes are clustered out.
This observation suggests to use the maximum en-
tropy gain as a discrepancy measure between audible
and silent EMG, as described in section 4.2. The max-
imum entropy gain varies across sessions from zero
to 1781, with an average of 530, and correlates with
the WER difference between audible and silent EMG
with a correlation coefficient of 0.59. This is a higher
correlation than for the PSD ratio, where we only ob-
tain a correlation coefficient of 0.53.
We can also compare the maximum entropy gain
and the percentage of mode-dependent nodes, which
has been described in (Wand et al., 2011). Over
all sessions of our corpus, the percentage of mode-
dependent nodes varies between 0% and 95%, with
an average of 36%, it also correlates with the WER
difference with a correlation coefficient of 0.59.
0%
10%
20%
30%
40%
50%
60%
70%
80%
90%
100%
2
6
8
4
5
7
1
3
Word Error Rate (WER)
Speaker ID
Audible EMG, no Spectral Mapping
Audible EMG, with Spectral Mapping
Silent EMG, no Spectral Mapping
Silent EMG, with Spectral Mapping
Figure 7: Word Error Rates of an EMG-based Speech Rec-
ognizer trained on audible and silent EMG, with and with-
out spectral mapping. The error bars give the confidence
interval at a 5% confidence level.
Figure 6 shows a scatter plot of the maximum en-
tropy gain versus the WER difference. It can be seen
that the sessions fall into two main categories: On the
one hand, sessions with a very low WER difference
and, consequently, a very low maximum entropy gain.
On the other hand, sessions with a higher WER dif-
ference and a high entropy gain.
As a second experiment, we applied spectral map-
ping (see section 4.1) to the silent EMG data before
training and testing the recognizer. As expected, the
maximum entropy gain drops from and average of
530 to an average of 294. The correlation between
maximum entropy gain and WER difference remains
relatively high, the correlation coefficient is 0.43.
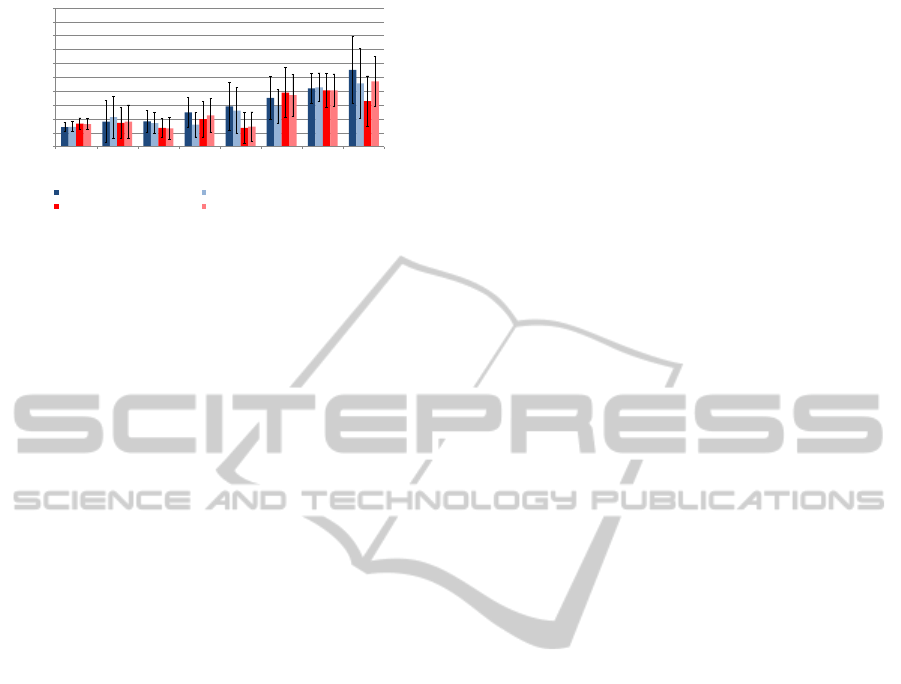
Figure 7 gives a full breakdown of the average
recognition results by speaker for audible and silent
EMG, with and without spectral mapping. One can
DECISION-TREE BASED ANALYSIS OF SPEAKING MODE DISCREPANCIES IN EMG-BASED SPEECH
RECOGNITION
107
observe that Spectral Mapping almost always yields
an improvement in both speaking modes, with the
sole exception of the very best speaker.
6 EVALUATION ON WHISPERED
EMG
Up to now, most research work has focused on the dis-
crepancy between the audible and silent EMG speak-
ing modes. Whispered EMG is considered in some
works (Janke et al., 2010a; Janke et al., 2010b), but is
not the main focus.
In this section, we train a recognizer on data from
both the audible and the whispered speaking mode.
We show that whispered EMG and audible EMG
are well compatible with each other, but that despite
that, spectral mapping applied to whispered EMG still
yields some improvement. We particularly investigate
the entropy gain associated with splitting models ac-
cording to questions about the audible and whispered
speaking mode.
As a first experiment, we take the trained Gaus-
sian mixture models and compute the entropy gains
associated with questions about the speaking mode.
It turns out that in our corpus, for most of the speak-
ers there is little difference between the audible and
the whispered speaking mode, which can be deduced
from the fact that there is hardly any entropy gain as-
sociated with questions about the speaking mode.
Figure 8: Entropy gains for a speaker with high discrepancy
(above)/low discrepancy (below) between audible and whis-
pered EMG, plotted over the number of splitting questions
asked.
Figure 8 shows the entropy gains for phonetic fea-
ture questions and speaking mode questions plotted
over the total number of questions asked. For speak-
ers 2 to 8, the curves generally look similar to the
lower one—asking speaking mode questions yields
practically no entropy gain. However for speaker one,
the discrepany between audible and whispered EMG
is quite high (see the above figure). Listening to the
audio recordings of speaker 1 shows that this speaker
has indeed a very quiet, almost inaudible way of whis-
pering, which may explain the observed discrepancy.
The mode-independent recognizer for audible and
whispered EMG attains a recognition rate of 23.19%
for audible EMG and 21.79% for whispered EMG,
averaged over all 25 sessions. It is instructive to com-
pare these recognition rates to a system which has
been trained exclusively on the audible or whispered
EMG training data set: In this case, audible EMG is
recognized with 29.74% WER, and whispered EMG
is recognized with 30.80% WER, on average. While
these two numbers are just as close as for the mode-
independent recognizer, we see that combining audi-
ble and whispered EMG data, which doubles the size
of the training data set, brings a large WER improve-
ment of more than 23% relative, which is just what
one expects when increasing the size of the training
data set with consistent data.
Finally, we apply spectral mapping to the whis-
pered EMG data. Just like in the case of silent EMG
data, we compute frequency-dependent mapping fac-
tors between whispered EMG and audible EMG for
each speaker. We then take each whispered EMG ut-
terance, transform it into the Fourier domain, multi-
ply each frequency component with the correspond-
ing mapping factor, and back-transform the modified
signal into the time domain.
This process improves the average WER on au-
dible EMG by about 6% relative, from 23.19% to
21.74%. The average WER on whispered EMG re-
mains unchanged. The result gets clearer if one con-
siders a breakdown of the improvement by speaker: It
turns out that indeed, for speaker 1 with a large dis-
crepancy between audible and whispered EMG, there
is a significant and large improvement for both speak-
ing modes. For the other speakers, the results show
more variation; in some cases the recognition result
gets worse when spectral mapping is applied.
7 CONCLUSIONS
In this paper, we proposed a new method to evaluate
the discrepancies between the audible, whispered, and
silent speaking modes in EMG-based speech recogni-
tion. We considered the phonetic decision trees which
BIOSIGNALS 2012 - International Conference on Bio-inspired Systems and Signal Processing
108
0%
10%
20%
30%
40%
50%
60%
70%
80%
90%
100%
2
6
8
4
5
7
1
3
Word Error Rate (WER)
Speaker ID
Audible EMG, no Spectral Mapping
Audible EMG, with Spectral Mapping
Whispered EMG, no Spectral Mapping
Whispered EMG, with Spectral Mapping
Figure 9: Word Error Rates of an EMG-based Speech Rec-
ognizer trained on audible and whispered EMG, with and
without spectral mapping. The error bars give the confi-
dence interval at a 5% confidence level.
are created during the training process of the recog-
nizers, allowed the decision tree creation algorithm
to split tree nodes according to the speaking mode,
and then considered the entropy gains which are as-
sociated with tree node splits due to a speaking mode
question.
We showed that the differences in silent speak-
ing style between speakers may be drastic, and that
an evaluation of the decision tree entropy gains
well characterizes the speaker’s ability to speak
silently. Comparing audible speech to silently
mouthed speech, we ascertained that the maximal en-
tropy gain which is due to a speaking mode question
may be used as a measure for the discrepancy between
speaking modes, and that this measure remains stable
even when the spectral mapping algorithm is applied.
Building upon this, we trained, for the first time,
an EMG-based speech recognizer on EMG record-
ings of both audible and whispered speech. It turned
out that whispered speech is, for most speakers, quite
compatible to audible speech, but that in the EMG-
UKA corpus, there is one speaker where the discrep-
ancy between audible and whispered speech in quite
large. We also showed that some accuracy gain can
be achieved with the spectral mapping algorithm.
Based on our decision tree analysis method, pos-
sible future work includes a more detailed phonetic
analysis of the discrepancy between audible and silent
speech, as well as the improvement of the spectral
mapping algorithm to take phone information into ac-
count.
REFERENCES
Bahl, L. R., de Souza, P. V., Gopalakrishnan, P. S., Nahmoo,
D., and Picheny, M. A. (1991). Decision Trees for
Phonological Rules in Continuous Speech. In Proc.
of the IEEE International Conference of Acoustics,
Speech, and Signal Processing (ICASSP), pages 185
– 188, Toronto, Ontario, Canada.
Denby, B., Schultz, T., Honda, K., Hueber, T., and Gilbert,
J. (2010). Silent Speech Interfaces. Speech Commu-
nication, 52(4):270 – 287.
Finke, M. and Rogina, I. (1997). Wide Context Acoustic
Modeling in Read vs. Spontaneous Speech. In Proc.
ICASSP, volume 3, pages 1743–1746.
Janke, M., Wand, M., and Schultz, T. (2010a). A Spec-
tral Mapping Method for EMG-based Recognition of
Silent Speech. In Proc. B-INTERFACE.
Janke, M., Wand, M., and Schultz, T. (2010b). Impact
of Lack of Acoustic Feedback in EMG-based Silent
Speech Recognition. In Proc. Interspeech.
Jou, S.-C., Schultz, T., Walliczek, M., Kraft, F., and Waibel,
A. (2006). Towards Continuous Speech Recogni-
tion using Surface Electromyography. In Proc. Inter-
speech, pages 573 – 576, Pittsburgh, PA.
Kirchhoff, K. (1999). Robust Speech Recognition Using
Articulatory Information. PhD thesis, University of
Bielefeld.
Metze, F. and Waibel, A. (2002). A Flexible Stream Archi-
tecture for ASR Using Articulatory Features. In Proc.
of the International Conference on Spoken Language
Processing (ICSLP), pages 2133 – 2136, Denver, Col-
orado, USA.
Schultz, T. and Waibel, A. (2001). Language Indepen-
dent and Language Adaptive Acoustic Modeling for
Speech Recognition. Speech Communication, 35:31 –
51.
Schultz, T. and Wand, M. (2010). Modeling Coarticulation
in Large Vocabulary EMG-based Speech Recognition.
Speech Communication, 52:341 – 353.
Sch
¨
unke, M., Schulte, E., and Schumacher, U. (2006).
Prometheus - Lernatlas der Anatomie, volume [3]:
Kopf und Neuroanatomie. Thieme Verlag, Stuttgart,
New York.
Wand, M., Janke, M., and Schultz, T. (2011). Investiga-
tions on Speaking Mode Discrepancies in EMG-based
Speech Recognition. In Proc. Interspeech.
Wand, M., Jou, S.-C. S., Toth, A. R., and Schultz, T. (2009).
Impact of Different Speaking Modes on EMG-based
Speech Recognition. In Proc. Interspeech.
Wand, M. and Schultz, T. (2011). Session-independent
EMG-based Speech Recognition. In Proc. Biosignals.
Welch, P. (1967). The use of fast fourier transform for
the estimation of power spectra: A method based
on time averaging over short, modified periodograms.
Audio and Electroacoustics, IEEE Transactions on,
15(2):70–73.
DECISION-TREE BASED ANALYSIS OF SPEAKING MODE DISCREPANCIES IN EMG-BASED SPEECH
RECOGNITION
109
